Excel Reporting in SpotlightXL
  • 46 Minutes to read
  • Dark
    Light
  • PDF

Excel Reporting in SpotlightXL

  • Dark
    Light
  • PDF

Article summary

Overview

With Excel Reporting, you can leverage the full set of formatting options natively available in Excel. You now have the best of both; the power of Dynamic Planning and the added flexibility of Excel. Use Excel Reporting when your model contains pertinent data that you want to use with a wide variety of Excel features to format an Excel Report, such as an Income Statement or Balance Sheet. With Excel Reporting, you can design and customize the worksheet as a report and freely place data and members from the model into the report. Data is updated from the cloud upon Refresh.

You can create an Excel Report from the Excel Reporting interface, but it can be tedious to add dimensions, members, and data items individually. To simplify the process, you can create a report based off:

ModelingImagesimage102.png

With Excel Reporting, users can:

  • Reference the data from Dynamic Planning in Excel
  • Design and run reports from Excel
    • Use a wide variety of Excel features for formatting the reports
    • Leverage Excel formulas, formatting, graphs, and other features
  • Publish the Excel workbook to Modeling
    • Publish (or upload) the workbook for collaboration
    • Open (or download) the workbook
  • Refresh data
    • Only data cells from Dynamic Planning are refreshed
    • Excel formulas and formatting options are retained as is during the refresh process

Excel Reporting Access

Power User Access: Power users have access to all Excel Reporting functionality.

Contributor User Access: For Contributor users, menu choices will depend on whether or not the Power user has been granted access to Design Excel Reports. By default, Contributor users have this access.

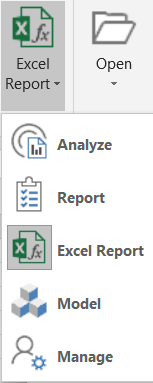
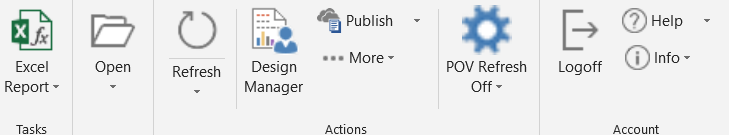
Contributors with design access have the following (initial) menu items:

ModelingImagesimage103.png

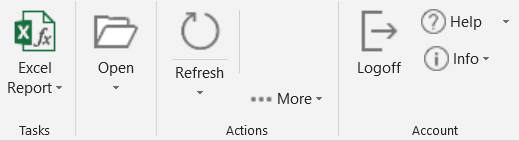
Contributors without design access have the following (initial) menu items:

ModelingImagesimage104.png

Reviewer User Access: For Reviewer users, menu choices are consistent because Reviewer users cannot design Excel Reports. The menu ribbon expands once you start working with a report.

ModelingImagesimage1041.png

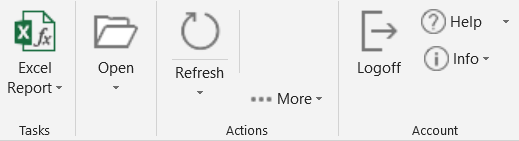
The following list of tasks is available for Reviewers and Contributors without design access:

  • Opening Excel Reports
  • Refreshing Excel Reports
  • Organizing Reports into Folders
  • Working with the Metadata Manager
  • Deleting SpotlightXL Formula Cells
  • Discovering and Filtering the Data Selection
  • Creating Snapshots
  • User Access to Models and Dimensions

The following example contains data and members from a model along with Excel formatting:

  • Table formatting is used
  • Conditional formatting is used
  • Font is changed to Arial Rounded Bold
  • Cell comments were added
  • Number formatting varies per quarter
  • Columns were inserted containing formulas and sub-totals
  • Totals were moved to the bottom and right

ModelingImagesimage92.png

Model and Dimension security works the same way as it works in Views and Reports. Power users have access to everything and can define access for all other users. Contributor and Reviewer users can access only the models and data to which they have been granted access.

If Contributor or Reviewer users do not have access to a member that is being referenced in a cell, they see #NO ACCESS instead of the data. If the member that is being referenced in a cell is not available in the model, users see #INVALID in the cell.

In the example below, the user does not have access to fiscal year 2016 and sees #NO ACCESS after clicking Refresh.

ModelingImagesimage118.png

Provide Users With Navigation Access

Generally, Contributor users have access to design views and formatted reports, and by default, they have access to design Excel Reports also. However, a Power user can turn off design access for Contributor users. This setting takes effect for every model in the application.

Note:
If you disable design navigation access to Contributors, both Contributor and Reviewer users will still be able to open and refresh Excel Reports that they have been given access to.

In Practice: Enabling or Disabling Navigation Access for Contributor User Roles

  1. Select the Manage and the Navigation Access subtask.
  2. For the Contributor role, under the Design Excel Report heading, select the Yes or No option to allow or disallow design access for Contributor users.
    ModelingImagesimage93.png

  3. Click Save.
Note:
Reviewer users never have design access to Excel Reports, similar to formatted reports. For the Role Reviewer, “Design Excel Report” is not an option.

Provide Group Access to Office Reports

Office Reports can be created and published so that other users can download them and refresh report data. The ability to publish and store reports in the cloud is a collaboration feature to make it easier to store the most common monthly reports in one place.

Publishing reports to the Dynamic Planning cloud is intended to be used for your organization’s standard monthly reports, such as those in a board book. A general guideline is to use it for fewer than 10 standard reports, although we support up to 50 reports per application, of no more than 16MB each.

Power users specify access to this feature by user groups. Specify which user groups can Open or Download only, or Publish (which includes Download) reports. Download is read-only. Publish is read-write.

In Practice

  1. Select Manage task and the Office Report, Setup subtask. Here, you can create a template that acts as a placeholder for each report that will be published and made accessible to users. One template can be used for either an Excel Report, Word Report, or PowerPoint Report. Each template reserves a spot for just one report in the Dynamic Planning cloud.
  2. Enter the report name.
  3. Enter the report description.
  4. Click Save.
  5. In the Group field, specify user groups that should have access to this report.
  6. For Access, specify whether user groups should be able to publish or download the report.
  7. Click Save.

ModelingImagesER-WR-PRTemplate1.png

Model-Level and Dimension-Level Security

Model and Dimension security works the same way as it works in Views and Reports. Power users have access to everything. Contributor and Reviewer users can access only the models and data for which they have been granted access. Power users grant access using Model Permissions and Dimension Locks.

If Contributor or Reviewer users do not have access to a member that is being referenced in a cell, they will see #NO ACCESS instead of the data. If the member that is being referenced in a cell is not available in the model, #INVALID appears in the cell.

Application Settings

Power users can set up two options for Excel Reporting; Display Progress Information and Display Blank Cells as Zeros.

Display Progress Information

To monitor the progress of a current operation (display a progress bar with supporting information), complete the following steps:

  1. Select the Manage task and the Application Administration > Application Settings subtask.
  2. In the “Display Progress Information After (in seconds)" field, select the number of seconds after which a Progress information box will display for operations that take longer than the specified number of seconds to complete. The default is None. You can enter any number between 1 and 60. For example, if you select 1, the progress bar will appear after 1 second. If you select Immediate, the Progress box will appear immediately after certain user operations.

ModelingImagesimage96.png

Note:
After changing any application setting, you must save, logoff, close the workbook, and restart Excel to see the changes.

User Operations with Progress Information

The following operations will display a progress bar if display progress information is other than None.

  • Capture Data as SpotlightXL Formulas
  • Capture Entire Workbook
  • Refresh
  • Refresh All

The image below shows an example of the progress when capturing data as Spotlight formulas.

ModelingImagesimage98.png

Note:
If you click Cancel, SpotlightXL asks you to confirm that you want to cancel. Depending on the type of operation in progress and how far along the operation was, SpotlightXL may stop immediately or complete the operation in the current worksheet but stop before proceeding to the next worksheet.

Displaying Blank Cells with Zeros

The Display Blank cells with Zeros field (shown below) allows you to select to display any data cells with no value as zeros. The default is Yes. Any Excel Report that contains data cells with a null value will display those data cells as zero if this option is set to Yes.

ModelingImagesimage99.png

A View containing both zero and blank data cells is shown below.

ModelingImagesimage100.png

A View converted to an Excel Report where blank cells with zeros are set to yes as shown below.

ModelingImagesimage101.png

Excel Reporting Comparison to Views and Reports

The table below highlights the similarities and differences between views, reports, and Excel Reports.

View

Report

Excel Report

Interactive query and analysis

Formatted report with restrictions on page, row, and column axes placement

Formatted report with no restrictions

Excel and web interface

Excel and web interface

Excel interface

No Formatting

Support for most commonly used formats

Support for a wide variety of Excel formats

Reference data from one model

Reference data from multiple models

Reference data from multiple models


Support for substitution variables

Support for substitution variables

Save data to a single model

Save data to multiple models

No saving of data

Runs calculation process

Runs calculation process

No running of calculations

Drill Through data is supported

Drill Through data is supported

Drill Through data is not supported

Model and dimension security are supported

Model and dimension security are supported

Model and dimension security are supported


Publishing to the cloud is supported

Creating an Excel Report from a View

Just as you design a report from a view by selecting Design Report, you can also create an Excel Report from a view by selecting Design With, Excel Report. This action replaces all POV, member, and data cells with Spotlight formulas. Once you have the Spotlight formulas, you can Refresh the data and format your Excel Report however you want.

There are two ways to convert views to Excel Reports:

Using the Design With, Excel Report subtask

In Practice: Creating an Excel Report Based On a View

  1. Select the Analyze task and the Data subtask.
  2. Select a view from the folder structure. Notice that the tab displayed is called Analyze.
    ModelingImagesimage132.png

  3. Under the Data subtask, select Design With, Excel Report, which converts the view to an Excel Report and places it into a new worksheet that is named for view that was converted. The menu changes to reflect the options for Excel Reports. All data items show as #REFRESH, and cell contents consist of SpotlightMetadata or SpotlightData formulas.
    ModelingImagesER-WR-PRimage131.png
    ModelingImagesER-WR-PRimage133.png

  4. Format and lay out your Excel Report.
Note:
If your view uses Display Label, the resulting Excel Report does not display the label initially after conversion. After you click Refresh, the labels appear.

Using Capture Data

You can also convert views to Excel Reports with the Capture Data as SpotlightXL Formulas menu command.

In Practice

  1. Select the Analyze task and the Data subtask.
  2. Select a view from the folder structure. Notice that the tab displayed is called Analyze.
  3. Under the More menu on the ribbon, click the down arrow and select Capture Data as SpotlightXL Formulas. Notice that all the data items show as #REFRESH and cell contents consist of SpotlightMetadata or SpotlightData formulas.
    ModelingImagesER-WR-PRimage134.png
    ModelingImagesER-WR-PRimage135.png

    Note:
    If you click Get Data, a warning message appears because you are in the Analyze tab, the Get Data command places data values from the model into the cells, and this overwrites the Spotlight formulas if you answer Yes to the warning message.
    ModelingImagesimage136.png
  4. Copy the entire contents of the Analyze worksheet to a new blank worksheet.
  5. Select Excel Report from the Select Task menu. The menu changes to reflect the options for Excel reports.
    ModelingImagesER-WR-PRERMenuItem.png

  6. Click Refresh.
    Note:
    If your view uses Display Label, the resulting Excel Report does not display the label initially after conversion. After you click Refresh, the labels appear.

Creating an Excel Report from a Formatted Report

If you have existing formatted reports and would like to convert them into Excel Reports, open the report and click Capture Data. You can Capture Data from either Run mode or Design mode.

With this option, you can convert your existing reports into Excel Reports and there is no need to redesign the reports from scratch.

Note:
Clicking Capture Data from the Report menu converts the cells to Spotlight formulas. Clicking Capture Data from the Analyze menu converts the cells to formatted reporting cell comments.

Additionally, if you have existing formatted reports in a workbook with multiple worksheets, you can convert all tabs to Spotlight formulas with one action, Capture Entire Workbook.

ModelingImagesER-WR-PRimage140.png

Creating an Excel Report with Multiple Models

Excel Reporting supports access to multiple models within one report, including Exclude POV functionality. Because Spotlight formulas are created and modified using the Design Manager interface, the same features and functions available in Design Manager in formatted reports are also available in Excel Reports.

In the following example, two models are combined to appear in one Excel Report. The first worksheet is a View of model Demonstrate Excel Report called Basic. The second worksheet is a View of model Demonstrate Excel Report 2, also called Basic. The views contain data for the same company in different years.

ModelingImagesER-WR-PRimage162.png

Selecting Analyze Data, Design With, Excel Report on both sheets makes it possible to copy the data items needed to a new blank worksheet. A new joint report shows data from both models. Each cell containing a POV, member name, or data item contains a Spotlight formula.

ModelingImagesER-WR-PRimage163.png

The two POVs are Company and Department. By checking the Share POV box next to the model name, each POV is set to affect both models upon Refresh.

ModelingImagesER-WR-PRimage164.png

ModelingImagesER-WR-PRimage164b.png

Selecting a different company or department and clicking Refresh updates data for both years.

ModelingImagesER-WR-PRimage165.png

If you want to exclude one of the POV changes from one month of data, for example, you can set Exclude POV for those data cells. In the example below, data for March 2014 will not be refreshed whenever the Department POV is changed.

ModelingImagesER-WR-PRimage166.png

At the next Refresh, the data for March 2014 reverts to the summary-level data for All Departments.

ModelingImagesER-WR-PRimage167.png

Understanding Which Cells are Associated with Which Model

If you are working with a report unfamiliar to you, Excel Reporting provides a method to visually show you which cells are associated with a particular model or dimension member.

  1. Select all cells in the worksheet by clicking above and to the left of cell A1, then click Design Manager.
    ModelingImagesER-WR-PRimage168.png

    The Model is displayed at the top; use the drop-down menu to view other models utilized in the report.
  2. Select another model in the report and observe the changes.
    Note:
    Shared POVs between models are counted only within the model where the POV was initially created.
  3. Identify cells containing a specific dimension member within their formula.
  4. Select an Account member, click the Member Select icon, and then select Preview Filter Member.
  5. This feature reveals cells containing that member in their Spotlight formula.
    ModelingImagesER-WR-PRimage170.png

  6. Click OK or Cancel to return to the Design Manager or Metadata Manager.
    ModelingImagesER-WR-PRimage171.png

  7. To change the formula to use a different member, once again, select all cells in the worksheet and click Design Manager or Metadata Manager.
  8. Select the member you want to change, use the Member Select Icon, then select Filter Member. Isolated cells containing that member are shown, enabling changes specifically to those cells within the Design/Metadata Manager.
    Note:
    Only Contributor users with design access can modify member selections in the Design Manager.
  9. In the example where cells containing "6112 – Salaries: Part Time" are filtered, any changes made in the Design Manager will affect only the filtered cells.
  10. Reviewer users and Contributor users without design access won't have the "Select Member" and "Select Cell Reference" menu items, won't see the "New Value" column, and cannot modify member selections.
  11. Click Select, then Update to finalize the change (available only to Contributor users with design access).
  12. Click Refresh.

Working with the Excel Reporting Menu Items

The menu items you may have access to are based on the role and privileges described above.

Open

Opens the folder structure, which contains reports.

Design Manager

Opens Design Manager, where you can set up data intersections, members, or point of view (POV) drop-downs for your Excel report.

Metadata Manager

View the dimensions and members that are used in the report.

Refresh

Refreshes all data except for POV data.

More Menu

Provides options to create a snapshot report, Copy Spotlight Formulas to the Clipboard, or Paste Spotlight Formulas from the Clipboard.

POV Refresh

Optionally, it automatically refreshes all data whenever a POV is changed. You can choose from automatic refresh off, for the current sheet, or for the whole document.

Publish

Save reports to the Dynamic Planning Cloud where they will be stored for other users to download.

Open

Open the folder structure to perform the following:

  • Add a folder
  • Rename a folder
  • Delete a folder
  • Download an Excel Report

After the Power user has created a template for the report, and a user with Publish privilege has published the report, a user with Publish or Download privilege can download the report.

In Practice

  1. After logging into SpotlightXL, SpotlightWord, or SpotlightPPT, start with a blank workbook, document, or deck. In Excel, click Excel Report from the left main menu.
  2. Click Open. A search box appears and you see the reports that have been published and that you have access to.
    Reviewer and Contributor users without design access see the following screen:
    ModelingImagesER-WR-PRDownload1.png

  3. Click the report (for example, 2014 Operating Expense) and click Download.
  4. Modeling downloads the report and immediately asks you to save a local copy of the report. Select the folder on your computer where the report should be saved and click Save.
  5. The report is opened separately from the blank report you started with. All Modeling metadata and data cells appear as #REFRESH for security purposes. Upon clicking Refresh, you can see only those members and data cells you have access to.
  6. Click the SpotlightXL, SpotlighttWord, or SpotlightPPT menu item.
    ModelingImagesER-WR-PRDownload2.png

  7. Click Refresh. If there are multiple pages in the report, click Refresh All.

Now you can use the report.

Users with publish privilege can click Publish whenever they want to upload the latest. Because the name of this report was already embedded in the workbook, document, or deck when it was first published, they do not need to select the report template name again.

Warning:
If you download a report and someone else has also downloaded the report, whoever makes changes and publishes them first will be able to complete the upload. If Modeling detects that the version you are working with is not the latest, when you attempt to Publish, Modeling tells you that your version is out-of-date. For this reason, it is best if only one user is given access to publish reports.

As has been described, when you download a report, you will save a local copy of the workbook. If you attempt to download the same report again and save the local copy to the same file name and location, Modeling first asks if you want to replace the file.

If you click Yes, you see an error message:

ModelingImagesimage117.png

To avoid this error, you can save the second download to a different file name, or you can close the first download before downloading a second time.

Folder Structure

Both the Open and Publish buttons open a box with the reports listed in a folder structure.

Reports are listed or omitted from the two boxes based on their status.

  • A report template created by a Power user but not yet published will be listed in the Publish box but not the Open download box.
  • A report template that has been published will be listed in the Open box but not the Publish box.
  • By default, reports are placed into the parent folder.
  • You can click Add Folder to create a folder to organize your reports. Then drag and drop the reports into the folder.
  • The same folder structure appears in the Publish box.
  • To delete a folder, right-click it and select Delete.
  • To rename a folder, right-click it and select Rename.
  • If a folder contains a report, you cannot delete the folder. You will see an error message, “The folder has children and cannot be deleted.”

Design Manager

You use this action to design your Excel Report. This action opens Design Manager, where you can set up data intersections, members, substitution variables, or point of view (POV) drop-downs for your Excel report.

In Practice: Designing an Excel Report

  1. Begin by placing your cursor on cell A1 and then click Design Manager.
  2. In the Design Manager interface, select a model from the Model drop-down.
  3. Click on POV and select a dimension (in this case, Company) from the Dimension list box to establish a POV for the Company dimension.
    ModelingImagesimage106.png

  4. Click Update. You will notice that cell A1 now displays the dimension member for the Company, and the cell's contents consist of a SpotlightMetadata formula. Additionally, the ribbon changes to reflect Design Manager and Refresh. Cell A1 now contains a drop-down menu allowing the selection of a member from the Company dimension.
    ModelingImagesimage107.png

  5. Select cell B1 and click on Design Manager. Then, click on Data to set up a Data intersection and proceed by clicking Update.
    ModelingImagesimage108.png

  6. Observe that cell B1 now displays #REFRESH, and its contents contain a SpotlightData formula, as shown below.
    ModelingImagesimage109.png

  7. Click Refresh, and the data will be retrieved as displayed below.
    ModelingImagesimage110.png

  8. Now, change the cell format to a numeric format, such as the Accounting format. Click Refresh again. Your formatting selection will be retained.
    Warning:
    Avoid modifying the contents of SpotlightMetadata or SpotlightData formulas.
  9. Select cell A2, click Design Manager, click Member, and select Account from the Dimension list box.
    ModelingImagesimage111.png

  10. Click Update. You will notice that cell A2 now displays the member from the Account dimension, and its content is a SpotlightMetadata formula.
    ModelingImagesimage112.png

    Note:
    There is no concept of Design mode and Run mode when using Excel Reporting. You work within a worksheet, such as Sheet 1, or multiple worksheets, where you can insert or view text, numbers, formulas, formatting, and SpotlightXL items with a live connection to the application and model in the cloud.
  11. Copy or move the contents of cell B1 to any other location within the worksheet. You can create multiple copies and format them as needed. The format remains intact upon clicking Refresh.
    Important:
    As it's easy to accidentally lose Spotlight formulas by typing over them and pressing Enter, Dynamic Planning safeguards cells containing them. The contents are not changed or deleted if you attempt to delete or overwrite a cell with a Spotlight formula. However, select two or more adjacent cells together to delete the Spotlight formula and press Delete. You can use Undo if a mistake occurs.

Metadata Manager

Reviewer and Contributor users without design access have Metadata Viewer on the menu ribbon. Metadata Manager allows you to view the dimensions and members that are used on the report.

Note:
Metadata Viewer is called Design Manager for users with design access. The Design Manager allows users to make changes whereas the Metadata Manager gives users read-only access.

Metadata Viewer provides information only on cells with Spotlight formulas. If you click around in the worksheet, you see that some cells are plain text, some have Excel formulas, and some have Spotlight formulas.

Spotlight formulas have two variations:

  • SpotlightMetadata()
  • SpotlightData()

ModelingImagesER-WR-PRimage195.pngModelingImagesER-WR-PRimage196.png

Warning:
Do not modify the contents of SpotlightMetadata or SpotlightData formulas.

In Practice

  1. Click on a POV cell, such as the one representing the Company.
  2. Select Metadata Viewer.
    ModelingImagesER-WR-PRimage197.png

  3. You will observe that the current member used from the Company dimension is Everest Cycles Company.
  4. Click Close.
  5. Proceed by clicking on a data cell.
    ModelingImagesER-WR-PRimage198.png

  6. From the ribbon, select Metadata Viewer.
  7. Here, you will notice that the data cell was generated from the intersection of all listed dimensions and their respective members. Please note, that this list of members might differ from the current POV selections. For instance, if the POV for Departments is "Cost Centers," in the Metadata Manager, the Departments member might display as "All Departments." The Metadata Manager showcases how the data cell was initially created. When you modify the POV in the worksheet and then click Refresh, the data dynamically updates from the model, while the original formula remains unchanged.
    Note:

    If the model includes Attributes, they will be indented under the associated dimension. Grayed-out Attributes are not currently in use.

    ModelingImagesimage199.png

  8. Click Close.
  9. If you possess Publish privileges, you can click on Publish within the menu ribbon to upload the model, incorporating any changes you have made.

Refresh

In the worksheet containing the Excel Report, click Refresh. The data is retrieved. If you have more than one worksheet containing an Excel Report, you can select Refresh All.

Note:
When you click Refresh or Refresh All, avoid doing anything else in the workbook or other workbooks until the Refresh operation is complete. In large workbooks, Refreshing is a lengthy operation. If you do anything else in Excel or other applications on your computer before the Refresh is complete, SpotlightXL detects it as an interruption and may display some cells as #REFRESH when done.

POV Refresh

Click POV Refresh on the menu to select from the refresh options. POV Refresh controls whether or not the data is refreshed automatically when you select a different POV from the page axis. You can turn the option off, turn it on for the current worksheet, or turn it on for the whole document (workbook).

ModelingImagesER-WR-PRimage105.png

  • Sheet or Document: These options are useful for small- to medium-sized models where you often change a POV and want a quick refresh.
    • When you set POV Refresh to Sheet, any change to a POV on the page axis will automatically refresh the data in the current tab.
    • When you set POV to refresh to Document, any change to a POV that is referenced by any other tab in the document (workbook) will automatically refresh all the data in those tabs.
  • Off: If you have a large model and want to change more than one POV at a time, you may find it faster to turn this feature off and click Refresh less frequently. When you set POV Refresh to Off, any change to a POV on the page axis will not affect the data in the current tab. You must click Refresh to see the corresponding change.

For example, in the following workbook, each tab shows a different department's operating expense.

ModelingImagesER-WR-PRimage119.png

You can point the POV on each sub-department sheet to one master POV on the main sheet so that any changes to the POV on the main sheet also affect the sub-department sheets.

For example, on a sub-department sheet, select all cells then click Design Manager. For the Company, set the POV to point to the Company tab and COMPANY cell. Click OK.

ModelingImagesimage137.png

ModelingImagesimage138.png

After you have selected the absolute cell reference, you see the change in Design Manager. Click Update to complete the change on this tab. Repeat these steps for the other tabs.

ModelingImagesimage139.png

Now when you change the company on the main tab, the data is automatically refreshed in the other tabs that refer to the same company POV.

ModelingImagesimage142.png

Publish

Dynamic Planning includes the ability to create Excel Reports with Excel Reporting and publish the reports to the Dynamic Planning cloud. Users can then download the report and click to refresh the data. The ability to publish and store reports in the cloud is a collaboration feature to makes it easier to store your most common monthly reports in one place.

A user with Power-user privilege is required to set up reports that will be accessible by users. The Power user creates a template (or placeholder) for a report that will be published and made accessible to users. This template reserves a spot for the report in the Dynamic Planning cloud and defines which user groups have access to it. To publish reports:

Create a Template

Publish the Report

Create a Template

Power-user access is required to do this step. Publishing reports to the Modeling cloud is intended to be used for your organization’s standard monthly reports, such as those in a board book. A general guideline is to use it for fewer than 10 standard reports, although we support up to 50 reports per application, of no more than 16MB each.

In Practice

  1. Select Manage task and the Office Reports, Setup subtask. Here, you can create a template that acts as a placeholder for each report that will be published and made accessible to users. One template can be used for either an Excel Report, Word Report, or PowerPoint Report. Each template reserves a spot for just one report in the Modeling cloud.
  2. Enter the report name.
  3. Enter the report description.
  4. Click Save.
  5. In the Group field, specify user groups that should have access to this report.
  6. For Access, specify whether user groups should be able to publish or download the report.
  7. Click Save.

ModelingImagesER-WR-PRTemplate11.png

Repeat steps 2-7 for each template to be created. For example, create a template for the G&A department to see its operating expenses.

ModelingImagesER-WR-PRTemplate2.png

Publish the Report

After the Power user has created a template for the report, a user with Publish privilege can upload the report.

In Practice: First-Time Publishing

  1. Open the workbook, document, or presentation containing the report with Spotlight formulas, such as the following Operating Expense workbook.
    ModelingImagesER-WR-PRPublishFirstTime.png

  2. Click Publish. The Select Report to Publish box appears and you see the report template that was created by the Power user.
  3. Select the report to publish (in this case, click 2014 Operating Expense) and click Publish.
    ModelingImagesER-WR-PRPublish1.png

    Note:
    Before the report is uploaded, the Modeling data is cleared from the file. When the report is later downloaded, the user will see all metadata and data cells as #REFRESH. When the user clicks refresh, only those members and data cells they have access to will appear.
  4. You will receive a message indicating that the report has been published. Click OK.

In Practice: Saving a Published Report

Make changes to the workbook, document, or deck as needed and click Publish whenever you want to save and upload the latest version. Because you have already told Modeling the name of the report, you do not need to select the report template name again. The report template name is now embedded into the workbook, document, or deck.

To publish the workbook, document, or deck with a different name, the Power user must first create another template. Then the user can click Publish As and select the other template name.

ModelingImagesER-WR-PRPublish2.png

ModelingImagesER-WR-PRPublish3.png

Tip!
For first-time publishing, a Power user or other user with Publish privilege can upload a blank or boilerplate report. For example, if you want all reports to use your company logo in a specific location in the workbook and with other default fonts, the Power user can set up the template and then publish a boilerplate workbook into the Report Template. Other users can then download that report, populate it, and publish the updates.

The Assumptions Worksheet

You can set up a series of Excel Reports in a workbook that refers to an Assumptions tab in your workbook. The Excel Reports can use absolute or relative cell addresses in the Design Manager to specify where to find one or more dimension members. Cell addresses can point to dimension or member names in the row axis, column axis, or point of view (POV).

For example, if you are designing reports for each department entity or company where each group’s data is available in a worksheet, you can create an assumptions worksheet where you can input global drivers like Scenario and Fiscal Year. Point the Excel Cell References to the assumptions worksheet from each department or entity or company worksheet. Then you can update the assumptions worksheet with the required scenario and fiscal year and refresh the data in all worksheets by using the Refresh All option.

Consider the following Assumptions tab in a workbook.

ModelingImagesimage145.png

Each cell in the Assumption tab is a simple text label. Member names must be spelled correctly because the data retrieval will be based on the text in the cell. Additionally, member names should not include the display label; use only the code for the member. Here is a Summary report in the workbook that uses the Assumption tab for the page heading, column headings, and row headings.

ModelingImagesimage146.png

The data cells in the Summary report are pointing to the page, row, and column headings on the worksheet, as follows:

ModelingImagesimage147.png

The following examples show ways of specifying addresses.

Example of Inserting a Relative Cell Address for the Row Axis

For the Department cell reference, select all the SpotlightXL data cells in row 6 then click Design Manager.

Note:
The 2015 Total in column B uses an Excel SUM function. It is not a SpotlightXL data cell.

ModelingImagesimage148.png

Select the Department dimension. Click the Member Select icon, Select Cell Reference, Relative.

ModelingImagesimage149.png

A box appears, asking you to select the relative cell address. Click cell A6.

Note:
The box shows the address in absolute format, but the dollar signs will disappear as soon as you click OK.

ModelingImagesimage150.png

After you click OK, you will see cell address A6 as the new value for the Department dimension. If you make a mistake, you can double-click the New Value column and correct.

ModelingImagesimage151.png

Click Update. Click Refresh to ensure that the data is retrieved correctly. A valid department name must be in cell A6.

Note:
You can provide new values for as many dimensions as you wish and then click Update when done. Use the mouse or arrow keys to navigate through the dimensions in the Design Manager box.

Example of Inserting an Absolute Cell Address for the Column Axis

For the Month cell address, select all the SpotlightXL data cells in column C then click Design Manager.

Select the Time dimension. Click the Member Select icon, Select Cell Reference, Absolute.

ModelingImagesimage152.png

A box appears, asking you to select the absolute cell address. Click cell C5.

ModelingImagesimage153.png

After you click OK, you will see cell address $C$5 as the new value for the Time dimension. If you make a mistake, you can double-click the New Value column and correct.

ModelingImagesimage154.png

Click Update. Then click Refresh to ensure that the data is retrieved correctly. A valid time dimension name must be in cell C5.

Note:
You can provide new values for as many dimensions as you wish and then click Update when done. Use the mouse or arrow keys to navigate through the dimensions in the Design Manager box.

Example of Inserting a Custom Cell Address for the Point of View (POV)

For the Account cell address, select all the SpotlightXL data cells in the table then click Design Manager.

Select the Account dimension. Click the Member Select icon, Select Cell Reference, Custom.

ModelingImagesimage155.png

The New Value area in the Design Manager displays a text box for you to type the cell address.

ModelingImagesimage156.png

This text box gives you the flexibility to specify any cell in any worksheet, so long as you use the correct syntax. You can mix absolute and relative in the address, as you can in Excel. Here are several examples:

ModelingImagesimage157.png

Type Assumptions!$B$2.

ModelingImagesimage158.png

After typing in the new value, you must press Enter (or use the mouse or arrow keys to select a different row in the Design Manager box) before the Update button is enabled. You will see cell address Assumptions!$B$2 as the new value for the Account dimension. If you make a mistake, you can double-click the New Value column and make a correction.

Click Exclude POV. The SpotlightXL Cell Addressing feature is intended to be used for row and column axis members. If you use the Relative, Absolute, or Custom Cell Addresses to specify a POV dimension, you must click Exclude POV. This ensures that SpotlightXL will give precedence to the Excel Cell Address rather than the member that was originally selected for the data.

ModelingImagesimage159.png

Click Update. Then click Refresh to ensure that the data is retrieved correctly. A valid account dimension name must be in cell B2 of the Assumptions worksheet.

Note:
You can provide new values for as many dimensions as you wish and then click Update when done. Use the mouse or arrow keys to navigate through the dimensions in the Design Manager box.

Additional Information When Specifying Member Names for Excel Cell References

  • When specifying an Excel cell address as a SpotlightXL dimension member, that cell can contain a SpotlightMetadata formula or plain text. SpotlightXL prevents you from accidentally erasing a Spotlight formula by disallowing you to delete one cell at a time. However, you can erase Spotlight formulas by selecting 2 or more cells and pressing Del. (Note that the drop-down arrow still appears on any cells that previously contained Spotlight formulas but the drop-down is not functional.)
  • If an invalid member name is used, SpotlightXL displays the data as #INVALID. In the example below, the Sales department is spelled incorrectly.

ModelingImagesimage160.png

Cross-Workbook Excel Cell References

If you have an Assumptions list that is in a separate workbook, you must use the Custom Cell Reference option. The separate workbook must be open, but you cannot click into it to insert the cell reference. You are responsible for typing the correct syntax of the cell address.

ModelingImagesimage161.png

Excel Reporting Income Statement Example

This topic provides an example of creating an Income Statement based on a view using Excel Reporting.

ModelingImagesER-WR-PRimage124.png

In Practice

  1. Select a View that contains the pertinent accounting data for the income statement.
    ModelingImagesER-WR-PRimage125.png

  2. Click Sheet 1 in the workbook, and create the headings and look of the Income Statement that you want. Rename the tab to Income Statement.
    ModelingImagesER-WR-PRimage126.png

  3. Click back to the Analyze tab, and select Design With, Excel Report.
    ModelingImagesER-WR-PRimage127.png

  4. Click Refresh.
  5. Copy the appropriate data cells to the Income Statement tab to fill in the contents of the Income Statement. Note that Gross Profit is not a member in the model so it will need its own Excel formula.
    Here is the result.
    ModelingImagesER-WR-PRimage128.png

    Now, if you want to display your numeric values on a smaller scale, such as in millions, here are the steps:
  6. Insert a heading indicating values in millions.
  7. Use custom Cell Formatting ($#,,;) to display the value of the cells in millions.
    ModelingImagesimage129.png

    Here is the resulting report.
    ModelingImagesER-WR-PRimage130.png

Sharing Excel Reports with People without a Dynamic Planning License Using Snapshots

Companies often need to produce reports electronically for consumption by people who do not have a license or live connection to Dynamic Planning. This capability is provided in Excel Reports with Snapshots. The Snapshot format removes all Spotlight formulas from the report and saves all the data values as regular numbers, and dimension members as regular text, in Excel. There is no option to refresh the snapshot report because it is now static, and it is saved in a separate workbook from your Excel Report.

Creating a Snapshot Report

In Practice

  1. Open the Excel
  2. Ensure that the data is refreshed and correctly reflects what you want to save.
  3. From the More menu, select More, Snapshot.
    ModelingImagesER-WR-PRimage517.png

  4. Give the new snapshot report a file name because it will be saved separately.

ModelingImages501to550image518.png

After saving, the snapshot report will be on your screen so you can fine tune it before sharing it.

ModelingImages501to550image519.png

Dynamic Commentary in Excel Reports

You can collaborate within Dynamic Reports, Spotlight Web (Analyze and Report), SpotlightXL (Analyze and Report), and Excel-based Reports using the Dynamic Commentary functionality.

You can perform the following:

  • Add cell-level comments.
  • Edit, Delete, Highlight, or Resolve comments.
  • Post comments for a combination of dimensions at leaf level, rollup level, and calculated members.
  • Add users, text, #tags, and hyperlinks in the comments.
  • Assign tasks and track their status from the Task Manager.
  • Mark the Task as Complete in the Comment(s) pane.
  • View all comments in the application and perform actions such as Delete and Highlight in Comments Manager.
  • Post comments on cells containing data from Alternative hierarchy.
Note:

This functionality is only supported in Google Chrome.

You can view an indicator whenever a comment is posted in the report. You can include the following in a comment:

  • Add a user - Type @ or + and select the required username to tag the user in a comment. When you type @ or +, username suggestions are provided automatically for the ease of selection. A notification is sent to the tagged user. You can turn off the notifications if required.
  • Add # tags - Type # to find the most used tags in a comment.
  • Add URLs in a comment.
Notes:
  • A maximum of 1024 characters are allowed in a comment. Additionally, up to 30 comments can be posted in a thread for any data intersection and a maximum of 50000 comments are allowed in the application.
  • You can not use dynamic commentary on reports that contain attributes or in cascade reports.

How to Post a Comment

Select the report, click the More list box, and select Show Properties. The location of the report is displayed in the Properties pane.

Note:

This functionality is available for Spotlight only if you are a unified user with access to all product areas (Structured Planning, Consolidation, Reports, and Dynamic Planning). If you want to opt in, contact Planful Support to enable the Unified User functionality.

In Practice

  1. Navigate to the More drop-down menu in the SpotlightXL tab and click the Comments On option. By default, the Comments On option is displayed in all existing and new SpotlightXL Excel Based Reports. A new Comments section with the Comments option is displayed in the SpotlightXL tab.
    SpotlightXLCommentsOffOnEBRSpring201.png

  2. Select the required cell and click Comments. The Comment(s) pane is displayed.
  3. Enter the required text and click Comment. The comment is saved and displayed in the Comment(s) pane.
    SpotlightXLCommentspaneEBRSpring201.png
    You can view an indicator wherever a comment is posted in the report.

How to Edit a Comment

  1. Click the icon on the right-hand side of the comments pop-up window and select Edit from the menu list.
  2. Make the required changes and click Save.

ReportingImagesEditoptionDROLH3.png

You can only edit the comments posted by you. The administrator can update comments posted by any user. You can edit comments from anywhere (Dynamic Reports, Spotlight Web (Analyze and Report), SpotlightXL (Analyze and Report), and Excel-Based Reports) within the application irrespective of where you posted the comment.

How to Highlight a Comment

Click the icon on the right-hand side of the comments pop-up window and select Highlight from the menu list. The Highlight icon is displayed next to the comment.
ReportingImagesHighlightoptionOLH1.png

How to Delete a Comment

  1. Click the icon on the right-hand side of the comments pop-up window and select Delete Thread from the menu list. A confirmation message appears.
  2. Click Confirm to delete the thread.

ReportingImagesDeleteoptionDROLH3.png

You can only delete the comments posted by you. The administrator can delete comments posted by any user. You can delete comments from anywhere (Dynamic Reports, Spotlight Web (Analyze and Report), SpotlightXL (Analyze and Report), and Excel Based Reports) within the application irrespective of where you posted the comment.

Note:

If you delete the first comment in a thread, all the subsequent comments on the thread are automatically deleted. If a scenario or hierarchy member or a custom member is deleted, all the associated comments are deleted from the application automatically.

How to Resolve a Comment

You can resolve a comment thread by clicking Resolve visible in the first comment of the thread. Resolved comments are not displayed in the reports or when the report is exported. Once you resolve a comment, the visual indicator is not displayed on the cells.

Note:

If the first comment on a thread is resolved all the associated comments in the thread are resolved automatically.

ReportingImagesResolvecommentWinter204.png

Note:

The Administrator or any user with access to comments on a data cell can resolve the thread posted by any user.

You can resolve the comments from anywhere (Dynamic Reports, Spotlight Web (Analyze and Report), and SpotlightXL (Analyze and Report), and Excel Based Reports) within the application irrespective of where you posted the comment.

You can view the resolved comments from the Comments Manager page. An icon is displayed next to resolved comments as shown in the image below.
ReportingImagesResolvedCommentsApril204.png

Use the Filter icon to filter resolved comments in the grid. Also, you can delete resolved comments using the More option. The image below shows the filter icon in the upper right-hand corner of the screen.
ReportingImagesFilterResolvedCommentsApril204.png

Once a comment is resolved, you cannot reopen, edit, reply, or highlight that comment. However, a new thread can be started for the same cell.

How to Assign a Task

  1. Right-click in the required cell and select Comment. The pop-up window appears.
  2. Enter + and type the user name.
  3. Select Assign.
  4. Enter the following details:
    1. Add task title
    2. Due On - Select the required date.
    3. Priority- Select any of the following:
      1. Low
      2. Medium
      3. High
  5. Click Comment. A notification is sent to the mentioned user.

ReportingImagesAssignTaskCommentWinter204.png
The assignees and admin will have access to the assigned tasks. You can view the task details from Task Manager.

Notes:
  • You can assign only one task from a comment in a thread. You can assign a task to only one user at a time.
  • If a comment is deleted, the task assigned from the comment is retained, but all the links to the comment are removed. If a task linked to the comment is deleted, the task-related information is also removed from the Comment pop-up window.

Mark Task as Completed in Comments Pop-up Window

You can change the status of any of your assigned tasks to Completed directly from the Comments pop-up window using the Mark as Completed toggle.

Only Assignee, Reporter, or Administrator can mark the status Completed using the Mark as Completed toggle. The Mark as Completed toggle is available in Dynamic Reports, Spotlight Web - Analyze and Reports, SpotlightXL - Analyze, Reports, and Excel-Based Reports. The following image shows the status of a task marked as completed using the toggle.
ReportingImagesMarkasCompletedSpring204.png

When you mark any task Completed from the Comments pop-up window, the same status is automatically updated for the corresponding task on the Task Manager page.

How to Email Notifications

You can configure email notifications for the Dynamic Commentary functionality from the My Setting page. This functionality helps you track actions in the Dynamic Commentary functionality and keeps you up to date by providing email notifications for the selected action based on your requirements. You will receive email notifications with hyperlinks to directly navigate to the respective product area. This helps you access reports and tasks quickly from emails.

The email hyperlink redirects you to the corresponding artifact (for example, a Dynamic Report, a SpotlightXL View, or a SpotlightXL Report) from which the comment was posted and also opens the corresponding Comment pop-up window.

If the email notification is regarding an assigned task, the email hyperlink redirects you to the corresponding task on the Task Manager page.

Note:

The email for a comment posted in a SpotlightXL Excel Report does not contain a hyperlink to the report. It displays the name of the Excel-based Based Report and the sheet within the report in which the comment exists.

In Practice

To configure email notifications for Dynamic Commentary, click your Profile Name, navigate to My Settings > General tab and then select or deselect the required check box under the Enable Email Notification for the Dynamic Commentary section.

The following actions are available for which you can enable email notifications:

  • All Actions - Select this check box to enable email notifications for all actions available in Dynamic Commentary. By default, this check box is selected.
  • Replied to My Comment - Select this check box if you want to receive email notification only when someone replies to your comment.
  • Mentioned on Comment - Select this check box if you want to receive email notification only when someone mentions you in any comment.
  • Assigned Task - Select this check box if you want to receive email notification only when someone assigns you any task.
  • Marked Task As Complete -Select this check box if you want to mark the task as completed.
  • Resolve Comment - Select this check box if you want to resolve the comment.

dyna

You will receive email notifications only for the selected actions. By default, all checkboxes are selected.

How to Edit a Task in Task Manager

The tasks created from a comment are editable by the Task Manager. This applies to the information mentioned in the Comment pop-up window. If you edit any of the task information from Task Manager, the updated information will be reflected in the Comments pop-up window.

If a task is completed, then a tick mark is visible on the Comments pop-up window against the respective task name.

If you change the assignee from Task Manager, the assignee details in the Comment pop-up window are not updated. If a task is deleted from Task Manager, it is removed from the Comment pop-up window, however, the user mentioned in the comment is retained.
ReportingImagesTaskmannagerWinter204.png

How to Extract Comments with the Dynamic Commentary Option

You can extract comments from a range of cells in an Excel Based Report and save them in a new cell. This allows you to view comments from multiple selected cells in one place.

You can use the Dynamic Commentary option under the More drop-down menu in the SpotlightXL tab (as shown in the image below). When you click this option, the Dynamic Commentary pop-up window is displayed where you can select the required cells in the Select Cells field to extract comments.
SpotlightXLDynamicCommCellSpring201.png

The Dynamic Commentary pop-up window provides the following three checkboxes to define additional configuration settings:

  • Display only Highlighted Comments - Display only the highlighted comments in the Dynamic Commentary cell. By default, this check box is not selected.
  • Display Username and Date - Display the username and date for each comment in the Dynamic Commentary cell. The date and time are converted to the user’s timezone. By default, this check box is not selected.
  • Wrap Text - Wrap or enclose the selected cell’s content if the text in the cell overflows the cell boundary.

You can select a range of cells from multiple rows and columns, and extract comments in single or multiple cells. You can add multiple Dynamic Commentary cells in a report. The #tags, hyperlinks, and the tagged username are displayed as plain text in the Dynamic Commentary cell.

Note:

The Dynamic Commentary cell is non-editable.

In Practice

  1. Select the cell where you want to extract comments.
  2. Navigate to the More drop-down menu in the SpotlightXL tab and click the Dynamic Commentary option. The Dynamic Commentary pop-up window is displayed.
    SpotlightXLDynamicCommCellPopupSpring201.png

  3. Select the following checkboxes based on your requirements:
    1. strong>Display only Highlighted Comments
    2. Display Username and Date
    3. Wrap Text
  4. Select the required cells in the Select Cells field. The SpotlightXL pop-up window is displayed.
    SpotlightXLSelectCellsSpring201.png

    Note:
    You can only select up to 78 cells.
  5. Select the required cells and click OK. The Dynamic Commentary pop-up window is displayed.
  6. Click Create, and then click Refresh. The comments are extracted in the selected cell.
    SpotlightXLExtractedCommentsEBRSpring201.png

    If you select a row and extract all comments to the Dynamic Commentary cell, then you can quickly extract all comments in the adjacent rows by dragging down the Dynamic Commentary cell.

Follow these steps to drag the Dynamic Commentary cell:

  1. Select the Dynamic Commentary cell.
  2. Rest your cursor in the lower-right corner so that it turns into a plus sign (+).
  3. Drag the fill handle down the cells that you want to fill as shown in the image below.

SpotlightXLDynamicCommCelldragdropSpring201.png

Note:

A maximum of 500 Dynamic Commentary cells can be added to an Excel Sheet.

Using Substitution Variables and Expressions with Excel Reports

Substitution variables and substitution variable expressions are used in reports in place of dimension member names to make report maintenance easier. Both formatted reports and Excel Reports can use substitution variables and substitution variable expressions. Substitution variables and expressions are defined by a Power or Contributor user with a particular value, however the value can be dynamically modified at runtime by end users.

You can set up the substitution variables and expressions in a formatted report and then Capture it to convert to a Excel Report. Or you can set up the substitution variables and expressions directly in the Excel Report. A Substitution Variable menu item is available on the ribbon to make it possible for users to change the value of the variable while using the report.

Creating Substitution Variables In Excel Reports

The process is the same as for formatted reports.

  1. Power or Contributor users create one or more substitution variables in the model.
    ModelingImagesSubVarscreatecurmth1.png

  2. Power or Contributor users create one or more Excel Reports and insert the substitution variables.
    ModelingImagesSubVarssimpleebr.png

  3. Power or Contributor users specify substitution variable expressions in the design of the report. See Example Substitution Variable Expressions for details about expressions.
  4. Users can change the value of the substitution variable using the Substitution Variables menu item from the Excel Report ribbon.
    ModelingImagesSubVarsEBRRibbon.png

  5. With the cursor anywhere in the report, click Substitution Variables. The Substitution Variables box appears. It shows the name of the variable and the current value.
  6. Click the Member Select icon.
    ModelingImagesSubVarssimple71.png

  7. From the member selection box, select the month that you want to see in the report.
    ModelingImagesSubVarssimple81.png

  8. Click Select.
  9. Click Refresh to refresh the report.
    The report now displays data for July 17. Using this method, the user can easily move back and forth between months, quarters, or years, without updating the definition of the report and without the need for the Contributor or Power users to update the substitution variable value permanently.
    ModelingImagesSubVarssimple91.png

Example Substitution Variable Expressions

This topic is intended for administrators and designers and provides an example of expressions, syntax, and expression chains.

Consider the following dimension hierarchy for a fiscal year that begins in July each year. Assume that the model contains only these three years.

Time Dimension

FY2017

FY2018

FY2019

Q1 2017

Q1 2018

Q1 2019

  • Jul 2016

  • Jul 2017

  • Jul 2018

  • Aug 2016

  • Aug 2017

  • Aug 2018

  • Sep 2016

  • Sep 2017

  • Sep 2018

Q2 2017

Q2 2018

Q2 2019

  • Oct 2016

  • Oct 2017

  • Oct 2018

  • Nov 2016

  • Nov 2017

  • Nov 2018

  • Dec 2016

  • Dec 2017

  • Dec 2018

Q3 2017

Q3 2018

Q3 2019

  • Jan 2017

  • Jan 2018

  • Jan 2019

  • Feb 2017

  • Feb 2018

  • Feb 2019

  • Mar 2017

  • Mar 2018

  • Mar 2019

Q4 2017

Q4 2018

Q4 2019

  • Apr 2017

  • Apr 2018

  • Apr 2019

  • May 2017

  • May 2018

  • May 2019

  • Jun 2017

  • Jun 2018

  • Jun 2019

Expression Syntax

The following expressions are available for use with substitution variables. Assume that @CurYear@ is FY2018 and @CurMth@ is Jul 2017.

Expression

Offset # Required?

Description

Example Syntax

Resulting Value

FirstChild

No

Returns the first child in the hierarchy.

@CurYear@.FirstChild

Q1 2018. CurYear is FY2018 and its First Child is Q1 2018.

LastChild

No

Returns the last child in the hierarchy.

@CurYear@.LastChild

Q4 2018. CurYear is FY2018 and its Last Child is Q4 2018.

FirstSibling

No

Returns the first sibling in the hierarchy, at the same level

@CurYear@.FirstSibling

FY2017. CurYear is FY2018 and its First Sibling is FY2017.

LastSibling

No

Returns the last sibling in the hierarchy, at the same level

@CurYear@.LastSibling

FY2019. CurYear is FY2018 and its Last Sibling is FY2019.

Lead

Yes

Returns the next member in the hierarchy, at the same level; skips over parent or child members

@CurYear@.Lead(1)

FY2019. CurYear is FY2018 and the next member at the same level is FY2019.


@CurYear@.Lead(2)

Member Not Found (There is no FY2020 in the model.) CurYear is FY2018 and skipping ahead 2 years would result in the member that follows FY2019 except there is no such year in the model.


@CurMth@.Lead(4)


Nov 2017. CurMth is Jul 2017 and skipping ahead 4 months is Nov 2017.

Lag

Yes

Returns the previous member in the hierarchy, at the same level; skips over parent or child members

@CurYear@.Lag(1)

FY2017. CurYear is FY2018 and going back one year is FY2017.


@CurYear@.Lag(2)

Member Not Found (There is no FY2016 in the model.) CurYear is FY2018 and going back two years would result in the member that precedes FY2017 except there is no such year in the model.


@CurMth@.Lag(4)


Mar 2017. CurMth is Jul 2017 and 4 months before July is Mar 2017.

Parent

No

Returns the parent member in the hierarchy.

@CurYear@.Parent

Time. CurYear is FY2018 and its Parent is the Time dimension.


@CurMth@.Parent.Parent


FY2018. CurMth is Jul 2017 and its Parent is Q1 2018, and Q1's Parent is FY2018.

Expression Chains

You can chain expressions together. Each entry in the expression builds on the results of the previous entry, reading from left to right.

@CurMth@.Parent.FirstChild = Jul 2017. CurMth’s Parent is Q1 2018 and the First Child of Q1 2018 is Jul 2017.

@CurMth@.Lag(3).Parent = Q4 2017. CurMth’s 3-month Lag is Apr 2017 and the Parent of Apr 2017 is Q4 2017

@CurMth@.Parent.Lead(2) = Q3 2018. CurMth’s Parent is Q1 2018 and 2 quarters ahead is Q3 2018.

Note:
We recommend to chain only two expressions together.

When adding functions to a substitution variable, you may find the need to change the order or to remove one of the expressions. Click the menu button next to the expression to make the changes.

ModelingImagesSubVarsexpress11.png

If you want to cancel out from adding expressions, click inside the Design Manager or press Esc.

Best Practices

  • Each workbook can contain up to 30 worksheets and 7000 data cells per worksheet. If you are creating large volumes of cell references per worksheet, then consider using Excel 64-bit.
  • When you click Refresh or Refresh All, avoid doing anything else in the workbook or other workbooks until the Refresh operation is complete. In large workbooks, Refreshing is a lengthy operation, and you can view the status of the operation in the Progress Information box and use the More Detail or Less Detail button. But if you do anything else in Excel or in other applications on your computer before the Refresh is complete, SpotlightXL detects it as an interruption and may display some cells as #REFRESH when done.
    ModelingImagesimage114.png
  • If you click Analyze or Report while in a sheet containing your Excel Report with Spotlight formulas, Dynamic Planning asks if you want to clear the Spotlight formulas. It is best to click the Analyze tab or open a new tab before selecting Analyze from the menu. Similarly, if you want to run a formatted report, click the Report tab or open a new tab before selecting Report from the menu.
  • When working with Published reports, one person in your organization should be made responsible for making changes to the report structure. Other users can then open/download the reports and refresh the data.
  • Publishing reports to the Dynamic Planning cloud is intended to be used for your organization’s standard monthly reports, such as those in a board book. A general guideline is to use it for fewer than 10 standard reports, although SpotlightXL supports up to 50 reports per application, of no more than 16MB each.
  • In Excel Report, it's recommended not to combine Excel Report formulas with other Excel formulas. This approach worked fine in the past. However, there has been a change in behavior with the latest update of Microsoft Excel's autocomplete feature. Now, when data is entered or calculated, if the result doesn't match an item in the list, it will display the first value from the list, which is typically a GUID. Since our dropdowns typically start with GUIDs, as a result, users may see GUID.
Note:
In addition, it is also recommended that customers install the semi-annual release version of the Office 365 application. The SpotlightXL add-in is certified to work seamlessly with the semi-annual release version.

You can also find installation instructions for the Office 365 application in the following resources:

If you need further assistance, please reach out to your IT team.

In Practice: To Check the Release Version of the Office 365 Application

  1. Open Excel and navigate to the File.

  2. Click Account.

  3. The Product Information, including the release version, will be displayed.

Was this article helpful?