Planful AI Analyst
- 17 Minutes to read
- Print
- DarkLight
- PDF
Planful AI Analyst
- 17 Minutes to read
- Print
- DarkLight
- PDF
Article summary
Did you find this summary helpful?
Thank you for your feedback
Overview
Planful AI Analyst leverages generative AI to streamline financial reporting and analysis. It processes queries, identifies missing information, resolves ambiguities by requesting clarification, supports follow-up questions, drills down and analyzes by dimensions, and presents results in structured tables, charts, and narratives.
Planful AI Analyst enables you to:
Get simplified financial data analysis with natural language processing, making data retrieval and analysis effortless.
Obtain clear financial data overviews complete with tables, narratives, and charts, for easy interpretation.
Compare actual financial performance against budgets or forecasts and analyze trends over the past months/quarters.
Quickly drill down into financial reports without the hassle of manually generating new reports.
Instantly locate and view Reports and Dashboards using natural language queries.
Enforces data access controls, ensuring users can only view authorized information.
Provides clear messages for scenarios such as data unavailability, access restrictions, and other limitations.
Important: Planful AI Analyst Activation
You must contact your Planful Account Manager to enable this feature.
What’s In Scope?
The current scope of Planful AI – Analyst includes:
Finance domain: Focused on delivering actionable data and insights from the financial reporting area
Main and Alternate hierarchies: Supports the metadata of the finance main and alternate hierarchies
12 Periods: Covers standard 12-period financial reporting cycles, enabling monthly, quarterly, yearly, and year-to-date analysis
Note: The following features are not currently supported in Planful:
Finance attributes and attribute hierarchies
Configurations with more than 12 fiscal periods
The Workforce Reporting Area
Consolidation data-related queries
Key Features
Natural Language Data Queries
Ask intuitive financial questions using real-world terms. Planful AI supports multiple types of queries across categories:
Data Retrieval
How much was the product 02 2025 Budget for digital marketing spend?
What is the total Travel spend for Q1 2025?
Trend & Period Comparisons
Compare last quarter's revenue with revenue from 2024 for same period
Show revenue for the last 6 months.
Which product's revenues increased by more than 15% compared to last quarter?
Variance Analysis
What is the budget vs actual variance for Marketing?
What is the expense variance from the 5+7 2025 forecast vs the 2025 budget
Which departments spent more than 10% above the budget?
Data Drill Down
Break down salaries by department.
Show T&E in North America by entity.
Top-N / Largest Items
Which is the company with the largest variance to plan in Sales for Q1 2025?
what were the biggest SG&A variances for the marketing department for June actuals vs. the FY25 plan.
Threshold-Based Filters
Which expenses are more than 500K?
Which departments spent more than 10% above the budget?
Which product's revenues increased by more than 15% compared to last quarter?
Note:
Supported Query Categories: Get Data and Scenario Variance.
Sum Calculation
What is the total revenue for the top five customers?
What are the total benefits and salaries costs for Q2?
Average Calculation
What is the average monthly revenue for the past year?
What is the average expense per department for the last quarter?
Autocomplete Search
When you begin typing a dimension member (e.g., entering “Ope”), Planful AI will automatically suggest matching members like “Operating Expenses” in real-time and you can select the required dimension member. This enhancement helps reduce ambiguity, while improving speed and accuracy when interacting with Planful AI.
Dimension Member Selector
You can now refine ambiguous questions interactively by selecting the exact dimension members (for example, departments, accounts, or products) using the new Dimension Member Selector.
How to Use Dimension Member Selector
Type your question or the keyword (following @, e.g., entering “Ope”) related to the dimension member you want to find.
Click here to open the Dimension Member selector.
In the Dimension Member Selector, search for the Required Dimension Member.
From the search results, select the appropriate dimension member.
Click Submit.
Interactive Exploration
Users can dynamically interact with the AI responses and further analyze retrieved data using:
Table/Chart View - View data in table or chart format
Drill Down/Analyze Data by Dimensions - Ask follow-up questions to break down reports by relevant dimensions (e.g., region, department, or product line)
Data Summary - Get AI-generated summaries for a quick narrative overview
Exporting Capabilities - Download reports to share in Excel and PNG formats
Copy Summary - Copy and share data summary for seamless collaboration
Dimension Details - View dimensional information for the data
Expand Window - Display large datasets in a full-screen table or chart view
Sorting Capabilities - Organize the data within the data table in ascending or descending order
Chart Type Customization - Specify the type of data visualization (Bar, Column, Line, Pie, and Dual Axis now supported.)
Breadcrumbs Navigation – Track and navigate your query path (e.g., Revenue → Region → Department) to easily return to previous levels of your analysis.
Note:
You can now customize the number of decimal digits (up to 2) displayed in Planful AI responses. Contact Planful Support to configure it for your application.
Follow-up Questions and Context Retention
Users can refine or expand their analysis with follow-up questions. Planful AI maintains conversation context for smooth and continuous interactions.
For example:
Initial query: Show revenue for Q1.
Follow-up: Break it down by region.
Further analysis: Compare it with last year.
Favorite Questions in Planful AI
The Favorite Questions feature in Planful AI enables users to save and reuse frequently asked questions.
Click the Favorite (star) icon next to a question to add to your favorites.
Notes:
Each user can store up to 20 favorite questions, so you can easily access them later. If you would like to save more, just remove one of your existing favorites to make room for a new one.
Users can remove favorites by clicking the delete icon in the Favorite menu or clicking the filled Favorite (star) icon to unmark it directly from the conversation.
Collaboration via Email
You can share insights with others directly from the Planful AI interface, only after a table or chart has been generated.
How to Share Planful AI-Generated Tables/Charts via Email
Open the AI Drawer.
Click the Export icon in the upper-right corner of the chart or table.
.png)
Add email details, in the Share Email dialog:
Recipient(s): Type a user’s name or email. Select from the list of Planful users.
Subject: Defaults to the chart/table title. You can edit it as needed.
Click Send Email.
.png)
Additional Notes
The @CURYR@ substitution variable is used by Planful AI as the default time context when no specific period is mentioned or referenced in the question. Ensure that it is set to the current year 2025.
Troubleshooting Checks Post Enablement/Activation
Follow these steps to verify proper setup and address any issues after Planful AI Analyst has been enabled. If the responses seem incorrect, or if you would like to begin a new chat, use the Start New Chat option to refresh the conversation and start a new chat.
Test Planful AI Functionality
Open the Planful AI dialog by clicking the Planful AI button on the top toolbar. Ensure you select the appropriate Mode (Reports, Templates, or Task) before entering your question.
Ask a data-related question such as:
How much did we spend on travel in the last quarter?
(Replace "travel" with a relevant keyword or partial account name, e.g., “Sales”)
Error Responses in Planful AI
If you encounter an error response for multiple question like above:
Click the dimension details icon (above the data table in the Planful AI response) to review the dimensions involved.
Validate Data Visibility Using Dynamic Report
Create a dynamic report using the same dimensions shown in the Dimension Details.
If the report returns data successfully but Planful AI continues to show errors, submit a support ticket to the Planful Support team for further assistance.
What’s Coming?
In the upcoming releases, users can expect the following features in Planful AI’s capabilities:
Business Activities Support
Planful AI will assist analysts in executing key financial and operational tasks through automation and intelligence. Supported activities include:
Financial Planning & Budgeting – Streamline planning cycles with intelligent forecasting and automated budgeting tools
Scenario Modeling & Forecasting – Simulate “what-if” scenarios to guide strategic financial decisions
Decision Support & Advisory – Provide data-backed recommendations for informed decision-making
Cost Control & Optimization – Uncover opportunities to reduce costs and enhance operational efficiency
Advanced Report Analysis:
Right-Click Analysis: Interact with dynamic reports using contextual right-click to analyze data by different dimensions
Cell Compatibility: Supported on all cells except those with advanced formulas. (e.g., custom members, non-variance functions) Excel rows with A - B formula are supported.
Drill-Down Capabilities: Navigate deeper into data from AI-generated tables and charts
Data Exploration & Calculation
Data Calculation: Perform basic calculations such as ratios, percentages, sums, and averages to support rapid financial and KPI analysis
Advanced Data Queries: Enable threshold-based querying to filter and surface data that meets specific conditions
Reporting & Sharing Enhancements
Save as Report / Email: Save datasets as dynamic reports and easily share them with stakeholders via email
Additional Export Formats: Export insights in new formats, such as PDF summaries, and support using “Copy to Clipboard” for quick sharing
User Experience & Collaboration
Favorite Questions: Bookmark frequently asked questions for quick access and reuse
UI Improvements: Enjoy streamlined member selection and intuitive data drill-downs using breadcrumb navigation
User Commentary: Collaborate by adding contextual comments directly to analyses and preserving insights with each artifact
Data Analysis & Narrative Compilation
Narrative Compilation: Automatically combine AI-generated and user-written narratives to explain data-driven insights and business context
Automated Variance & Trend Analysis: Identify and explain key drivers behind variances and trends with intelligent narratives
Anomaly Detection: Detect unusual patterns or outliers in data with contextual, data-driven explanations
Planning & Optimization
Automated Forecasting & Scenario Planning: Generate forecasts and create guided “what-if” scenarios for strategic planning, including sensitivity analysis (e.g., reduced hiring, increased churn).
Scenario Optimization: Receive AI-powered recommendations to help meet financial or operational goals (e.g., target margins, revenue growth).
Extended Support for Other Application Areas
Planful AI will expand its capabilities to additional application areas within the Planful platform, such as:
New Domain Support:
Workforce datasets
Consolidation datasets
Support for Other Types of Hierarchies:
Attribute hierarchies
Support for 12+ Fiscal Period Configurations
How To Use Planful AI - Analyze Mode?
You can access Planful AI's Analyze Mode by following the steps below:
Navigate to the top toolbar and click Planful AI.

The Planful AI dialog box displays.
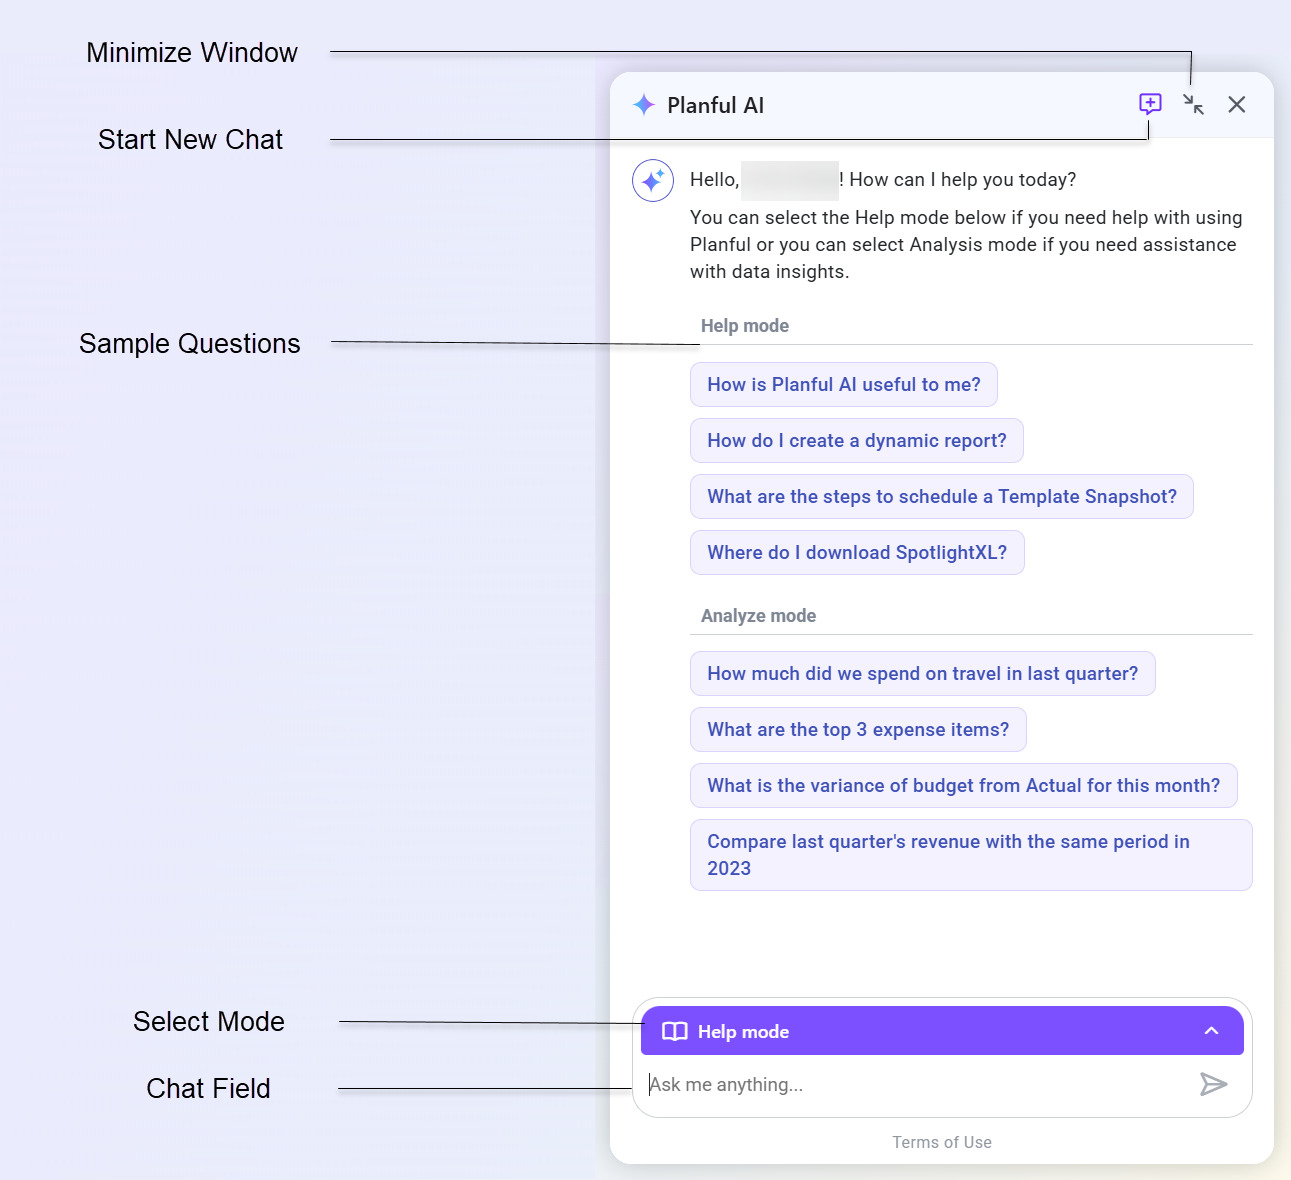
Click the expand icon beside the Help mode field, and select Analyze.
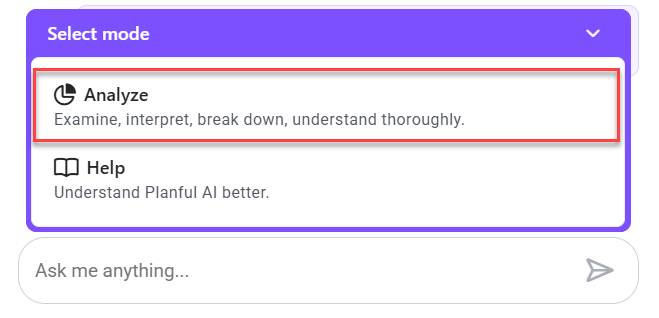
Type your question in the chat field, click the Arrow icon, or press Enter.
Planful AI retrieves information in a default tabular format and provides an AI-generated data summary.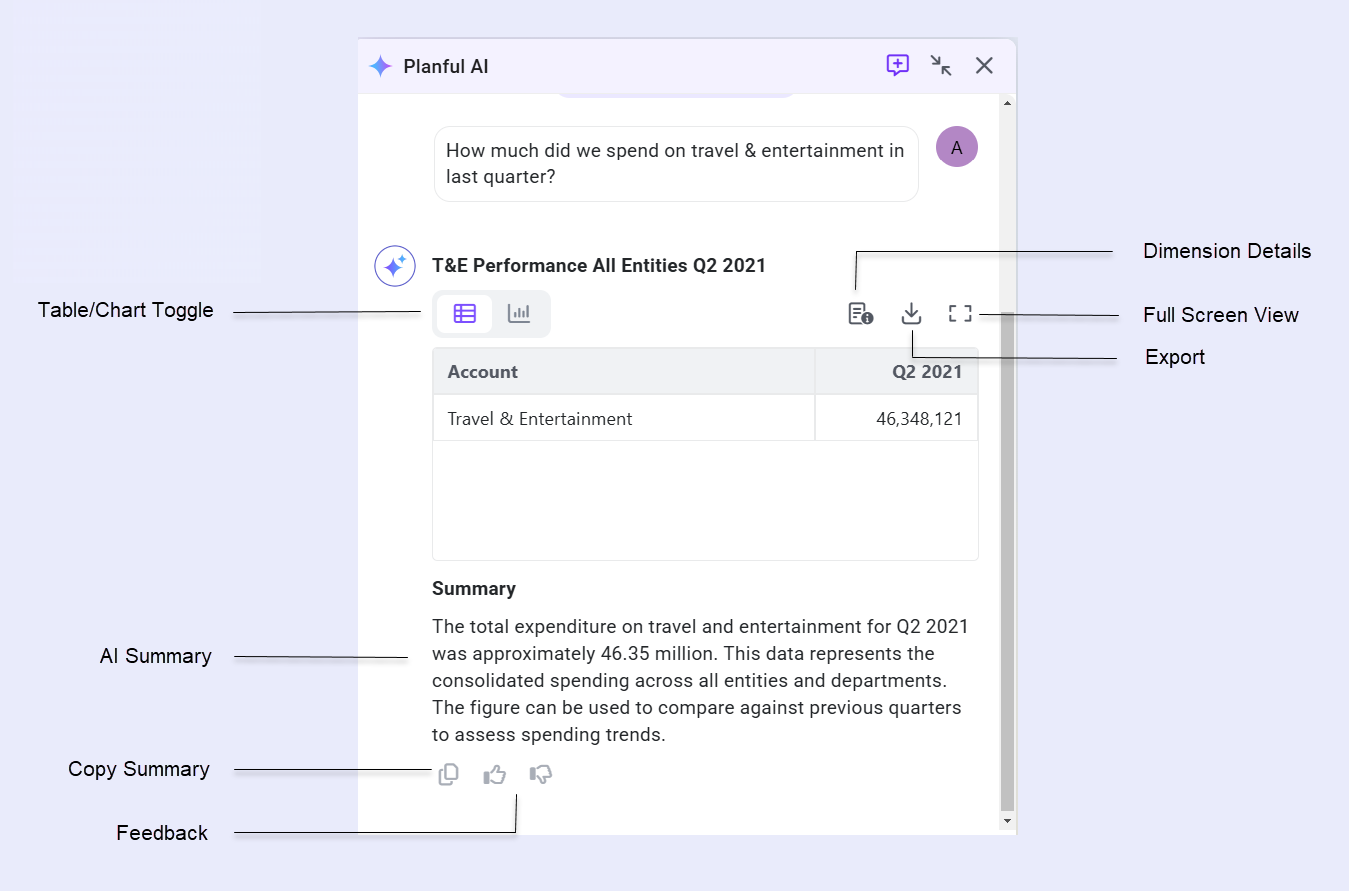
To expand the table in full view, click the Full Screen icon.
The table opens on the left panel.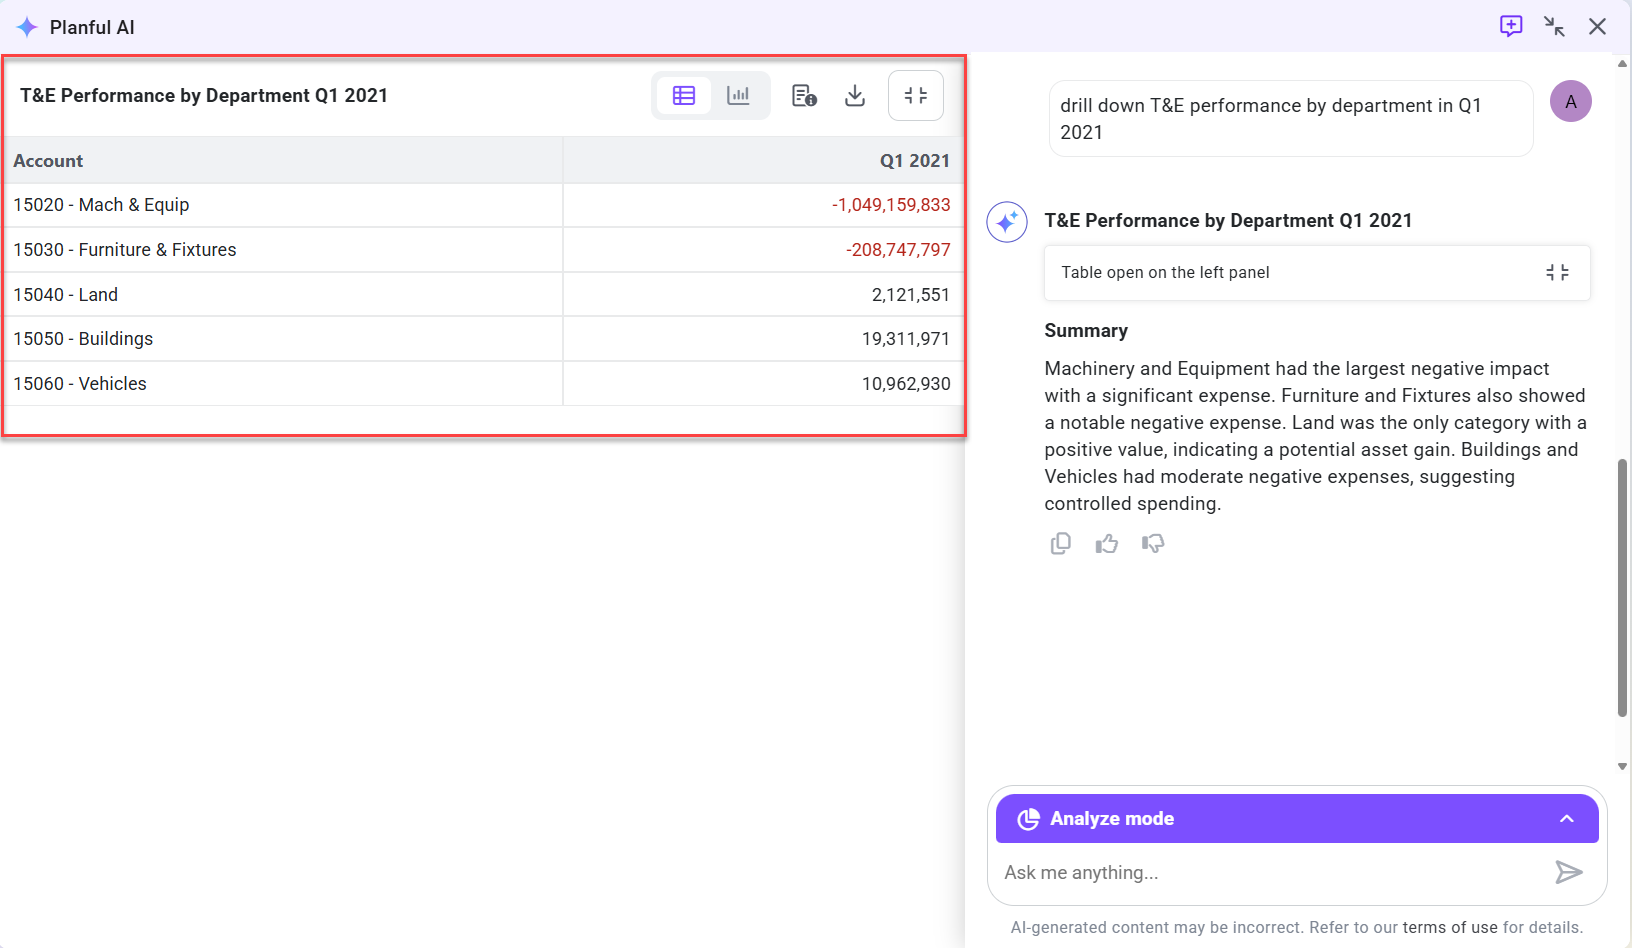
If the response is incorrect or irrelevant, click the Thumbs Up or Thumbs Down icon to share feedback.
The Feedback screen displays the applicable options and a feedback text field.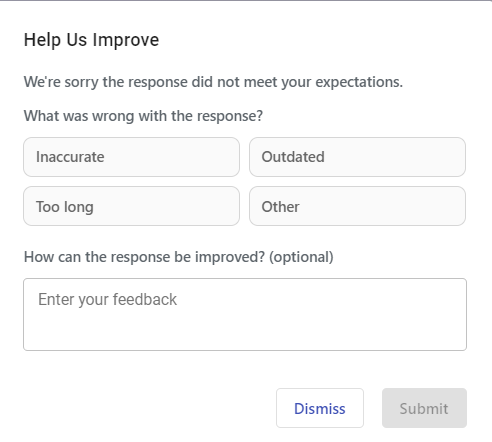
If you receive any irrelevant responses, click the Start new chat icon to start a new conversation.
Click New Chat.
Best Practices for Asking Data Questions
1. Be Specific with Your Request
Clearly define the metric, time period, entity, and scenario (e.g., actuals vs. forecast).
Good Question: Show me the forecast vs. actuals for OPEX by department in North America for Q4 2024.
Why it Works: Includes the metric (OPEX), comparison (forecast vs. actuals), time period, dimension (department), and region.
2. Use Application Terms and Context
Use language and structures that the system recognizes, such as cost centers, scenarios, account names, or entity hierarchies.
Good Question: What was the variance in CAPEX between the ‘Current Forecast’ and 'Current Budget' for the IT cost center in FY2024?
Why it Works: Clearly defines the metric, scenarios, cost center, and time period.
3. Include Filters and Dimensions
Add specific filters, such as region, business unit, or product, to narrow the results.
Good Question: Give me revenue actuals YTD for the EMEA region, broken down by product.
Why it Works: Includes time frame, region filter, metric, and a dimension breakdown.
4. Ask Trend or Comparison Questions Thoughtfully
Define both the timeframe and baseline when asking about changes or trends.
Good Question: What is the 12-month cash flow trend for the Consumer Division compared to the previous year?
Why it Works: Clear period, comparison baseline, and business unit.
5. Phrase Complex Requests Step-by-Step
Break complex inquiries into smaller, manageable steps. Start broad, then drill down.
Good Questions:
First: “Sales actuals vs. forecast for Q1 2025”
Follow-up: “Break it down by product.”
Why it Works: Keeps each step clear and interpretable.
6. Use Filters or Limits for Large Data Sets
Limit or filter large data pulls to keep the output focused.
Good Question: List the top 5 cost centers by spend in Q1 2025.
Why it Works: Keeps the result concise and actionable.
7. Request Visuals When Helpful
If visuals are supported, specify the format you'd like.
Good Question: Show a bar chart of gross sales for the last 5 years.
Why it Works: Clearly asks for a specific visual of a defined metric over time.
Guideline Question Templates
Metric Queries
What is the [metric] in [time period]?
e.g., What is the actual gross sales in Q1 2024?
What are the [time period] [metric]?
e.g., What are April sales?
Show [metric] for [time period].
e.g., Show the GM for 2024.
What is the [metric] for [entity] in [time period]?
e.g., What is the actual gross sales for EMEA in Q1 2024?
What is the [metric] for [time period] in [entity]?
e.g., What is the salary expense for 2025 in Marketing?
Show the [metric] for [entity] in [time period].
e.g., Show the GM for North America in 2024.
Show the [time period] [metric] for [entity].
e.g., Show the 2025 Salaries for Marketing.
What is the [measure] [metric] in [entity]?
e.g., What is the year-to-date operating expense in R&D?
What is the [metric] [measure]?
e.g., What is the marketing expense year to date?
What is the [measure] [metric] for [time period]?
e.g., What is the YTD sales for 2025?
What is the [time period] [measure] [metric] in [entity]?
e.g., What is the 2025 year-to-date travel expense in Marketing?
What is the [time period] [entity] [metric]?
e.g., What is the 2025 R&D wages?
Trend Analysis
What are the [metric] by month/quarter?
e.g., What are the sales by month?
What is the monthly/quarterly [metric] for [year]?
e.g., What is the monthly utilities expense for 2025?
Budget & Forecast
What is the forecasted/planned [metric] for [entity] in [time period]?
e.g., What is the forecasted operating expenses for Sales & Marketing in 2025?
How much did we budget/forecast for [metric] in [time period]?
e.g., How much did we budget for Travel & Entertainment in 2025?|
What is the [time] [budget/forecast] for [metric]?
e.g., What is the 2025 budget for payroll expense?
Drill Down & Breakdowns
What is the [measure] [metric] by [dimension]?
e.g., What is the Year-to-date travel expense by department?
Show the [metric] in [time period] broken down by [dimension1] and [dimension2].
e.g., Show the the Salaries expense in December 2024 broken down by leaf level account and leaf level company.
Drill down into [account] for [entity] in [time period] by [dimension].
e.g., Drill down into Travel & Entertainment for North America in 2024 by department.
Show [metric] for [entity] by [dimension] in [time period].
e.g., Show gross sales for North America by product in 2024.Break down [metric] by [dimension] for [time period].
e.g., Break down gross sales by account for 2024.
Scenario Variance
What is the [metric] [measure] vs [scenario]?
e.g., What is the payroll expense YTD vs budget?What is the variance of [scenario1] from [scenario2] for [time period]?
e.g., What is the variance of budget from actual for Q4 2021?
What is the variance to [scenario] in [metric] for [time period]?
e.g., What is the variance to budget in EBITDA for Oct 2021?
What was our [metric] variance vs [scenario] for [time period]?
e.g., What is the salaries variance vs plan for Q1 2025?
Pull the variance for [entity] between [scenario1] and [scenario2].
e.g., What is the variance for Finance between actual and budget?
What is the [metric] difference between [scenario1] and [scenario2]?
e.g., What is the EBITDA difference between Budget 2025 and the latest forecast?
Which [entities] are overspent or underspent?
e.g., Which departments are overspent or underspent?
Which accounts in [entity] are under or over budget?
e.g., Which accounts in R&D are under or over budget?
Which [entities] are causing the largest variance in [metric] for [time period]?
e.g., Which departments are causing the largest variance in Salaries for 2021?
Which [entity] has the largest variance to [scenario] in [metric] for [time period]?
e.g., Which is the company with the largest variance to plan in Sales for Q1 2025?
Which [entities] have the most significant variances to [scenario]?
e.g., Which are the departments with the most significant variances to budget?
What accounts are driving the variance in [entity]?
e.g., What accounts are driving variance in department 100?
What accounts contributed most to the variance in [metric]?
e.g., What are the top contributors to variance in Operating Expenses?
Time-Based Variance
Year-over-Year (YoY)
Compare this [month/quarter]’s [metric] with the same period last year.
What was our [metric] this [month/quarter] vs last year?
How did [metric] in [period] this year compare to the same period last year?
What is the YoY variance in [metric] for [entity] in [month/quarter]?
What is the year-over-year change in [metric] for [month]?
Compare [time period] [measure] [metric] with [prior time period].
What is the variance in [metric] for [entity] year-on-year?
What was the year-over-year [metric] change?
What is the [metric] growth over the past [n] years?
What is the monthly YoY variance in [metric] for [entity] from [start month] to [end month]?
What is the quarterly YoY variance in [metric] for [entity] for [quarter(s)]/[year]?
What are the top [n] variances compared to last year?
Which [entities] had the highest YoY increase in [metric] for [month/quarter]?
What contributed most to the YoY change in [metric] for [month/quarter]?
Quarter-over-Quarter (QoQ)
Compare this quarter’s [metric] with last quarter.
What was our [metric] this quarter vs last quarter?
What is the QoQ variance in [metric] for [entity]?
What was the quarter-over-quarter [metric] change?
What are the top [n] variances between [quarter1] and [quarter2]?
Month-over-Month (MoM)
Compare this month’s [metric] with last month.
What was our [metric] this month vs last month?
What is the MoM variance in [metric] for [entity]?
What was the month-over-month [metric] change?
What are the top [n] variances between [month1] and [month2]?
What to Avoid When Asking Data Questions
1. Vague Language
Avoid:
How are the numbers?
Is this good or bad?
Compare things for the last quarter.
Why it’s a Problem: Lacks context — AI needs specific metrics, timeframes, and entities.
Fix: What is the variance between Actual and Forecast for Operating Income in Q1 2025 for US Corp?
2. Overly Broad Requests
Avoid: Show me all data for Finance.
Why it’s a Problem: May overload the system or return unhelpful results.
Fix: Show the top 5 expense accounts for the Finance department in March 2025.
3. Ambiguous Metrics
Avoid: Give me the performance numbers.
Why it’s a Problem: "Performance" is too broad.
Fix: What was the EBITDA and Net Margin for APAC in Q2 2025?
4. Relying on Context Without Continuity
Avoid: Drill down on that. (if not following a specific result)
Why it’s a Problem: Lacks reference to previous query.
Fix: Drill into Professional Services expense in Q2 2025 for North America by vendor.
5. Using Subjective Terms Without Criteria
Avoid: Which departments are doing badly?
Why it’s a Problem: Terms like “bad” need a defined threshold.
Fix: Which departments are over budget by more than 10% in March 2025?
6. Combining Too Many Metrics
Avoid: Compare revenue, expenses, profit, and headcount for all departments.
Why it’s a Problem: Output may be too complex or truncated.
Fix: Ask about one or two KPIs per question, then follow up for more details.
FAQs
How does Planful AI handle missing or ambiguous information?
It automatically detects missing details or unclear queries and prompts the user to clarify, ensuring accurate results.
Can I ask follow-up questions without restating the full query?
Yes. Planful AI remembers the context. So you can follow up with queries like “Break it down by region”, or “Compare it to last year”. This makes it easy to build on your analysis.
Can I export the data and visuals?
Yes. You can download tables as Excel files and charts as PNGs or PDFs images for easy sharing.
Can I give feedback on the responses?
Yes, Planful AI includes a built-in feedback option, so you can easily share whether the analysis met your expectations or not. This helps improve future performance.
Is my data secure in Planful AI?
Absolutely. It enforces strict data access controls and complies with security and governance standards. Users only see data they’re authorized to view.
What if the data I’m asking for isn’t available?
Planful AI will notify you if data is missing, restricted, or unavailable, so there’s no confusion.
Will Planful AI consider customer configurations?
Yes, Planful AI is designed to understand and adapt to customer-specific configurations. It can interpret application-specific terminology, including dimensional structures, and effectively handle queries across different levels of granularity, such as rollups, leaf nodes, and more.
Is access to Planful AI based on navigation role?
No, access to Planful AI is not dependent on navigation roles. If Planful AI is enabled for your organization, all users within the application will have access to it, regardless of their navigation permissions.
Our company has enabled Planful AI. How can I find out which users have the AI menu option? Is it available for all users on our tenant or just power users?
All users on your tenant will have access to the AI menu option if Planful AI is enabled, not just power users.
Our company has enabled Planful AI. How can I find out which users have the AI menu option? Is it available for all users on our tenant or just power users?
All users on your tenant will have access to the AI menu option if Planful AI is enabled, not just power users.
How to Activate Planful AI Analyst?
You must contact your Planful Account Manager to enable this feature.
Can Planful AI build and run a report?
No, Planful AI cannot build or run reports directly. However, it assists in data retrieval and analysis for financial reporting areas and finding relevant reports using natural language queries.
What is the best way to train Planful AI on how we commonly refer to our hierarchies?
This functionality is on the roadmap, currently users have to specify the dimension member as part of the question or select from the clarification options or hierarchy.
How can I configure Planful AI Analyze Mode to use current year data instead of 2022?
The @CURYR@ substitution variable is referenced by Planful AI Analyst if not mentioned in the question. Ensure that it is set to the current year 2025.
How do I get you out help mode?
To switch to Analyze mode,
Click the Help mode to expand the mode selector
Select Analyze in the Planful AI dialog box.
If you want to exit Planful AI,
Click the X (Close) icon in the top-right corner of the AI dialog box.
Note: You can always reopen Planful AI from the top toolbar when needed.
Was this article helpful?