2.0.2 Modeling Release Notes, April
- 10 Minutes to read
- Print
- DarkLight
- PDF
2.0.2 Modeling Release Notes, April
- 10 Minutes to read
- Print
- DarkLight
- PDF
Article summary
Did you find this summary helpful?
Thank you for your feedback
Excel-based Reporting
With Excel-based Reporting you can leverage the full set of formatting options that are natively available in Excel. You now have the best of both; the power of Modeling and added flexibility of Excel.
Use Excel-based Reporting when your model contains pertinent data that you want to use with a wide variety of Excel features to format a custom report, such as an Income Statement or Balance Sheet. With Excel-based Reporting, you can design and customize the worksheet as a report and place data and members from the model into the report freely. Data is updated from the cloud upon Refresh.
With Excel-based Reporting, users can:
Reference the data from Modeling into Excel
Design and run reports from Excel
Use a wide variety of Excel features for formatting the reports
Leverage Excel formulas, formatting, graphs, and other features
Publish the Excel workbook to Modeling
Publish (or upload) the workbook for collaboration
Open (or download) the workbook
- Refresh data
Only data cells from Modeling are refreshed
Excel formulas and formatting options are retained as is during the refresh process
Sample Report
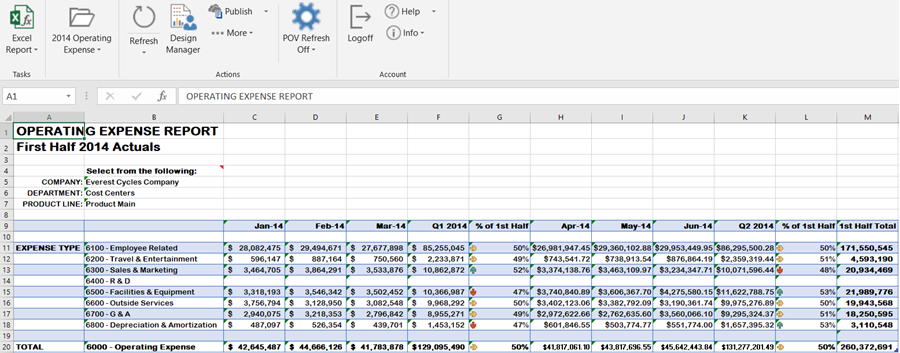
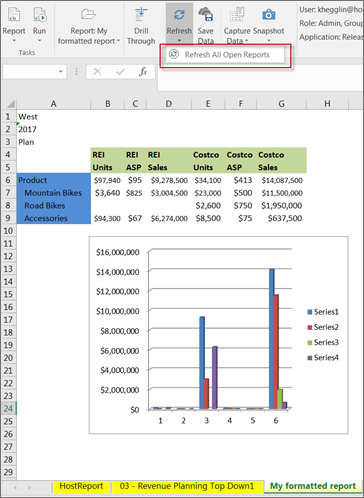
Reports created with Excel-based Reporting are called "Custom Reports". The following example contains data and members from a model along with Excel formatting.
- Table formatting is used
- Conditional formatting is used
- Font is changed to Arial Rounded Bold
- Cell comments were added
- Number formatting varies per quarter
- Columns were inserted containing formulas and sub-totals
- Totals were moved to the bottom and right
Required, Recommended, and Optional Topics with Tasks to Get Started
Each of the links to topics below are provided in sequential order so that you can quickly get started with Excel-based Reporting. Topics contain tasks that are required, optional or recommended.
Setting Up Excel-based Reporting (required)
Overview of Excel-based Reporting (required)
Setting up Security (required)
Publishing and Opening Excel-based Reports (required)
Creating Excel-based Reports (required)
Setting Up an Assumptions Worksheet (optional)
Excel-based Reporting Best Practices (recommended)
Description Field Updates
We’ve added additional Description fields to all model artifact pages as well as Reports' and Views' properties. In addition to these enhancements, we’ve enhanced the Model Setup page to display descriptions for all related artifacts.
Description for Model Artifact Pages
Description Update to Design View and Report Design
Description for Model Artifact Pages
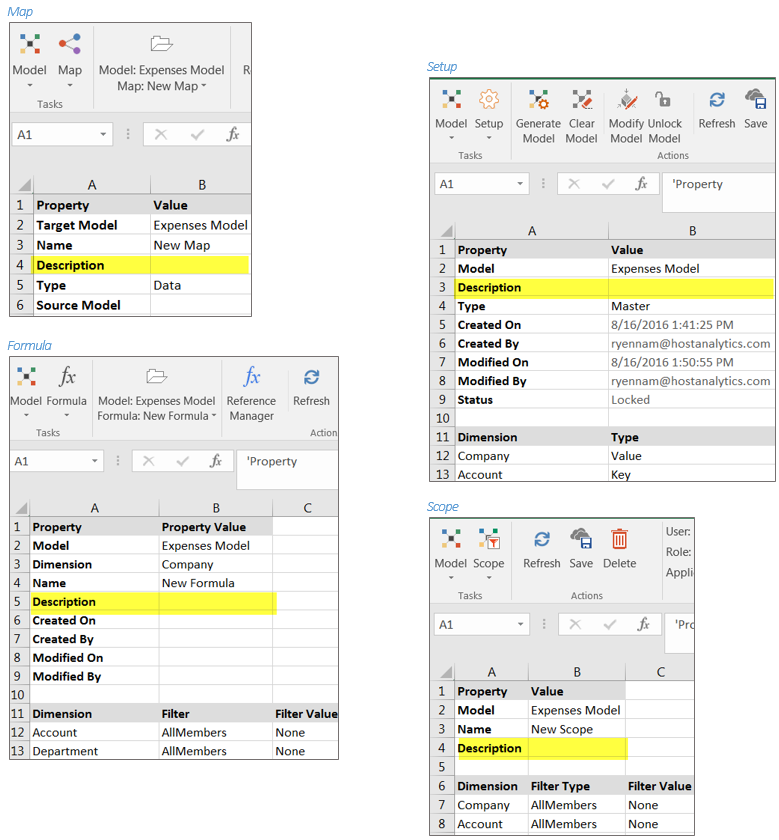
We’ve added a “Description” field to each model artifact page for improved identification purposes. Now, you can provide relevant information for each artifact in the Description field. Like the “Description” field that already exists on the Model Calculation page (accessed by selecting the Model task and the Calculation subtask), the only difference is character limitation. The Description field on the Model Calculation page allows up to 5000 characters while all other artifact Description fields allow up to 1000 characters. If you exceed the 1000-character limit, characters will be truncated.
Model artifacts (aside from Calculation) include: Scope, Formula, Map, and Setup. Each of these pages are shown below with the Description field highlighted.
Description for Design View and Report Design
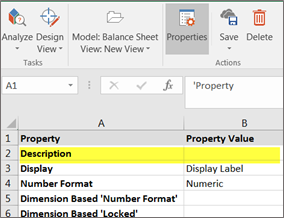
A Description field has been added to the Design View (accessed by selecting the Analyze task and the Design View subtask). To display and update the Description field (shown below), click the Properties action.
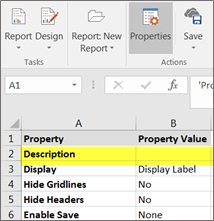
Similarly, the Description field has been added to the Report Design page as well (accessed by selecting the Report task and the Design subtask). Click the Properties action. The Description field is shown below.
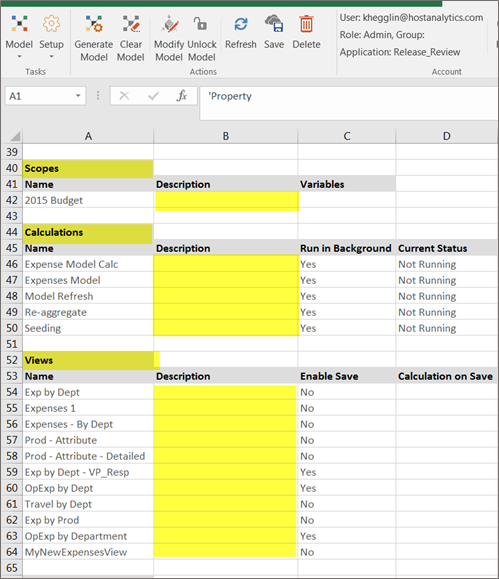
Model Setup Description
The Model Setup page has been enhanced so that descriptions related to the artifact associated with the model are displayed. In the example below, if the 2015 Budget scope had a description, it would be displayed in the highlighted field. If the Seeding calculation, or any other calculation or view below, had a description then it too would display in the associated Description field highlight below.
Note:
In the coming releases, we will enhance the Model Setup screen to not only display the description for all the artifacts but also will allow you to update the description for all the artifacts.
Model Setup Audit Details
In past releases, the Model Setup page (accessed by selecting the Model task and the Setup subtask) had audit log details associated with each related View and Report. We’ve removed the audit log details from the Setup page as all audit information is centrally located and available in the Audit Log. You can access the Audit Log by selecting the Manage task and the Application Administration – Audit Log subtask.
For more information on the Audit Log page, click here.
Ability to Rename Views and Reports from Folder Structure
With this release, you can rename views and reports directly from the folder structure. This feature is available in SpotlightXL as well as the web front end.
Renaming Views
To rename a view:
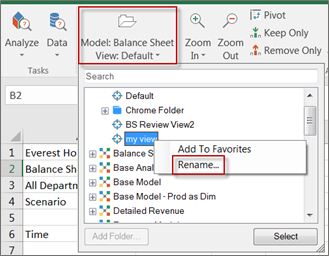
Select the Analyze task and the Data subtask.
Click on the folder structure, select the view and right-click.
Select Rename…
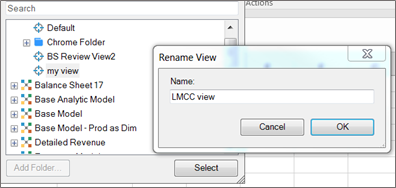
The Rename View dialog appears. Enter the new name of the view.
Click OK.
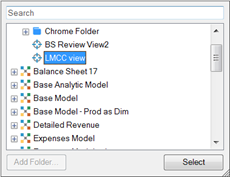
The folder structure automatically refreshes displaying the new view name as shown below.
Renaming Reports
To rename reports:
Select the Report task and the Run subtask.
Click on the folder structure, select the report and right-click.
Select Rename…
The Rename Report dialog appears. Enter the new name of the report.
Click OK.
Best Practice When Renaming Reports and Views
If you have a report book with multiple reports or views and one of those reports or views is renamed, an error will result when you perform a Refresh All as shown below.
For details on which report failed to refresh, click the More Details portion of the Refresh All log shown below.
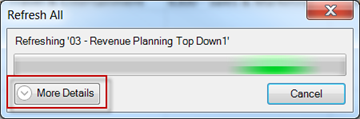
The resolution is to reload the renamed view or report from the folder structure. As a best practice, use caution when renaming reports and views. Report and view owners may rename a report or view as can an Admin user or any user given access to edit the report or view.
Note:
In coming releases, we will be adding the option to ‘Delete’ views and reports from the folder structure.
SpotlightXL Add-In Installation Format using InstallShield MSI
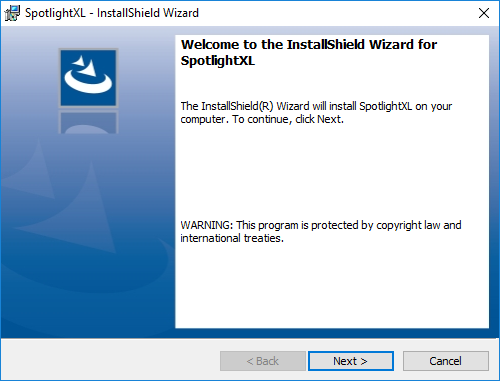
The SpotlightXL Add-In installation is now available in a user-friendly form, using InstallShield. The installer will now be distributed in an MSI format. MSI is an installer package file format. Using InstallShield MSI will resolve installation issues and allow Admin users to install the SpotlightXL Add-In for their user base.
Users must still use Control Panel to uninstall the previous release before running the InstallShield MSI file.
After running the installer EXE file, click Next and follow the prompts to install SpotlightXL. When installation is complete, click Finish.
Note:
We have plans to automate the SpotlightXL Add-In, eliminating the need to uninstall the old add-in, download the new, and install the new.
Reliability Improvements
We have implemented several enhancements to address reliability issues making the Modeling application even more robust and efficient. For example, we’ve changed the way models are processed so that model resources are more effectively utilized. Each calculation will be assigned with dedicated resource on the fly and the resources will be released after the processing is complete.
Data Load Enhancement to Master / Analytic Model API
The Master and Analytic Model Data Load API has been enhanced so that data will persist to load even when dimension members are missing.
It is an optional configuration and by default the data load API will not load the data if there are any missing dimension members. If this option is configured then data load API will continue to load the valid data and will notify users with the list of missing dimension members for which data has not been loaded.
The flag we introduced in the Data Load API will continue to load data even when an Invalid member or Invalid number is:
<continue-on-error>true</continue-on-error>
The sample payload is provided below:
<?xml version="1.0" encoding="UTF-8"?>

<load-data-payload>

<model-name>Base</model-name>

<delimiter>|_|</delimiter>

<aggregate-flag>true</aggregate-flag>

<continue-on-error>true</continue-on-error>

<page-dimensions>

<entry>

<key>Measures</key>

<value>MTD</value>

</entry>

<entry>

<key>Scenario</key>

<value>Actual</value>

</entry>

</page-dimensions>

<column-dimensions>

<entry>

<key>1</key>

<value>Products</value>

</entry>

<entry>

<key>2</key>

<value>Time</value>

</entry>

<entry>

<key>3</key>

<value>Time</value>

</entry>

<entry>

<key>4</key>

<value>Time</value>

</entry>

<entry>

<key>5</key>

<value>Time</value>

</entry>

<entry>

<key>6</key>

<value>Time</value>

</entry>

<entry>

<key>7</key>

<value>Time</value>

</entry>

<entry>

<key>8</key>

<value>Time</value>

</entry>

<entry>

<key>9</key>

<value>Time</value>

</entry>

<entry>

<key>10</key>

<value>Time</value>

</entry>

<entry>

<key>11</key>

<value>Time</value>

</entry>

<entry>

<key>12</key>

<value>Time</value>

</entry>

<entry>

<key>13</key>

<value>Time</value>

</entry>

</column-dimensions>

<column-members>

<entry>

<key>2</key>

<value>Jan</value>

</entry>

<entry>

<key>3</key>

<value>Feb</value>

</entry>

<entry>

<key>4</key>

<value>Mar</value>

</entry>

<entry>

<key>5</key>

<value>Apr</value>

</entry>

<entry>

<key>6</key>

<value>May</value>

</entry>

<entry>

<key>7</key>

<value>Jun</value>

</entry>

<entry>

<key>8</key>

<value>Jul</value>

</entry>

<entry>

<key>9</key>

<value>Aug</value>

</entry>

<entry>

<key>10</key>

<value>Sep</value>

</entry>

<entry>

<key>11</key>

<value>Oct</value>

</entry>

<entry>

<key>12</key>

<value>Nov</value>

</entry>

<entry>

<key>13</key>

<value>Dec</value>

</entry>

</column-members>

<notify-on-success>

<email>mhamed@hostanalytics.com</email>

<email>ryennam@hostanalytics.com</email>

</notify-on-success>

<notify-on-failure>

<email>mhamed@hostanalytics.com</email>

</notify-on-failure>

<data-records>

<data-record>HP1|_|10|_|10|_|10|_|10|_|10|_|10|_|10|_|10|_|10|_|10|_|10|_|10</data-record>

<data-record>Dell1|_|20|_|20|_|20|_|20|_|20|_|20|_|20|_|20|_|20|_|20|_|20|_|20</data-record>

<data-record>Nexus 6|_|30a|_|30|_|30|_|30|_|30|_|30|_|30|_|30|_|30|_|30|_|30|_|30</data-record>

<data-record>iPhone 7|_|40|_|40|_|40|_|40|_|40|_|40|_|40|_|40|_|40|_|40|_|40|_|40</data-record>

</data-records>

</load-data-payload>
Note:
A recipient of the data load will receive an email titled "Data Load Success with exceptions" along with the exceptions detailing what went wrong.
Known Issues
2492 | If a report which is saved in an excel work book(offline) is renamed then users need to reload that report into the Excel workbook. Best practice is to refresh all reports in the saved workbook before renaming any report. |
2489 | When design excel-based report navigation access for designer users is disabled then ‘Capture Data’ option on the ribbon is not visible |
2421 | Excel "Compatibility Mode" is Unsupported |
2354 | Snapshot email link will not work for users with SSO integration if they are not logged into the application. As a workaround they should log into the application and then access the Snapshot email link. |
2309 | If users update the schedule for an existing Calculation then in some cases its being scheduled an hour later. If users need to update the schedule we recommend to clear the schedule pattern field and then save the calculation and then update the schedule. |
2276 | If user makes any changes to the report (ex:- formatting, adding rows or columns, deleting rows or columns) after running it and then take a Snapshot then user will not see all the changes made to the report and in some cases the snapshot will look weird. We recommend users to take Snapshots without making any changes to changes to the report after its executed |
2246 | Current report/view selection is not updated to the new name when renaming it from Properties page. |
2242 | Cell selection shows improper highlighted cells upon Preview Filter Member with freeze panes |
2203 | Shared POV status is lost upon changing value of POV in Design Manager / Report |
2113 | Integration between Planning & Modeling applications from web interface is best supported in Google Chrome browser. Users cannot navigate from Planning to Modeling if Internet Explorer compatibility mode is turned on. |
2080 | If users are using Firefox browser, right clicking an item in the Folder structure may display an incorrect menu. |
2017 | If users are using Firefox browser dimension hierarchy dropdown will only show up to 30 levels. |
1882 | Once the model that a variable refers to does not exist, the user is not able to delete or fix the invalid variable in the associated report. |
1845 | If POV member defined is removed or renames, it cannot be fixed in report design mode and error is displayed. |
1492 | Using special characters for the model name results in errors. |
1464 | When suppress rows/columns is enabled, If Dimension Members and Data Intersection are available in same column/row in a report then dimension members will be suppressed along with data intersections. |
1457 | In some cases Suppress blank rows/columns is not working as expected when Groups are expanded in the report. |
1455 | Suppress blank rows/columns is not supported in Spotlight (i.e. Web Interface). |
1454 | In Some cases Suppress blank rows / columns is not working as expected if groups and freeze panes are enabled in the Report. |
1446 | Unable to navigate to Design View after rename or remove HostAnalyze worksheet. |
1406 | Excel 2016 Chart Problems. |
1387 | Designer cannot generate external data source model. |
1322 | Unable to cascade with substitution variables. |
1321 | Substitution variables are not working as expected in Cascade Report. |
1273 | Cascade Report has inconsistencies with Filters. |
1144 | Freeze Panes location should not be outside of the sheet viewable range. |
687 | Modified Report definition by removing months column still retain after Refresh. |
405 | In Report Design, specify a dimension to be cascaded. Copy and paste the cascaded member/block in the same column. Select Save and Run and the following is displayed 'Cannot find variable '@Cascade' in model...'. Select Refresh and the following is displayed 'Object reference not set to an instance of an object'. |
The following Known Issues are specific to Excel-Based Reporting:
2518 | Reviewer user has no access to Publish Excel-based reports. |
2302 | If there are any Snapshots in the workbook then Convert Entire Workbook option will not convert the workbook. |
2203 | Shared POV status is lost upon changing value of POV in Design Manager / Formatted Report and EBR. |
2199 | Filter member options are not available if only 1 cell from a model exists, in formatted report and EBR. |
2097 | When using Design Manager, Update button is enabled only after entering a valid New Value and hitting enter. |
1887 | It takes over 1 - 3 min to open 22 MB Excel workbook. |
1755 | Locking / Scaling is not applied when converting a Formatted Report to Excel-based Report. |
1699 | It may takes up to couple of hours to Capture Entire Workbook with 30 worksheets and ~7000 data cells or more cells |
1698 | Message shows 'Please contact administrator...' when select Refresh after session timeout. |
1683 | Specifying a relative cell address to a cell in another tab in EBR creates an absolute cell address |
1672 | Provide an option to reset the Excel workbook so users can upload using a different Report Template. |
1624 | Unable to download the same report as it's being used by another process. |
1550 | Errors when Capture Data as SpotlightXL Formulas with a cascade report. |
Resolved Issues
2321 | Model Restore As with spaces in Model and Dimension generating invalid internal dimension id. |
2311 | Ignore Excel events in disconnected state. |
The following Resolved Issue is specific to Excel-Based Reporting:
2455 | Allow to double click to paste value in the New Value column. |
Was this article helpful?