Adjust Projections
- 1 Minute to read
- Print
- DarkLight
- PDF
Adjust Projections
- 1 Minute to read
- Print
- DarkLight
- PDF
Article summary
Did you find this summary helpful?
Thank you for your feedback
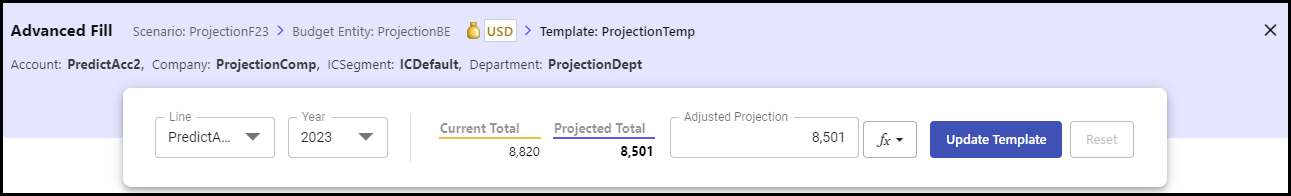
You can use the Advance Fill feature to understand how the projections are generated.
You can also adjust the projections annual total according to your budget by still leveraging the AI engine.
So, irrespective of the previously generated AI projections, if you have a specific budget in mind, you can choose the Adjusted Projection option from the Advanced Fill pop-up window and redistribute the figures for the open periods in a data-driven fashion that will still adhere to the trend and seasonality present in the data.
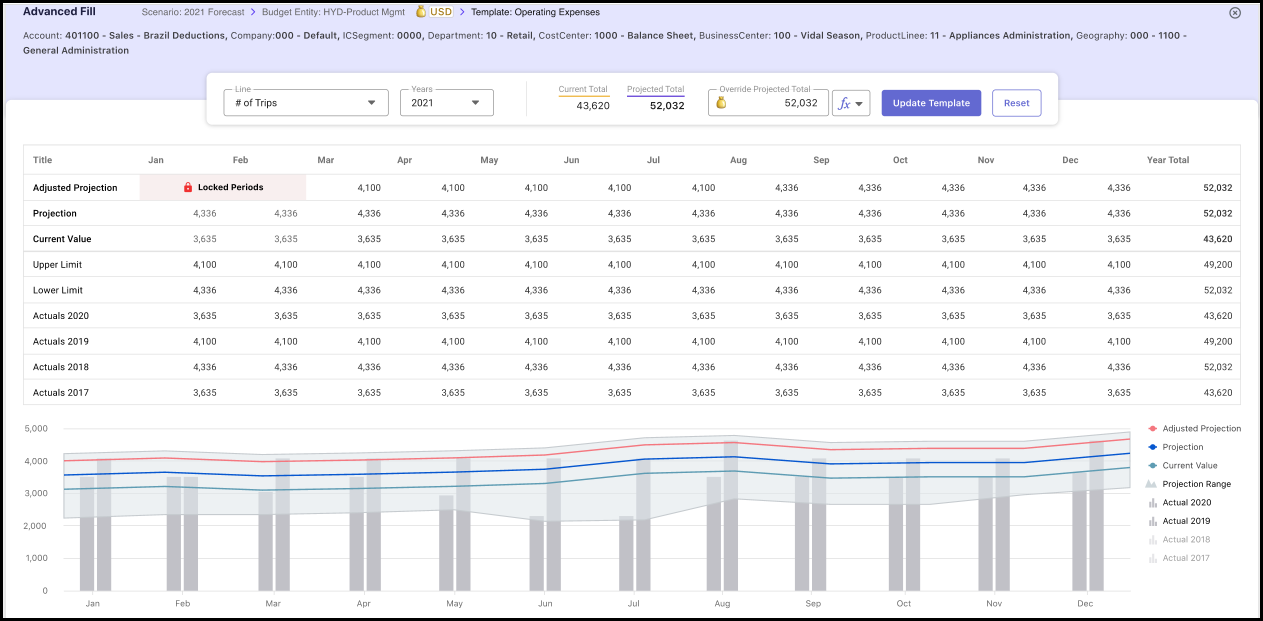
Following are the various features available in the Advance Fill pop-up window.
- Template Dimensions: The dimensions of the selected Template are displayed.
- Input Row: You can use this row to change the selected row/line, change the year for which the Projections are being displayed, and view the Current Total budget and the Projected Total budget.
You can also use this row for providing the Adjusted Projection.
Adjusted Projection
You can adjust the current projection by a certain percentage or by a certain value. Once you have provided your input in this field you must click Apply.
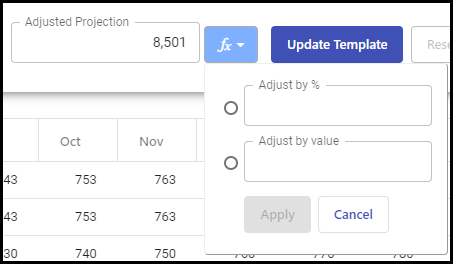
Finally, you have the Update Template and Reset buttons in the input row.
You must always click the Update Template button to save your changes to the Projections in the Advance Fill tab and fill them in the template. Else, all changes made in the Advance Fill pop-up window will be lost.
The Reset button can be used to reset the adjusted projection to the previous values as per the template.
- Data Table and a Graph: The graph displays the same information visually intuitively, displaying the Projections. The graph has the upper and lower ranges and the forecast scenario by default. Still, it lets you see the historical actuals on it by clicking on the actual data label displayed below the graph. The pop-up window displays data for all the months in the entire fiscal year to demonstrate the trend and seasonality present in the data; this helps better understand the Projections.
Was this article helpful?