April 18 Release Notes
- 11 Minutes to read
- Print
- DarkLight
- PDF
April 18 Release Notes
- 11 Minutes to read
- Print
- DarkLight
- PDF
Article summary
Did you find this summary helpful?
Thank you for your feedback
MyPlan
Ability to Use Different Compare Scenarios Against Multiple Years
Auto Configuration of Template Columns
Ability to Use Different Compare Scenarios Against Multiple Years
For Budget and Forecast scenarios, you now have the ability to use different compare scenarios against multiple years. This functionality allows you to plan out years and future years using "what if" scenarios, or, set up a rolling forecast and compare each prior year results with current year results.
For example, let's say you've created a Q2 forecast scenario for years 2018 through 2020 (Q2 Forecast 2018-20). The data from this forecast needs to be compared with data from the Q1 forecast scenario (Q1 Forecast 2018-20). So, each year (2018, 2019, and 2020) for Q2 needs to be compared with the corresponding Q1 forecast scenario for the same years. To accomplish this, setup 3 Compare scenarios mapped to the source scenario and period as shown in the table below.
| Scenario | Compare Scenario |
|---|---|
Q1 Forecast 2018 | Q2 Forecast 2018 |
Q1 Forecast 2019 | Q2 Forecast 2019 |
Q1 Forecast 2020 | Q2 Forecast 2020 |
Note:
Compare scenarios can be mapped to any scenarios and periods or to the same scenario and period or any such combination based on how you want data to display comparative data.
The last thing you will do is map the Compare scenarios to each of the fiscal years of the forecast scenario.
In Practice:
Step 1: Access the Scenario Setup page by navigating to Maintenance > Admin > Scenario Setup.
Step 2: Click the Add icon to add a new scenario.
Step 3: Click the Compare Scenarios tab and ensure Enable Compare Scenarios is selected.
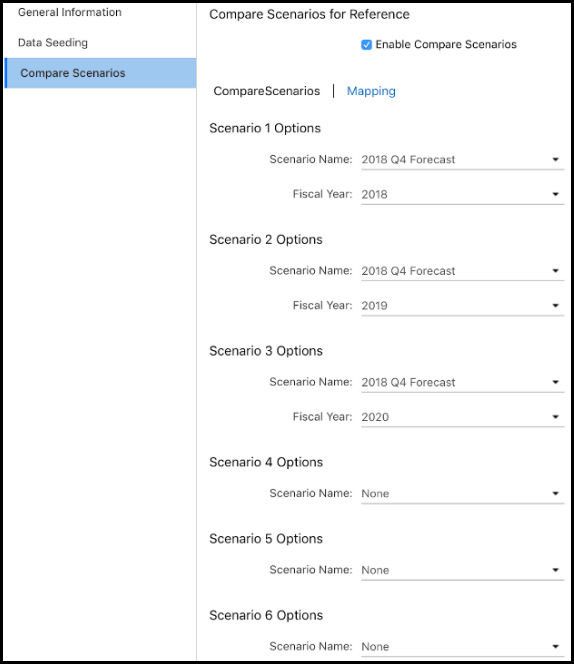
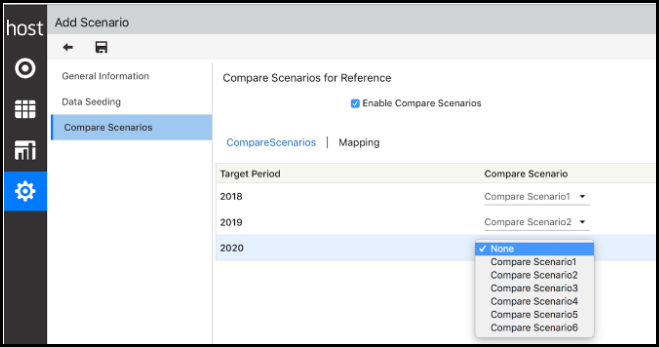
Step 4: Click the Mapping link.
Step 5: For each fiscal year in your budget plan or forecast (in this example there are 6 years), map a Compare scenario by selecting it from the list box. Click Save.
Auto Configuration of Template Columns
With this release, MyPlan template Year Total and Variance columns are automatically generated without the need to set them up manually in Template Setup.
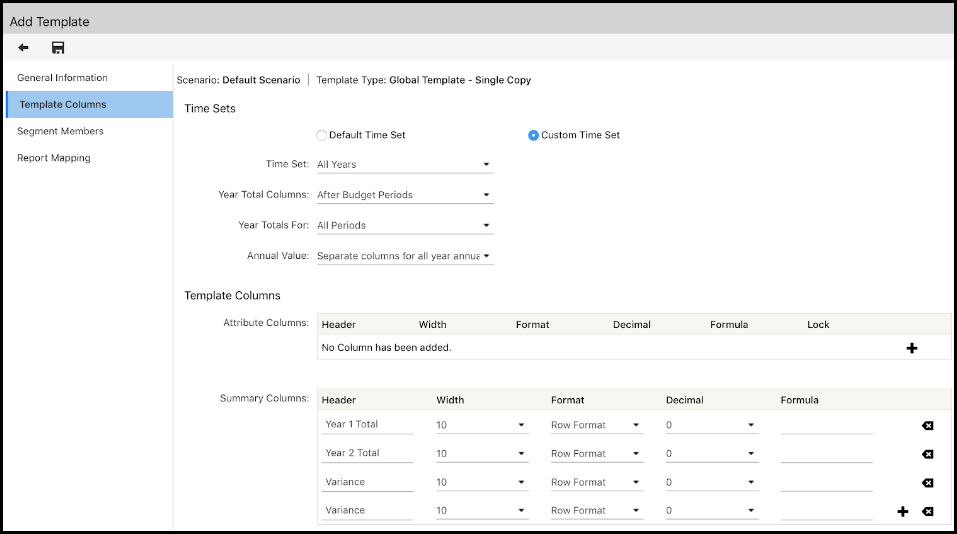
Now, you can create a MyPlan template with or without summary columns. A simple template in MyPlan displays Year Total, Compare Scenario Total and Variance automatically and does not need to be defined in Template setup. The image below displays the Template Setup - Template Columns page.
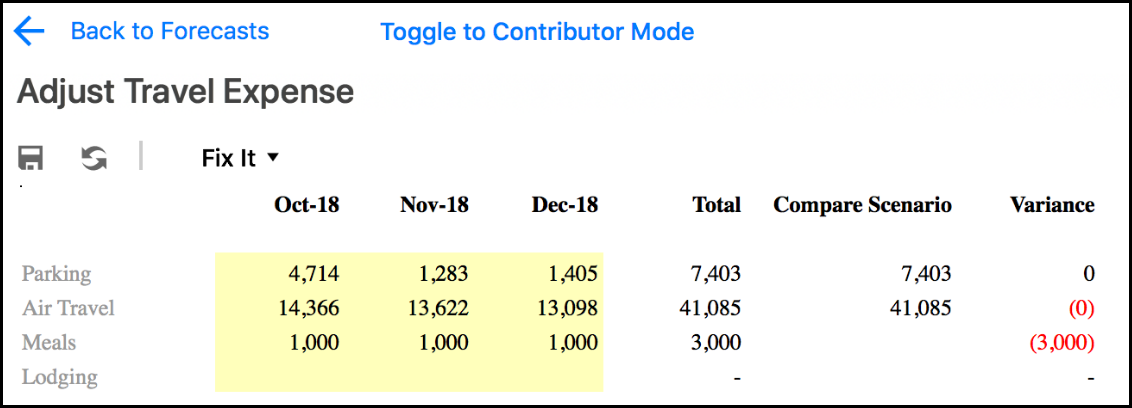
The following image displays the same template in MyPlan with Total, Compare Scenario and Variance columns. The automatically generated columns appear in the MyPlan template only. These columns do not automatically appear in the templates in Contributor mode.
Automatically generated columns appear in MyPlan Template even though Summary columns are configured in the Template. Administrators do not have to disable Summary columns.
MyPlan Account Configuration
Data available in a user's MyPlan is displayed based on account segments and mapped segments; such as expenses mapped to assets. This feature provides a comprehensive look at accounts used in the generation of MyPlan data. Admin users can access the MyPlan Account Configuration page. This page not only provides the ability for "checks and balances", but is also helpful when accounts or mapped data is modified (such as the mapping of a salary component or segment).
Note:
MyPlan Account Configuration can be used for HR and CAPEX components only. Management of accounts in templates is already available from Template Setup (Maintenance > Templates > Template Setup).
In Practice:
This example shows you how to access the MyPlan Account Configuration - MyPlan Account Mapping page and describes the setup pages used to modify existing accounts and mappings.
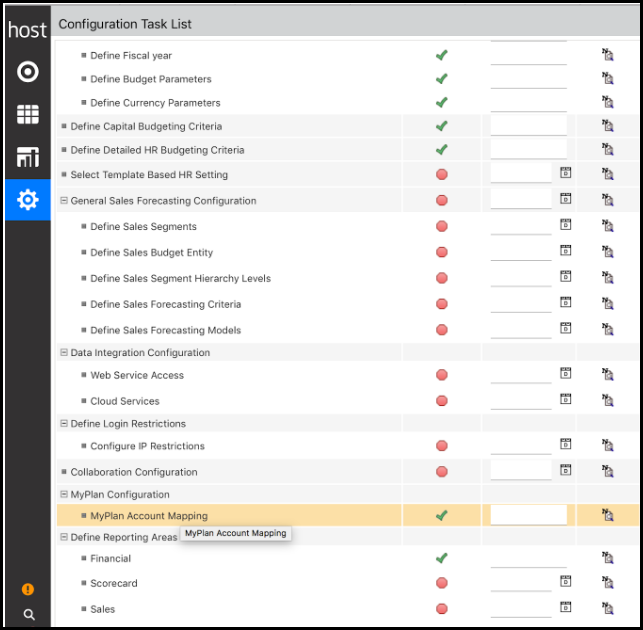
Step 1: Navigate to Maintenance > Admin > Configuration Tasks > MyPlan Account Configuration.
Step 2: Click MyPlan Account Mapping to display the accounts configured for HR or CAPEX.
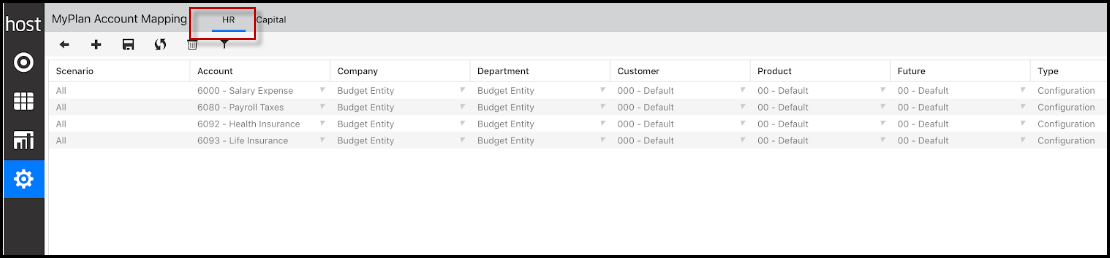
Step 3: Click the HR tab to modify Human Resource accounts and mappings. All accounts and associated mappings are displayed for HR. Add accounts by selecting the Add icon. You will be required to select associated segments (Scenario, Account, Company, and so on). Optionally, edit or delete accounts.
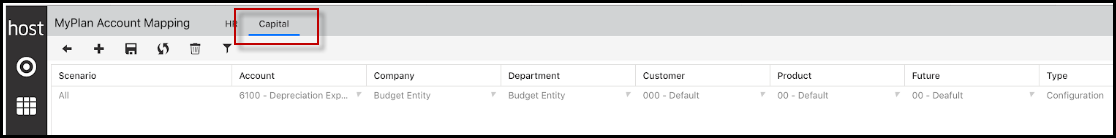
Step 4: Click the Capital tab to modify CAPEX accounts and mappings. All accounts and associated mappings are displayed for CAPEX. Add accounts by selecting the Add icon. You will be required to select associated segments (Scenario, Account, Company, and so on). Optionally, edit or delete accounts.
Reporting: Workiva Integration
Host Analytics and Workiva have partnered to optimize the financial reporting process by providing APIs to integrate Workiva’s Wdesk (a collaborative work management platform) with Host Analytics platforms. With the ability to integrate data directly from Host Analytics into the Workiva Wdesk platform, organizations can achieve a seamless financial close, consolidation, reporting, and disclosure process.
You might leverage this integration by using Host Analytics to generate US GAAP and IFRS compliant balance sheets, income statements, statements of cash flow, and other financial and statutory reports. Create board-ready reports and presentations that integrate structured financial and operational data with unstructured data and commentary. And, leverage Wdesk to create and manage complex reporting requirements, including SEC filings, XBRL, and iXBRL.
In Practice
You’ll use Host Analytics APIs to extract the metadata (the report structure) and data (the data in the report) directly from your financial reports generated within Host Analytics. These APIs are integrated with Workiva via Boomi. The extracted financial metadata and data is loaded to the WDesk platform, which automates the process of generating SEC filings and XBRL tagging.
Because the APIs extract data directly from your financial reports, the need for consolidation, the generation of financial statements, and other manual steps in WDesk is eliminated. Additionally, these APIs provide you with the option to override page level parameters on the Dynamic Report.
API authentication for data and metadata extraction as well as dimension security on the data is applied based on Integration User as configured for the data load APIs.
Best Practice Tips and Tricks
To override page level parameters on the dynamic report, you must provide the dimension name and dimension code.
Example - {[Scenario].[Actual]} ,{ [Time].[2015], [Time].[2016]}, {[Company].[US Company1]}
APIs extract the data from the OLAP cube. Excel formulas, report level comments, formulas, headers, logos, notes etc. are excluded.
APIs are supported only for Financial and Financial Snapshot Reporting Areas (a.k.a cubes).
In Practice: Workiva API Sample
Request :
{

"ReportCode" : "Naren DR",

"Lineage" : "File Cabinet\\Dynamic Reports\\Naren Fav",

"CubeName" : "RepCube",

"PageFilters" : [{ "DimensionName": "Time" , "MemberIds" : [5065, 5070]}],

"ApplyPageFilters" : "true"

}
Response:
{

"RowHeaders":

[

[

{

"Label": "Revenue",

"DimensionName": "Account_12345",

"MemberId": "274"

},

{

"Label": "G/L Data (CC)",

"DimensionName": "Reporting",

"MemberId": "3"

}

],

[

{

"Label": "Sales Deductions",

"DimensionName": "Account_12345",

"MemberId": "275"

},

{

"Label": "G/L Data (CC)",

"DimensionName": "Reporting",

"MemberId": "3"

}

],

[

{

"Label": "Expenses",

"DimensionName": "Account_12345",

"MemberId": "271"

},

{

"Label": "G/L Data (CC)",

"DimensionName": "Reporting",

"MemberId": "3"

}

],

[

{

"Label": "Income Statement",

"DimensionName": "Account_12345",

"MemberId": "272"

},

{

"Label": "G/L Data (CC)",

"DimensionName": "Reporting",

"MemberId": "3"

}

]

],

"ColumnHeaders":

[

[

{

"Label": "1000",

"DimensionName": "Company",

"MemberId": "100"

},

{

"Label": "Actual",

"DimensionName": "Scenario",

"MemberId": "1"

}

],

[

{

"Label": "1010",

"DimensionName": "Company",

"MemberId": "101"

},

{

"Label": "Actual",

"DimensionName": "Scenario",

"MemberId": "1"

}

]

],

"Data":

[

[

"426000",

"270000"

],

[

"192000",

"164299"

],

[

"684678",

"426000"

],

[

"1302678",

"860299"

]

]

}
Modeling 2.4.2
Reminder: Users should go to the Host Analytics Community portal for Release Notifications.
Functional Changes in this Release
Improvements to Model Manager with Support for Model Restore
Improvements to Breakback with Support for 0% Allocations in SpotlightXL
Minor Improvements to the User Interface
Icon Changed for Substitution Variables Icon in Spotlight, Report
Help for Users Who Receive "Incompatible SpotlightXL" Message
Known Issues and Resolved Issues are available in the Host Analytics Support Portal, Zendesk.
Improvements to Model Manager with Support for Model Restore
In this release, Model Restore functionality has been added to the Model Manager in Spotlight. This is the same functionality as in SpotlightXL under Manage, Application Administration, Model Backup/Restore. (Model Backup was added in the previous release; it is available on the More menu for each model.)
Only users with Administrator privilege can see this icon on the ribbon and run Model Restore.
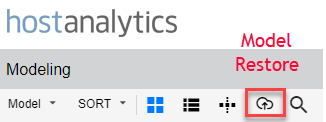
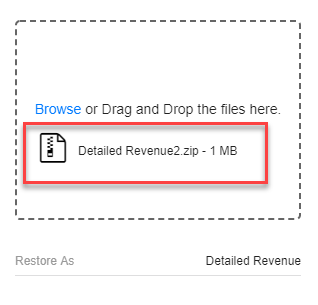
Click the Model Restore button. A panel appears on the right side of the window. You need to find the model backup file that was saved previously and that you want to restore from. The model backup file is a .ZIP file.

Click Browse to open a file selection box. Or drag and drop the .ZIP file into the Model Restore panel. The .ZIP file then appears in the dotted line box.
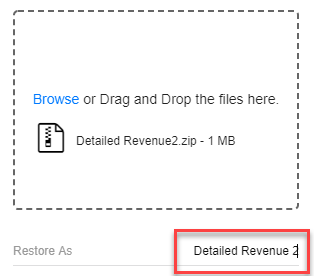
By default, the model will be restored with its original name. If you want to restore the file with a different name, click on the model name next to "Restore As" and change it.
Scroll down, if necessary, and click Restore.

The .ZIP file is processed and, if successful, you see a notification.

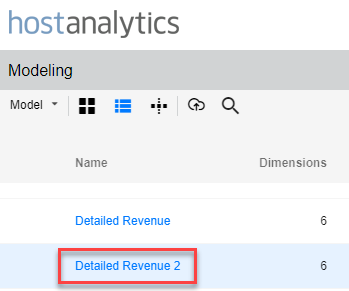
The restored model then appears as one of the models in the Grid or List layout in Model Manager.
Improvements to Breakback with Support for 0% Allocations in SpotlightXL
In this release, users can now specify a 0% increase or decrease in the value of the allocation in SpotlightXL. Support for this capability was added in the previous release in Spotlight and in calculations. It is now supported in SpotlightXL for consistency with Spotlight.
In the Breakback user interface, you can specify 0% for the Current or Reference spread types.
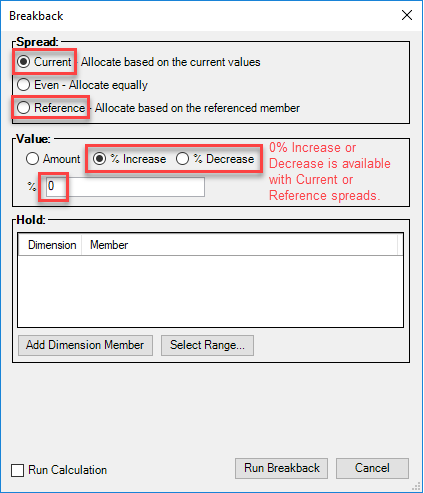
A 0% change is useful in cases where you have a calculation that runs a series of Breakback operations where the value of the change is specified by reference. This use case is described in the Calculation Breakback, Value Reference Example where a user specifies the amounts of several changes in a data input sheet. If one of the inputs by the user is 0, the calculation will run successfully (no data is changed with a 0% allocation).
Audit Log Enhancements
The Audit Log in SpotlightXL has been enhanced to include additional entries. To view the Audit Log, select Manage, Application Administration, Audit Log. Only Administrators can see the Audit Log.
The log displays notification that Application Settings have been updated along with details of what changed.
You need to expand the height of Details cell in the Audit Log to see the Application Settings details.
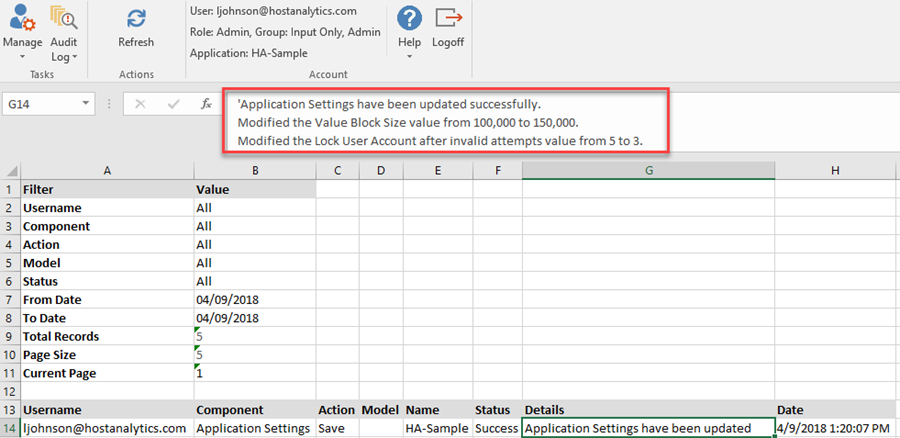
- If the Audit Log says "Application Settings have been updated successfully" with no additional details, then no changes were made. The user may have clicked Save without actually changing anything.
API Enhancements
Clear Leaf Data is an API added in this release. Clear Data has been enhanced to include the option to notify the user upon completion.
API: Clear Leaf Data
Clear Leaf Data is an API added to the Modeling API Library in this release.
This API clears existing leaf data from Master and Analytic models based on the scope of the definition. Clear Leaf Data API results in a success even if all data has been cleared in an earlier call.
You can opt to clear specific leaf data versus the entire model.
To clear specific leaf data, you will use filters. For example, you might opt to clear leaf data for a specific period, department, or company.
To clear all model leaf data, you will use the API without filters.
You can receive a notification via email upon success or failure of the operation. The notifications for success and failure are separate and can be emailed to different email addresses, if desired. This notification is optional.
POST /modeling/model/data/leaf/clear HTTP/1.1
Content-Type: application/xml
Accept: application/xml
X-ACCESS-TOKEN:
<?xml version="1.0" encoding="UTF-8"?>

<clear-data-payload>

<model-name>$ModelName</model-name>

<filters>

<filter>

<dimension>$Dimension/dimension>

<filter-type>$FilterType</filter-type>

<filter-value>$FilterValue1</filter-value>

<filter-value>$FilterValue2</filter-value>

<filter-value>$FilterValue3</filter-value>

…

</filter>

…

</filters>

<notify-on-success>

<email>$EmailAddress</email>

</notify-on-success>

<notify-on-failure>

<email>$EmailAddress</email>

</notify-on-failure>

</clear-data-payload>
Parameters
$ModelName: (type: string) Name of the model in which leaf data will be cleared
$Dimension: (type: string) Name of the dimension in which leaf data will be cleared
$FilterType: (type: string) Dimension filter type
$FilterValue: (type: string) Value of the filter
$EmailAddress: (type: string) Valid email address to receive the notification
Payload Sample to Clear All Leaf Data
POST /modeling/model/data/leaf/clear HTTP/1.1
Content-Type: application/xml
Accept: application/xml
X-ACCESS-TOKEN:
<?xml version="1.0" encoding="UTF-8"?>

<clear-data-payload>

<model-name>ClearModelTest</model-name>

<filters>

<filter>

<dimension>Measures</dimension>

<filter-type>FixedMember</filter-type>

<filter-value>MTD</filter-value>

<filter-value>YTD</filter-value>

</filter>

<filter>

<dimension>Scenario</dimension>

<filter-type>FixedMember</filter-type>

<filter-value>Actual</filter-value>

<filter-value>Budget</filter-value>

</filter>

</filters>

<notify-on-success>

<email>john.doe@mycompany.com</email>

</notify-on-success>

<notify-on-failure>

<email>john.doe@mycompany.com</email>

</notify-on-failure>

</clear-data-payload>
For more information, see the Modeling API Library.
Improved API: Clear Data
The existing Clear Data API has been modified to allow users to receive a notification via email upon success or failure of the operation. The notifications for success and failure are separate and can be emailed to different email addresses, if desired. This notification is optional.
The change in syntax is shown below in green.
POST /modeling/model/data/clear HTTP/1.1
Content-Type: application/xml
Accept: application/xml
X-ACCESS-TOKEN:
<?xml version="1.0" encoding="UTF-8"?>

<clear-data-payload>

<model-name>$ModelName</model-name>

<filters>

<filter>

<dimension>$Dimension/dimension>

<filter-type>$FilterType</filter-type>

<filter-value>$FilterValue1</filter-value>

<filter-value>$FilterValue2</filter-value>

<filter-value>$FilterValue3</filter-value>

…

</filter>

…

</filters>

<notify-on-success>

<email>$EmailAddress</email>

</notify-on-success>

<notify-on-failure>

<email>$EmailAddress</email>

</notify-on-failure>

</clear-data-payload>
For more information, see Clear Data in the Modeling API Library.
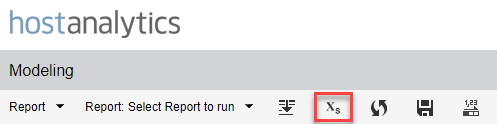
Icon Changed for Substitution Variables Icon in Spotlight, Report
In Spotlight, when a report includes Substitution Variables, an extra icon appears on the ribbon. The icon for Substitution Variables has changed as follows:
Help for Users Who Receive "Incompatible SpotlightXL" Message
Some users do not upgrade their SpotlightXL Add-In regularly. Sometimes, when a new version of Modeling is released, older versions of the SpotlightXL Add-In will not work. Users will then see an error message "Incompatible SpotlightXL version, please upgrade to the latest addin" after logging in. In this release, the error message box will contain a link to the online help where users can get help in understanding why the error occurred and how to upgrade their SpotlightXL Add-In. The link says "Download SpotlightXL."
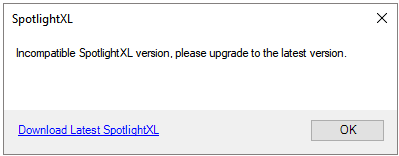
See Incompatible SpotlightXL Error.
Known & Resolved Issues
Known application issues we are working to resolve, as well as any resolved issues for this release, can be found in the Host Analytics Support Portal, located at hostanalyticsinc.zendesk.com/home.
Support Portal Access
User authentication is required to access the Support Portal. To access the Support Portal directly, setup a password which will work with the email address you use to access your Host Analytics application as follows:
- Navigate to https://hostanalyticsinc.zendesk.com/access/help.
- Enter the email address you use to sign into your Host Analytics application.
- Open your email client and locate the email titled, "Host Analytics, Inc. password reset" and follow the instructions in the email.
Feature/Functionality Retirement
Information on features and functionality planned for retirement is provided here: https://hostanalyticsinc.zendesk.com/hc/en-us/articles/212952083-Feature-Deprecation-Summary-Timeline
Was this article helpful?