Copying Spotlight Formulas from an Excel View or Report to PowerPoint
- 2 Minutes to read
- Print
- DarkLight
- PDF
Copying Spotlight Formulas from an Excel View or Report to PowerPoint
- 2 Minutes to read
- Print
- DarkLight
- PDF
Article summary
Did you find this summary helpful?
Thank you for your feedback
Overview
Users who have SpotlightXL views and reports can copy all or part of them to PowerPoint. There are two methods:
Copy Formulas method, available in views and reports
Design PowerPoint Report method, available in views only
Copying Spotlight Formulas to PowerPoint using Copy Formulas
Begin by opening and running the View or Report in SpotlightXL containing the data you want to copy to PowerPoint. Views are run from the Analyze menu. Reports are run from the Report menu.
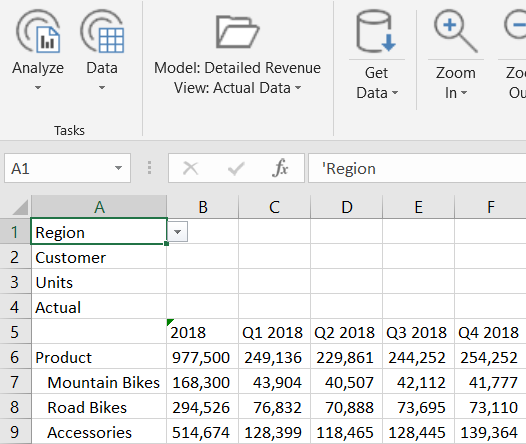
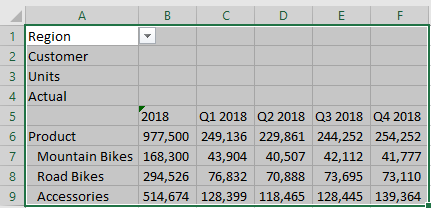
Highlight the portion of the View or Report that you want to copy to PowerPoint.
Click the More menu, then Copy Formulas.
Note:Spotlight uses the power of user-defined functions to connect Excel, PowerPoint, and Word to Dynamic Planning. All data and metadata from Dynamic Planning are represented in formulas, just as they are with Excel-based Reporting.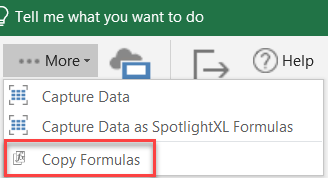
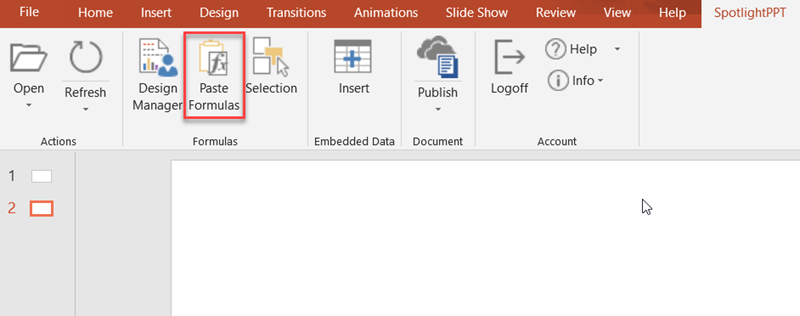
Open PowerPoint and select the slide that you want to paste the data into.
On the SpotlightPPT ribbon, click Paste Formulas.
The formulas are pasted in and are grouped together as an object. Select, move, and resize the object however you want it on the slide.
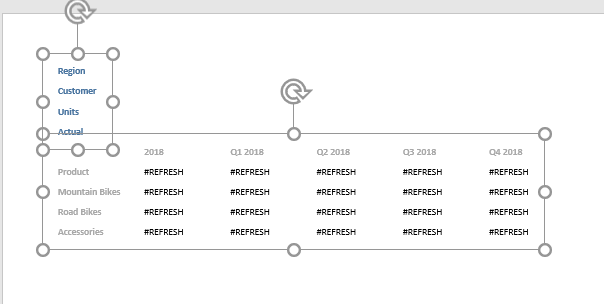
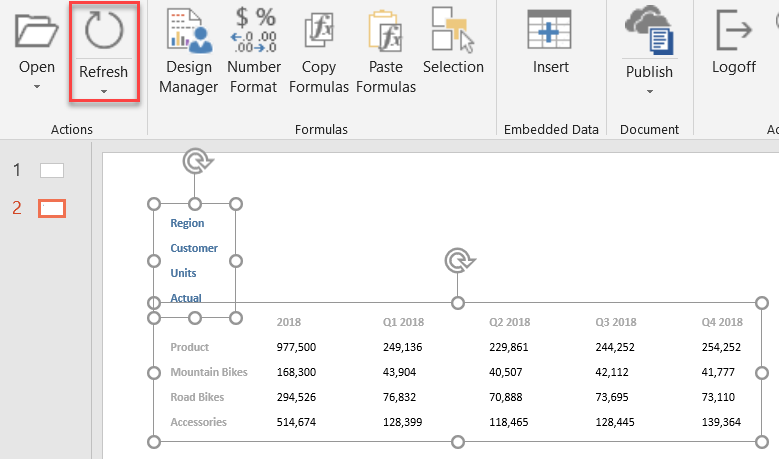
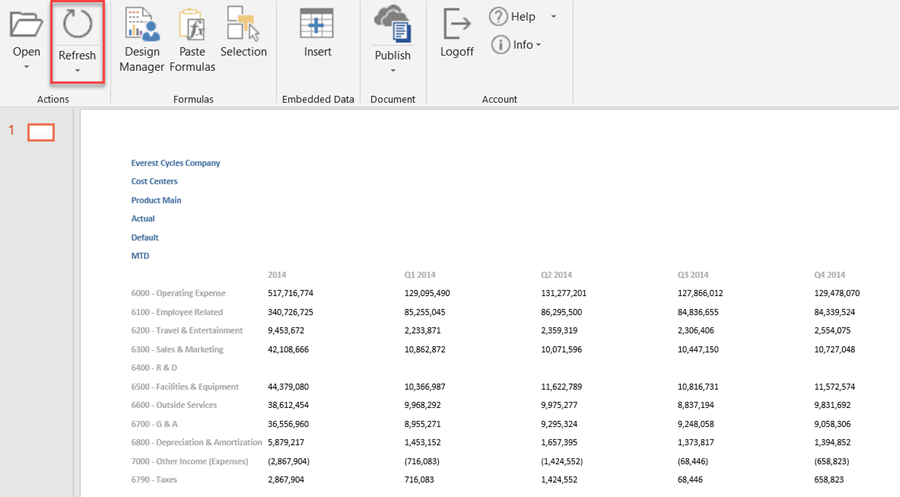
On the SpotlightPPT ribbon, click Refresh. The #REFRESH data cells are then filled in.
If you have multiple slides with data from Dynamic Planning, you can use Refresh All Open Reports to refresh all slides at once. This is similar to how reports are refreshed in Excel-based Reports.
Copying Spotlight Formulas to PowerPoint using Design PowerPoint Report
Using the Design PowerPoint Report method copies all metadata and data from the view into PowerPoint.
Begin by opening and running the View in SpotlightXL containing the data you want to copy to PowerPoint. Views are run from the Analyze menu.
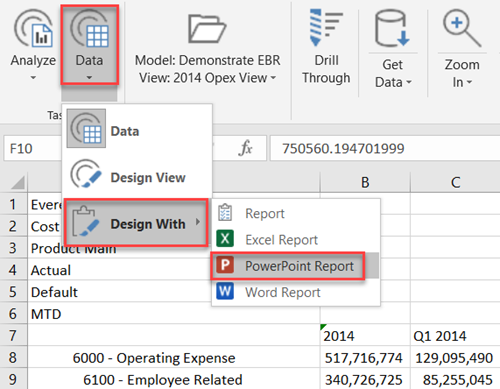
On the Data menu, select Design Report, PowerPoint Report.
While the data is being copied, you see a status bar, such as this one.
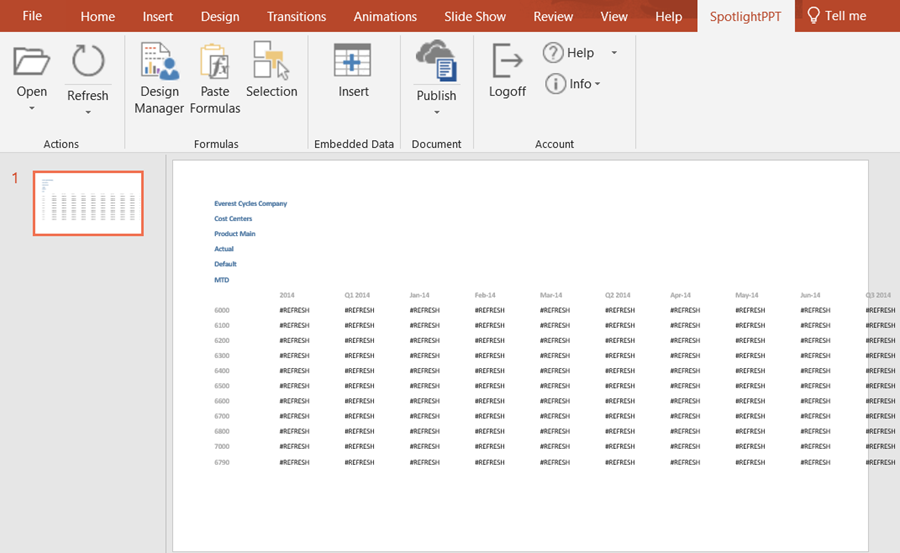
When the operation is complete, PowerPoint displays the metadata and data points for the entire view. It may exceed the limits of the slide if you have a lot of cells in the view.
Use your mouse to select and drag and drop elements to lay out the report.
Note:If you ungroup the cells in order to move them, please try to align them in a grid structure if you later want to use them in a chart. Data and metadata cells that are well aligned vertically and horizontally will work best when they are used to specify the range of data for the chart. Any excess blank space or uneven rows or columns can cause blank rows or columns to appear in the Edit Data sheet.To view the data, click Refresh.
Was this article helpful?