- 4 Minutes to read
- Print
- DarkLight
- PDF
Cube Settings
- 4 Minutes to read
- Print
- DarkLight
- PDF
Attribute Settings
Attributes and attribute hierarchies are mapped to reporting cubes for reporting purposes.
You can map attributes as either attribute hierarchies or properties, with up to ten attributes and hierarchies per Financial reporting cube and ten for Sales reporting cube (twenty total). Attributes can be used just like dimensions, i.e., dragged to slice and dice across axes, drilled down, etc.
You can add any remaining attributes created on dimensions as member properties. There is no limit to the number of properties that can be mapped. Attributes mapped as properties cannot be drilled upon. Properties show up as notes on a report. They can be included as mapped properties in the Report Setup for Dynamic Report. When you run the report, they’re displayed.
Attribute Settings are processed in the cloud so you can continue working while processing takes place. Once complete, you will be notified via email, as well as via an in-application notification.
Manage Attribute Mappings
- Navigate to Maintenance > Reports > Cube Settings.
- Click the Attribute Settings tab.
- Select a Reporting Area.
- To map an attribute from the Mapped Attributes list:
Click the Add icon. The Select Attributes screen appears.
Locate the attribute in the hierarchy and select it.
Click Add Selected. The attribute is added to the Mapped Attributes list. (To unmap an attribute from the list, select it and click the unmap [X] icon.)
- To map an attribute to the Mapped Properties list:
Click the Add icon. The Select Attributes screen appears.
Locate the attribute in the hierarchy and select it.
Click Add Selected. The attribute is added to the Mapped Properties list. To unmap an attribute from the list, select it and click the unmap [X] icon.
- (optional) Select Include Rollup Members to include leaf level members with the mapped attributes. Leaf level members represent the posting level members of a hierarchy and contain attribute values.
Example of How to Use Attributes
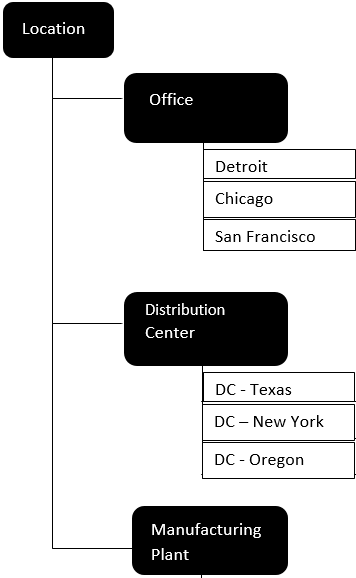
Let's say you have a Location dimension that has different types of physical locations such as offices, distributioncenters, and manufacturing plants. Using the hierarchy example below, on your Location dimension, you have a hierarchy that has all distribution centers rolling up to a parent (DC-Texas,DC-New York, and DC-Oregon roll up to Distribution Center parent), all manufacturing plants rolling up to a Manufacturing parent and all offices rolling up to an Office parent. On your Profit and Loss Statement, you have totals for Distribution Centers, Manufacturing Plants and Offices using the primary hierarchy shown below for the Location dimension.
Primary Location Hierarchy

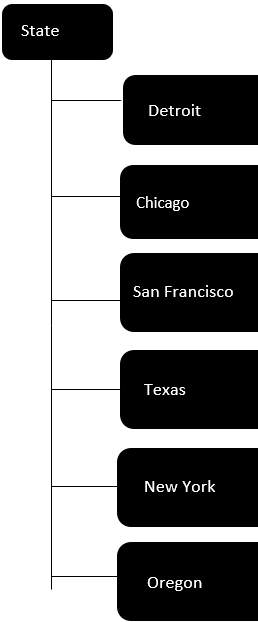
These locations (offices, distribution centers and manufacturing plants) are located in different states. The Tax department needs a different view of these locations that shows totals by state for tax return purposes.
To provide this information to the Tax department, you could reorganize the Location dimension so that the leaf member rollup is by State, but then you would not have totals by distribution center, manufacturing, and offices. Instead, create an "alternate" or "second view" of the Location dimension and name it State (shown below) while still retaining the view in your primary hierarchy (shown above).
New Attribute on Location Dimension Named State

Edit the Location dimension and update the attribute value for each leaf member to identify the state where that location exists. You can also load this data using Data Load Rules. Next, map the attribute to the Financial Reporting cube so that you can use it in reports. You do so by navigating to Maintenance > Reports >Cube Settings. Add the State attribute to your Financial Cube via the Attribute Settings tab (shown below).

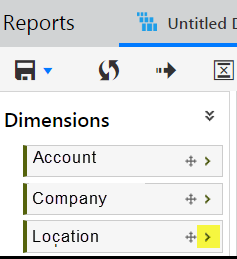
Once the attribute is mapped to the cube, you can use it like a dimension. When you open a new Dynamic report, you will notice that the dimension (Location in this example) selection box has changed and has a greater than icon (>) on the right (highlighted in yellow in the image below). When you click the Location dimension, it will expand and you will see the attribute (State in this example). Drag it to an axis and use it like any other dimension to build the Dynamic report.
Location Dimension in Dynamic Report List of Available Dimensions - Click to Expand and View State Attribute

Scorecard Attributes
For Scorecard:
Attributes and attribute hierarchies mapped for Financial Segments are populated automatically in the Scorecard cube and available in the Scorecard Reporting Area in Reports and Scorecard modules.
Attributes mapped as properties are also available in the Scorecard Reporting Area in the Reports module.
Report Settings
Enter the maximum number of formula exceptions. Exceptions include invalid formulas. The maximum number of formula exceptions that can configured is 999.
Default Members
When you run a Dynamic Report, the system expects values for each dimension mapped to the cube, regardless if you use the dimension in the report. For this reason, default values are automatically created for each dimension.
To edit these default members:
- Navigate to Maintenance > Reports > Cube Settings.
- Click the Default Members tab.
- Select a Reporting Area (Financial, Sales, etc.) The pre-defined default members for each dimension appear under the Default Member Name column, listing the root node value in the hierarchy (e.g., Department Main for Department dimension).
- Click the Change Default Member edit icon for the dimension default member you want to edit (e.g., Org). The Account Hierarchy screen appears.
- Navigate through the hierarchy and highlight the member of the hierarchy you want to assign as default.
- Click Select. The change appears under the Default Member Name column.

