Dynamic Planning Analyze, Data
- 18 Minutes to read
- Print
- DarkLight
- PDF
Dynamic Planning Analyze, Data
- 18 Minutes to read
- Print
- DarkLight
- PDF
Article summary
Did you find this summary helpful?
Thank you for your feedback
Overview
With the Data subtask, you can select models, associated views, and explore the data.
A Model is a multi-dimensional structure that contains data and metadata. The Model list box provides a list of all models for which you have access.
A View is associated with a model and provides a starting point for analysis. There are Default and Custom views. A Default view is automatically created when a model is created and provides a way to get started with navigating through the dimensions and laying out how you want to view the data. A Custom view can be created to save a specific layout of dimensions, members, and data.
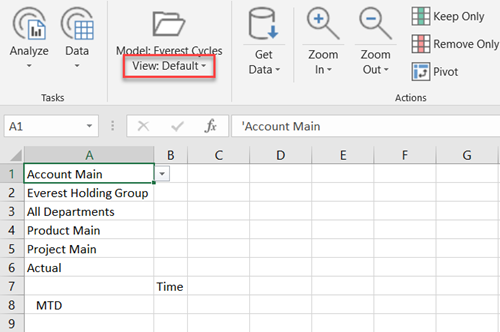
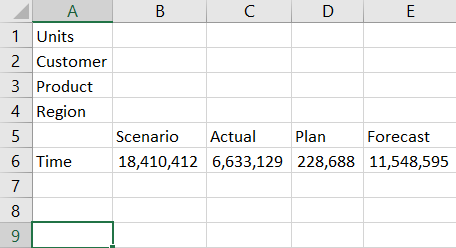
To access the Data subtask, select the Analyze task and the Data subtask. Then, select the View: Default list box to select a Model and a View.
Once you select a model and a view, features and functions become available within the body of the spreadsheet as well. Once you select
Data in the spreadsheet, actions become available in the ribbon.
See also: How to Work with Model, View, and Report Folder and Organization Functionality.
Default Views
Default views cannot be deleted, renamed, or moved. For each model, a default layout is created with each dimension listed. In the folder drop-down, each additional view is listed under the Default. Default views are read-only.
You cannot make changes to data using the Default view. Lay out the view that way you want and then select Design View and Save the view in order to enable operations, such as Save Data and Breakback.
See Create a View and Specify View Properties.
View Navigation Actions
When you perform actions (such as Zoom In, Zoom Out, Pivot, and Keep Only), the view changes according to the action performed.
Let's say your manager wants you to view a certain set of data. Your manager might start with a default view, slice and dice the view by performing actions, save the view (Custom view), and provide you with permission to access the view.
When you select the model, your manager’s view will be available in the View list box along with any other views you have access to. (Views are useful especially in this situation as you do not need to perform the same actions your manager performed to see the data the way it needs to be analyzed.)
Numerous actions can be performed on a model and a view using the actions in the ribbon.
Tip:
to ensure that you see the parent-child relationships of your data, ensure that your View is saved with the property Indent Row Members set to Yes.
Zoom In
Under the Zoom-In action there are specific actions, which define how the zoom-in displays the data.
Zoom In - Double-Click

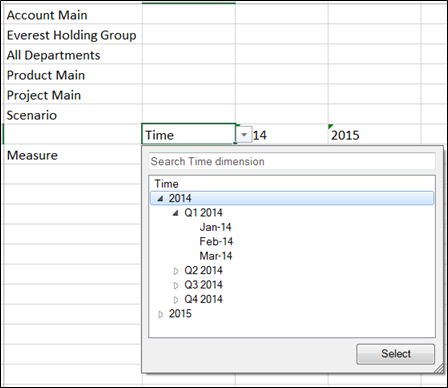
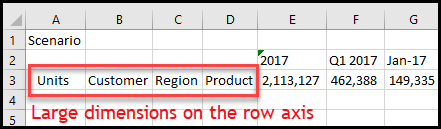
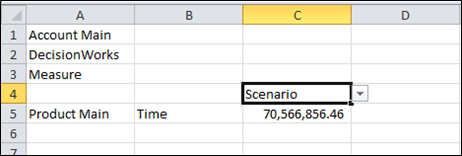
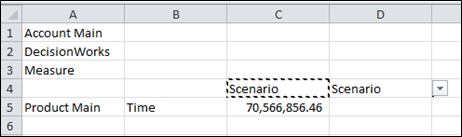
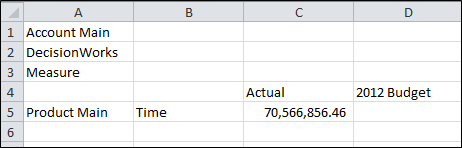
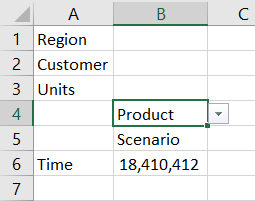
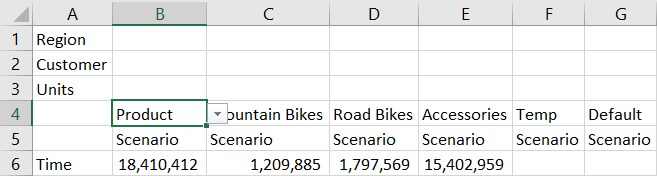
This action displays children of the selected member in a dimension hierarchy. For example, in the image below, Zoom In is selected for the Scenario dimension. Notice that all scenarios available in the list box are displayed in the spreadsheet. You can also select a specific scenario from the list box if you do not want to display them all.
Tip
Instead of clicking Zoom In, double-click to perform the same action.Or if you are left-handed, double-right-click.
Before Zoom In:
Scenarios Available:
After Zoom In:
Zoom In - Children

This is the default action if you just click Zoom In or if you double-click.
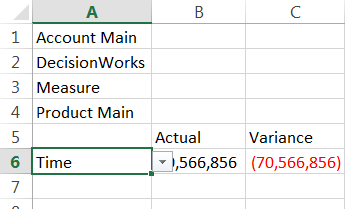
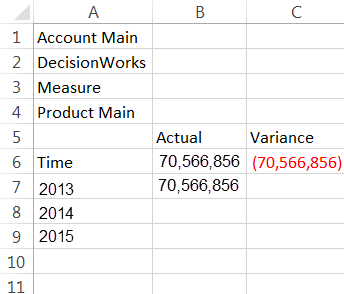
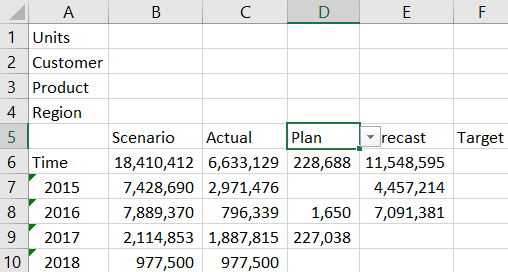
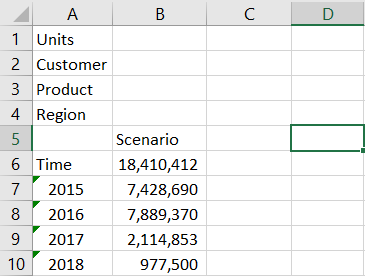
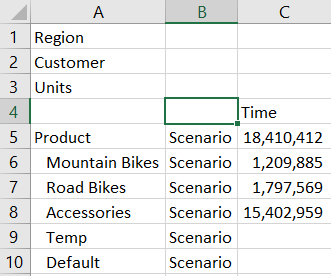
Select a dimension and then click Zoom In, and select Children. When Zoom In, Children is selected for the Time dimension, only the highest-level parent for each year is displayed.
Zoom In - Leaves

Select a dimension and then click Zoom In, and select Leaves. When Zoom In, Leaves is selected, leaf-level members associated with the selected dimension member are displayed, and all parent members in the dimension are removed from the view.
For example, if you select Scenario and click Zoom In, Leaves, the children are displayed and the parent member is removed.
Original:

Zoom In, Leaves:
Zoom In - All Children

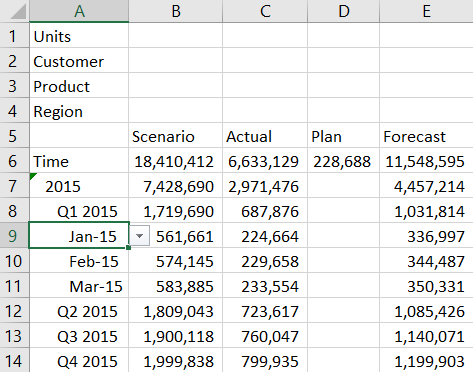
Select a dimension and then click Zoom In, and select All Children. When Zoom In, All Children is selected for the Time dimension, yearly, quarterly, and monthly data for all years are displayed.
When Zoom In, All Children is selected for the Time dimension, yearly, quarterly and monthly data for 2014 and 2015 is displayed as shown below.
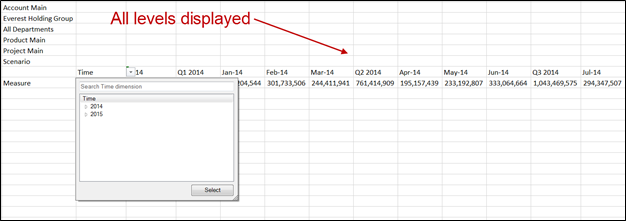
Note:
Use caution when selecting the All Children option. Using this option on dimensions with an enormous amount of members may impact performance.
Zoom In - Data Leaves

Select a dimension on the row axis and then click Zoom In, and select Data Leaves. When Zoom In, Data Leaves is selected, leaf-level members associated with all the dimensions on the row axis are displayed, but only if they contain data. All parent members in the dimension are removed from the view.
For more information, see Dynamic Planning: How to Find Data Cells Quickly.
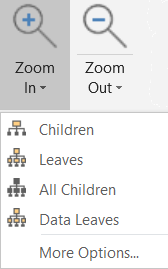
Zoom In - More Options

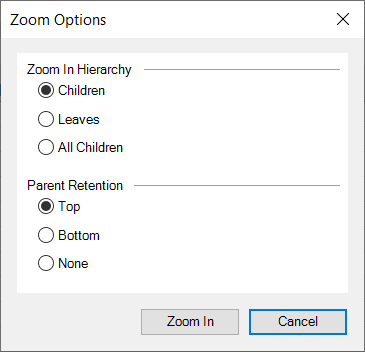
To perform a Zoom In action with a combination of options, select how far you want to Zoom in the upper section of the Zoom Options box, and what to do with the parent member in the lower section of the Zoom Options box.
You can keep the parent members above their children, move the parent members below the children, or remove the parent. Placing parent members below the children offers the ability to have subtotals and totals below the details in your views and subsequent reports.
Zoom Out
Zoom Out/Double-Click
Zoom Out to the next highest level within a dimension hierarchy. For example, in the images below there is a Time dimension that is expanded to show years. Double-click on the Time cell (or click on the cell and select Zoom In) to display all Time dimension members. Click on the cell that contains 2013, 2014, or 2015 and click Zoom Out to view only the parent Time dimension member.
Tip
Instead of clicking Zoom Out, double-right-click to perform the same action.Or if you are left-handed, then double-left-click.
Original:
Zoomed In:
Zoomed Out:

Zoom Out - Parent

This is the default action if you just click Zoom Out.
Select a dimension member and then click Zoom Out, and select Parent. When Zoom Out, Parent is selected for a month in the Time dimension, only the next-highest-level parent for the month is displayed.
Before Zoom Out, Parent:
After Zoom Out, Parent:
Zoom Out - Top Level
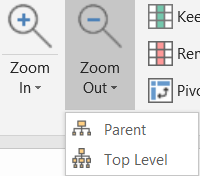
Select a dimension member and then click Zoom Out, and select Top Level. When Zoom Out, Top Level is selected for a month in the Time dimension, the view changes to go all the way back to the Top Level (the top or root of the dimension, or the topmost member in the dimension that you have access to).
Before Zoom Out, Top Level:
After Zoom Out, Top Level:
Pivot
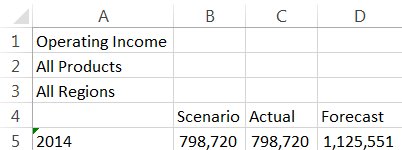
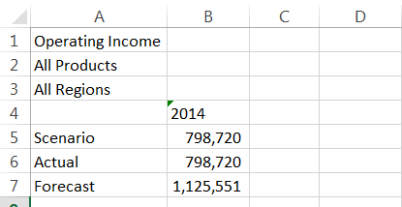
Swap row and column dimensions. For example, in the model below Scenario, Actual, and Forecast are column headers and 2014 is a row header. Click Pivot and 2013 becomes a column header and Actual and 2013 Budget become row headers.
Before clicking Pivot:
After clicking Pivot:
Keep Only
Keep only certain data within a view. This action works the opposite of the Remove Only action. Select a cell containing members from a dimension you want to keep and click Keep Only. All other dimension members will be removed and only the data and metadata within the selected intersection will be displayed. Data that is not kept is not permanently removed or deleted. It is just removed from the view.
Remove Only
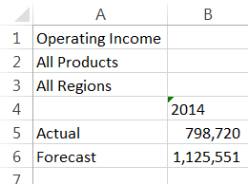
Remove data and metadata from a view. For example, there are two scenarios (Actual and Forecast) for 2014 and you want to view the Actual scenario only. Select the Forecast cell and click Remove Only. Remove Only does not permanently remove or delete data. It just removes the intersections from the view.
Original
Removed
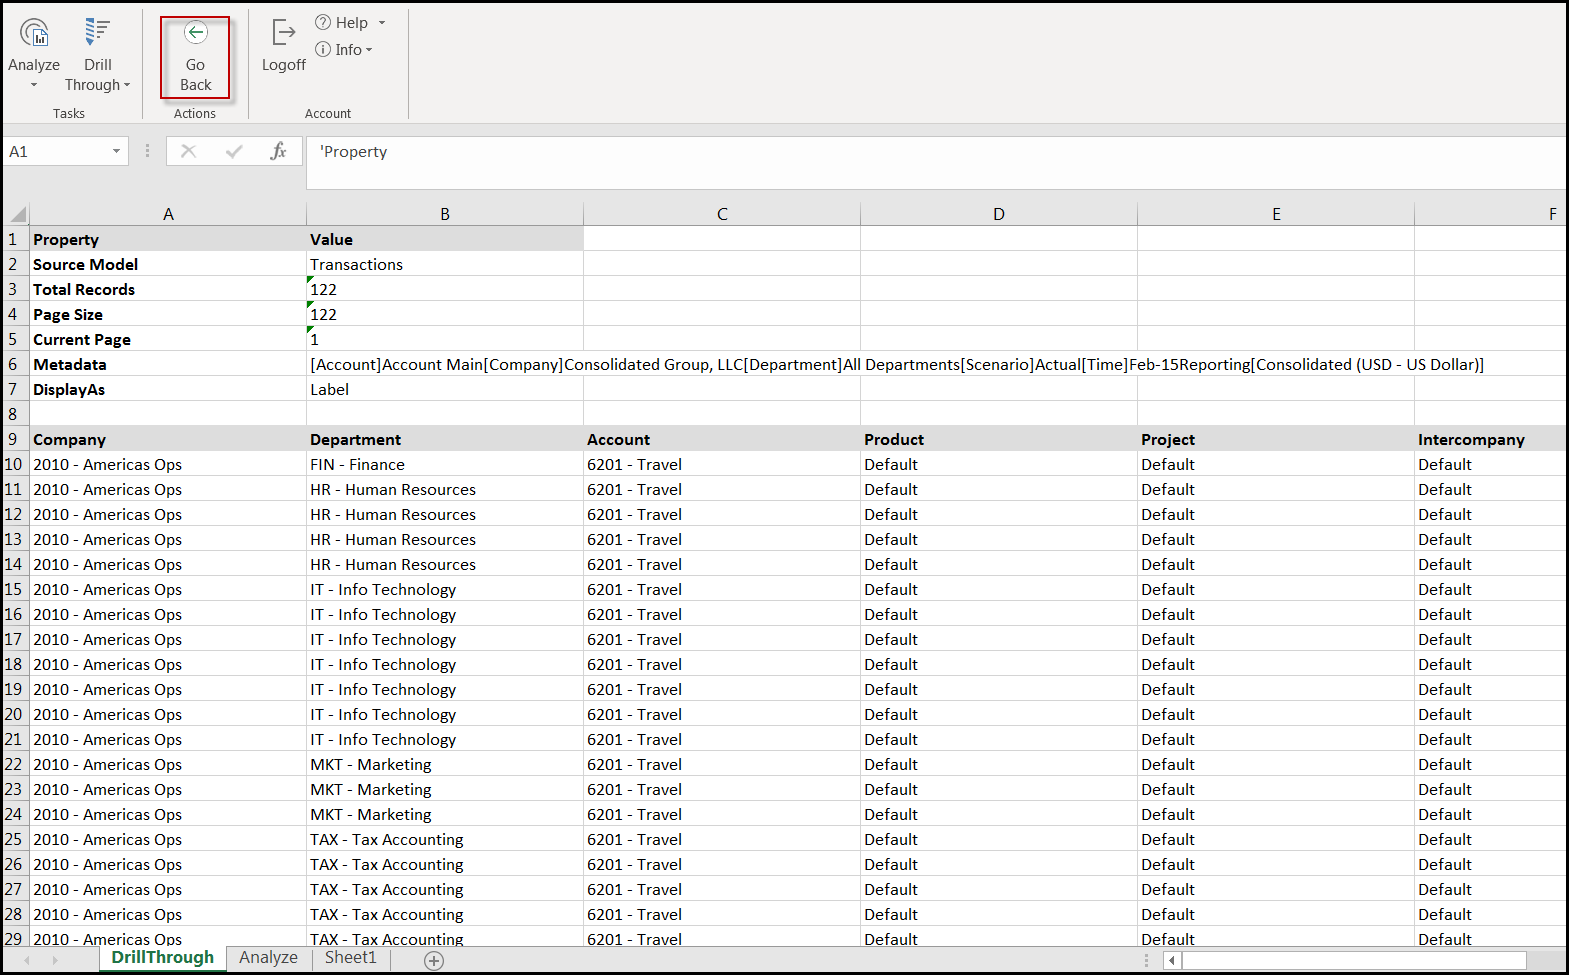
Drill Through
Note:
If you do not see Drill Through on the menu, then the view does not have drill-through data available.
This action displays detail data for Master models loaded to Dynamic Planning through Planful Structured Planning, Consolidation, and Reporting applications or from an external data source. All users, regardless of access privileges, can drill through detail data exposing read-only detailed information.
To drill through:
Select the Analyze task and the Data subtask.
Select a model and a view.
Select one or more data cells for which you want to view detail-level information.
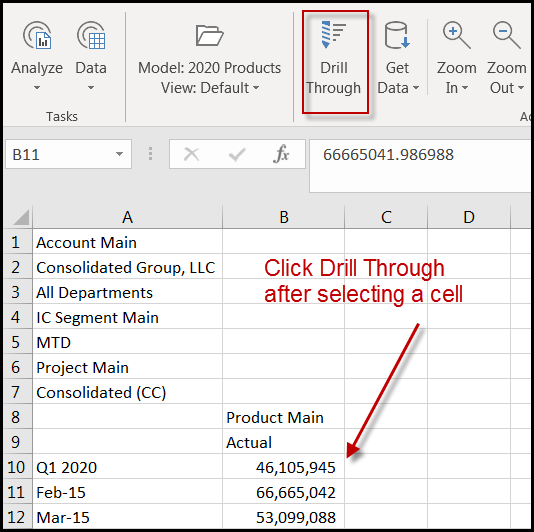
Click Drill Through. A new tab is created in Excel called DrillThrough and detail data is displayed.
Click Go Back to return to the view displayed prior to clicking Drill Through.
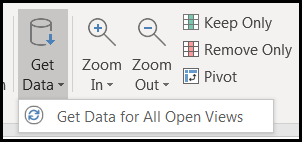
Get Data
This action updates data in the spreadsheet after selections are made. If multiple views are open, select the Get Data for All Open Views option.
Save Data
If you do not see Save Data on the menu, then the view does not have Save enabled. See Enabling Menu Items in Views and Reports: Save Data and Breakback.
This action saves modified data to the view, provided that Enable Save is set to Yes in the View Properties. Users can save changes only to leaf-level data.
If a user tries to save data changes to rollup members in the view, a message appears informing them that the changes have not been saved. The change they made remains on the screen but has not be committed to the model.
When the rollup notification appears, if the Save action was set to also a run a calculation, the calculation will not be run.
Note:
- If you want the calculation to still be run on a view with all rollups, then disable the Save action.
- When saving changes to an ad-hoc view, an error message shows invalid members. Click OK to view the list below the View.
(1).png)
If the view consists of combination of leaf-level and rollup-level cells, then the validation is not run. The leaf-level cells will be saved and the rollup level cells will not be saved.
Breakback
If you do not see Breakback on the menu, then the view does not have Save enabled. See Enabling Menu Items in Views and Reports: Save Data and Breakback.
This action opens the Breakback box where you can select a spreading method and allocate changes in numeric data from the top down.
For details, see Breakback from View or Report.
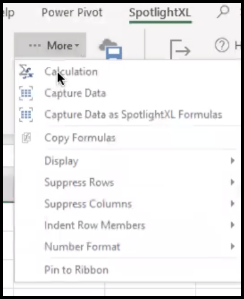
More
More - Calculation
The Calculation option provides a quick way to adjust underlying Calculations and associated Formulas to achieve desired results whether in Report/View Design or Run mode. For example, let's say you have a View where you forecast units and multiply the price to result in sales. Now, you can quickly change a Calculation and associated Formula to recalculate forecasted sales to provide another sales scenario.
More - Capture Data
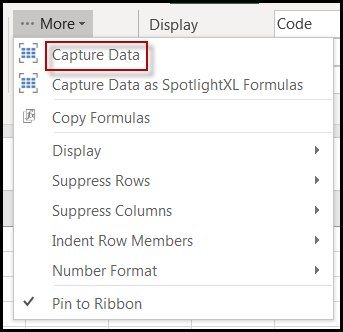
Select Capture Data to capture data intersection details to use when creating a formatted report from a view. Once captured, red marks are displayed in the upper right-hand corner of the cells. These red marks indicate that the coordinates of the data are recorded or "captured". The metadata intersections will be used in the report layout.
More - Capture Data as SpotlightXL Formulas
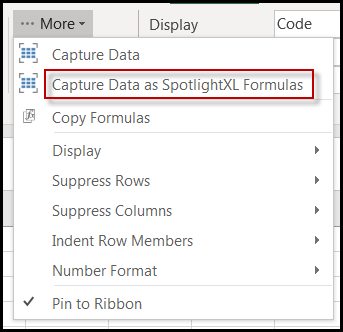
Select Capture Data as SpotlightXL Formulas to capture data intersection details to use when creating an Excel Report from a view. Once selected, all the data items show as #REFRESH, and cell contents consist of SpotlightMetadata or SpotlightData formulas.
For detailed information on how to use this feature, see Creating Excel Reports.
More - Copy Formulas
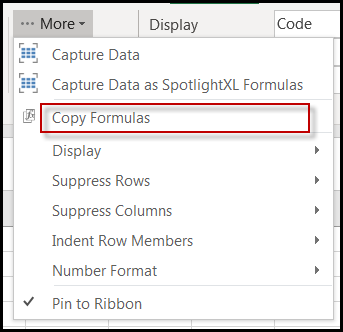
Users who have SpotlightXL views and reports can copy all or part of the formulas to PowerPoint.
For information on how to copy formulas, click here.
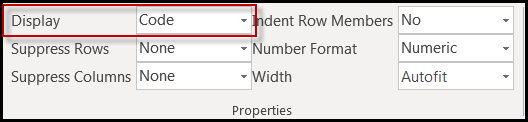
Properties
Frequently used View properties are under the More listbox as well as displayed in the Properties portion of the ribbon. This prevents the need to go to the Properties screen to define them.
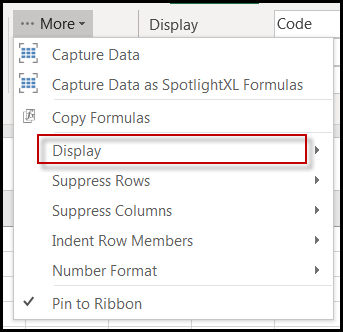
Display
Open a view and click the More list box. Select Display. Or, select the drop down from the Properties ribbon.
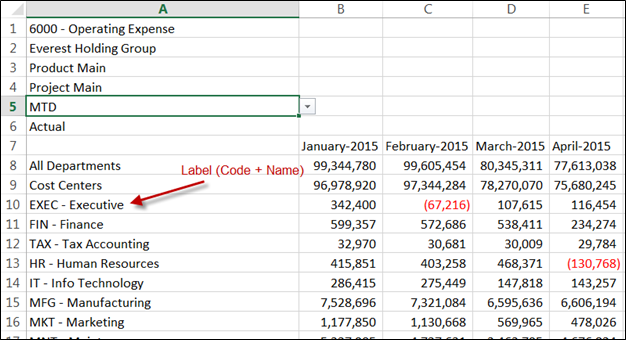
Display Label Example
Display Code Example
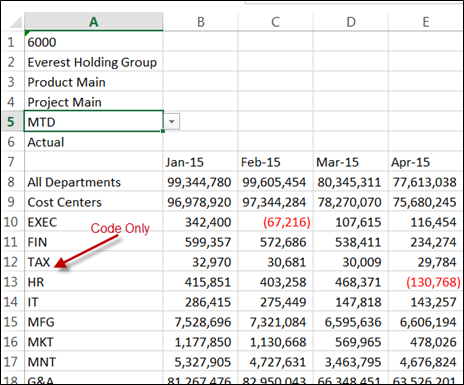
This functionality provides the flexibility to both analyze and report the data based on Code or based on Display Label for the dimensions in the Model.
Important
This functionality eliminates the need for lookups. However, you can continue to use lookups. If you want to use Display Label functionality for a model that has been sourced from Structured Planning, Consolidation, and Reporting applications with lookups, we recommend that you recreate the model.
For models sourced from Structured Planning, Consolidation, and Reporting applications, the Display Label is defaulted to the dimension member code-name. For example, if a dimension member is named Executive and the code is Exec, the Display Label would be Exec - Executive. If no name exists for dimension member, the dimension member code is displayed.
You can set the Display Label for each individual report or view.
See Also: Customizing the Display Label
Number Format
Change the number format for numeric values in the displayed view to Currency or Percentage.Numeric is the default.
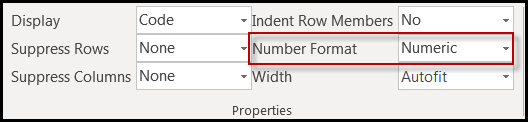
Currency – display all numbers in the view in currency format ($).
Percent – display all numbers in the view in percentage format (%).
Numeric – display all numbers in the view in numeric format. Numeric is the default.
See: How to Define Multiple Number Formats for Dimension Members in Views
Suppress Rows/Columns
Suppress no rows/columns (None), suppress rows/columns that have a zero value (Zero), suppress rows/columns that have no data (Blank), or suppress rows/columns that have a zero value and no data (Both - Zero and Blank) for a displayed view.
Indent Row Members
Indent dimension members on the rows for the displayed view. Select Yes to indent or No. No is the default.
Indented Example
Width
The width of the column in the spreadsheet view as defined in pixel width. This setting applies to all columns in the view. A default setting 'Autofit' will adjust columns based on the data displayed in the columns.
Spreadsheet Body Functionality
There are several features and functions available within the body of the spreadsheet, as described below.
Tip
For a model view, the values that result from an Excel formula are saved, although, the formula itself is not saved.
Dimension Drag and Drop
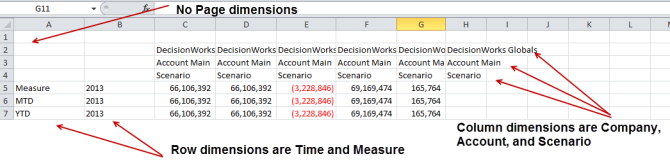
To move dimensions between the axes of your analysis (for example, page, row, or column), drag and drop the dimension. For example, you have a Product dimension and you want that dimension data displayed in the row to see product lines. Select the Product Main cell by clicking on and holding the drop-down arrow and dragging to the row then dropping on top of the Time dimension. You can then click the Zoom In action to reveal detailed levels within the Product Main hierarchy. Dimensions can be dragged and dropped between any of the axes, but there must be at least one dimension on both the row and column axes. No dimensions are required on the page axis.
Drag and drop:
No page dimensions, 3 column dimensions, and 2 row dimensions:
Copy/Paste (Ctrl+C/Ctrl+V)
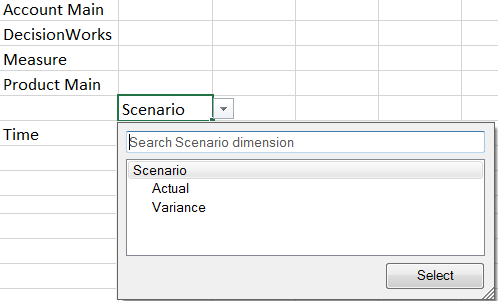
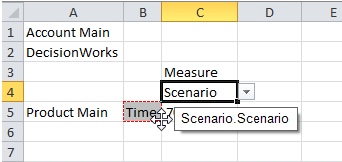
You can copy and paste cells, including underlying data or dimension members, within the spreadsheet. For example, copy the Scenario cell (cell C4) and paste it in cell D4. Then, select a scenario from the list box for each cell.
Copy Scenario:
Paste Scenario:
Scenario selected for each cell:
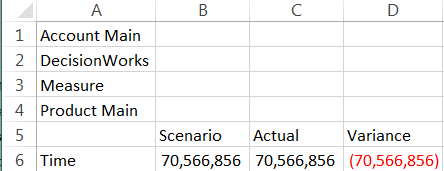
Direct Cell Entry
Enter dimension data directly in a cell. For example, you have Actual and 2014 Budget scenarios. Now, you want to add the Variance scenario in the column next to 2014 Budget. To do so, select the cell and enter the word Variance. Then, click Refresh to update the spreadsheet data with variance data.
Data Entry
You can change the data displayed in a view or report. When you enter a numeric value and press Enter, the cell changes to a yellow background, which indicates that the data change is unsaved.
Entering numeric values follows the same rules as Excel. When entering a value over 1000, for example, do not type the thousands separator; just type the digits. If you are viewing numbers in a currency, such as Euro, Dynamic Planning honors the thousands separator of. instead of, and the decimal separator of, instead of. for example.
To save your data changes, click Save Data. Only changes to leaf-level data are saved. If you change data in a parent cell, it is ignored when you click Save Data.
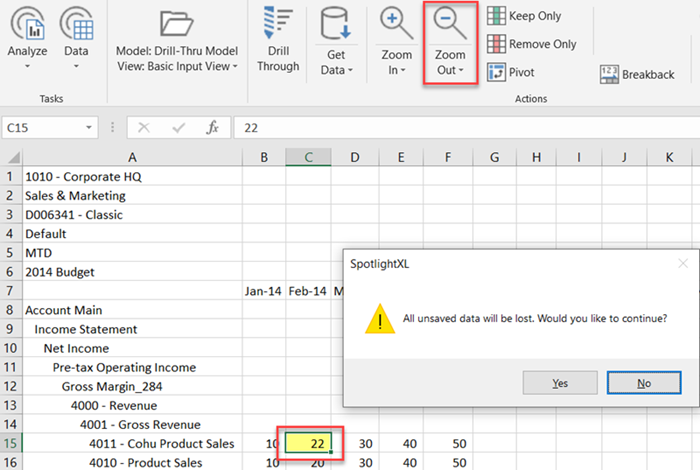
Dynamic Planning warns you if you attempt to navigate while there is unsaved data on the screen. If you choose an option that would change the display of data on the screen, Dynamic Planning will prompt you if you have not saved data changes.
See also: Save Data.
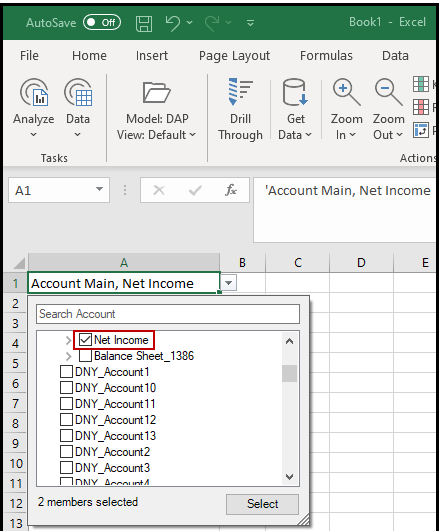
Retain Member Selection in Alternative Hierarchies
In the Analyze task, if you have common members in your Product Main Hierarchy and Alternative Hierarchy; and you click Get Data after selecting the common member from Alternative Hierarchy, the Search Account member drop-down menu shows the Alternative Hierarchy member as the selected member.
For example, if you have “Net Income” as a common member in your Product Main Hierarchy and Alternative Hierarchy, and you select “Net Income” from your Alternative Hierarchy. When you click Get Data, the Search Account member drop-down menu shows the member selected as “Net Income” from the Alternative Hierarchy. The image below shows the details.
List Box Search
Use Search list box functionality to quickly search for specific data. In the example below, the Product Main dimension list box displays members. When search criteria is entered, the up and down arrows appear. Click the arrows to move through search output. In the image below, there are 6 members that start with B0. The first occurrence is highlighted in grey.
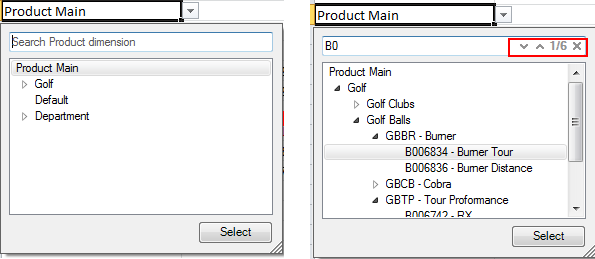
Search functionality uses wildcard criteria. This means that, for example, if you search on a member name '10', '10' will be returned along with '108', 100067', and so on.
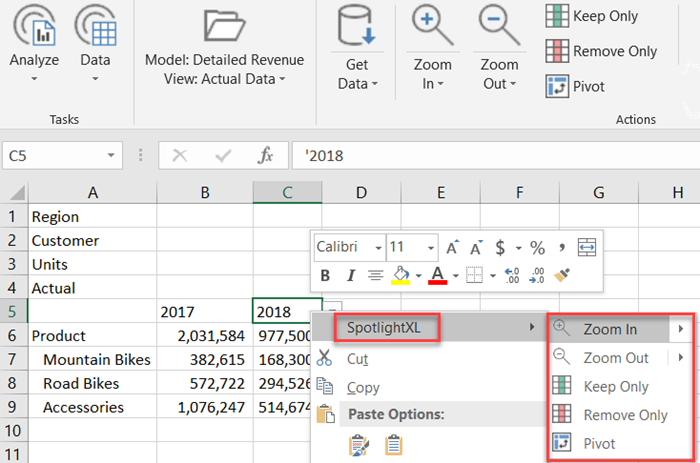
Secondary-Click Menu
In SpotlightXL, when using or designing views, you can use a right-click (for right-handed users) or left-click (for left-handed users) on your mouse to see a popup SpotlightXL menu. Using this menu, you can quickly lay out and place dimensions and data cells where you want them.
In a View, select a dimension member cell and press the secondary mouse button. The normal Excel popup menu appears, and you see a new SpotlightXL item at the top of the menu. It expands to show a submenu of Zoom In, Zoom Out, Keep Only, Remove Only, and Pivot. Zoom In and Zoom Out expand further to show the same submenu items as are on the main menu ribbon.
Use Drag and Drop, Zoom, and Pivot to Analyze Data
In this example, the drag and drop feature is used along with Zoom In and Pivot actions.
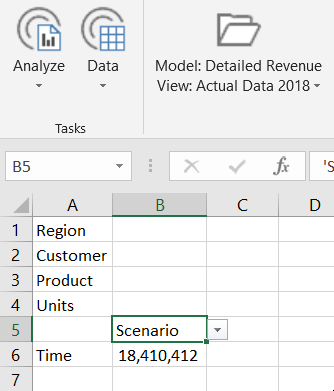
Select the Product dimension and drag and drop it on to Scenario.
Select the Product cell and click the Zoom In action.
Click Pivot.
Zooming In to Children, Leaves, and All Children
When navigating data within Views, Zooming In lets you view additional detail for the parent member selected.
Tip:
to ensure that you see the parent-child relationships of your data, ensure that your View is saved with the property Indent Row Members set to Yes.
Zooming In one level to Children is the default.
Additionally, if you want to Zoom In and specify how and where to place the parent members, click More Options. From the Zoom Options box, you can combine options to lay out the view precisely.

Retaining or Not Retaining the Parent with Zoom In
Zoom In offers the ability to keep the parent members as part of the view or remove the parent members from the view.
Under Zoom In, More Options, the second section lets you remove the parent members with None.
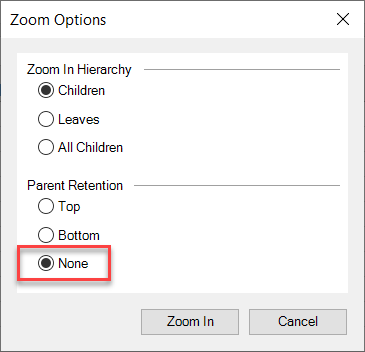
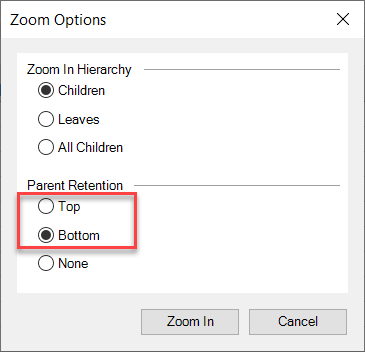
Moving the Dimension Parent to the Bottom of the View
Zoom In offers the ability to keep the parent members above their children, or move the parent members below the children. Placing parent members below the children offers the ability to have subtotals and totals below the details in your views and subsequent reports.
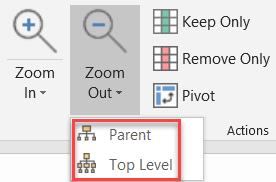
Zooming Out to Parent or Top Level
When you Zoom Out from a member, you have the option to zoom out to the Parent, or go all the way back to the Top Level (the top or root of the dimension, or the topmost member in the dimension that you have access to).
The default behavior is to zoom out to the parent of the selected member. However, to zoom all the way out to the highest level of the dimension quickly, select Top Level.
Note:
You cannot zoom out to the Root if the root dimension member is a Hidden member.
Use Drill Through in a View
This action displays detail data for Master models loaded to Dynamic Planning through Planful Structured Planning, Consolidation, and Reporting applications or from an external data source. All users, regardless of access privileges, can drill through detail data exposing read-only detailed information.
To drill through:
Select the Analyze task and the Data subtask.
Select a model and a view.
Select one or more data cells for which you want to view detail-level information.
Click Drill Through. A new tab is created in Excel called DrillThrough and detail data is displayed.
Click Go Back to return to the view displayed prior to clicking Drill Through.
Drilling Through a View Based on Multiple External Source Models
When you perform a drill through on a view which retrieves data from multiple ESM (External Source Model) source models, the data displayed in the drill through report is shown based on the dimensions that match for the aggregated cell level data within the source ESM model’s dimensions and maps.
Upon drill through, the following may occur based on each situation:
Situation 1 : If multiple source models have matching criteria, one source model will be selected at runtime and will be shown on the drill through screen that may or may not match the aggregated data seen in the view.
Situation 2 : If the user performing the drill through doesn't have access to any of the ESM models serving the data to the data intersection on which the user is performing the drill through, the user will see other relevant ESM models on which that user has access to and that matches the criteria. An example is provided below.
User A - Has permission to access an Analytic Model (named Model A) and ESM Models (named E1, E2, and E3)
User B - Has permission to access Analytic Model (named Model A) and ESM Models (E1 and E2 but not E3)
If user A loads the data to analytic model A from ESM models E1,E2,E3 and user B tries to perform a drill through operation on the data coming from ESM model E3, user B will see the data from either E1/E2 that matches the dimension intersection criteria.
Understanding Excel Formulas in Views
For a model view, the values that result from an Excel formula are saved, although, the formula itself is not saved.
For instance, in the example below, cell B6 is 13,367.
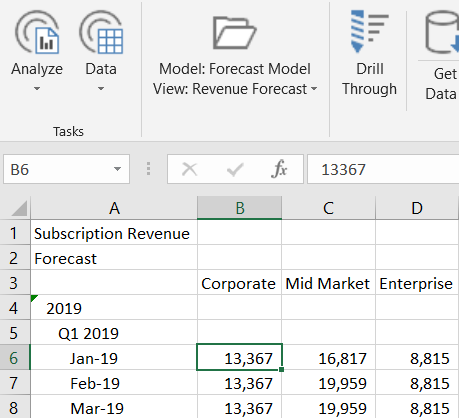
Now, an Excel formula is added to this cell as shown below.
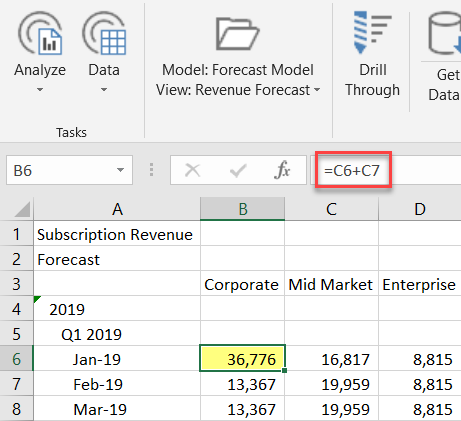
Once saved, the resulting value is displayed, which is 36,776. The formula (=C6+C7) is not.
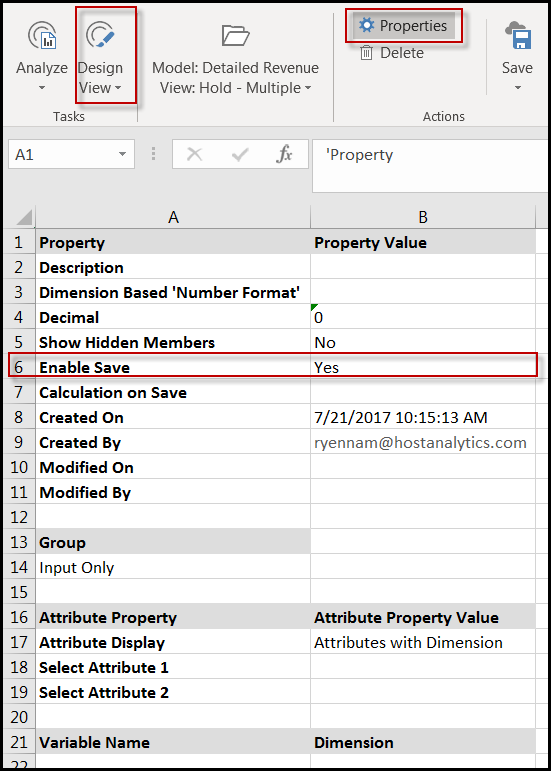
To save values that result from Excel formulas, View Properties (accessed by selecting the Analyze task and the Design View subtask and then clicking the Properties action) must have Enable Save set to Yes as shown below.
Was this article helpful?