Dynamic Planning Report Design Using Substitution Variables and Expressions
- 10 Minutes to read
- Print
- DarkLight
- PDF
Dynamic Planning Report Design Using Substitution Variables and Expressions
- 10 Minutes to read
- Print
- DarkLight
- PDF
Article summary
Did you find this summary helpful?
Thank you for your feedback
Overview
Substitution variables are used in reports in place of dimension member names. Reports can be defined using substitution variables that can be dynamically modified at runtime by end users, and Power Users and Contributors now have the option to set up reports using substitution variables with expressions.
The substitution variables can be dynamically modified at runtime. Previously, if a report was set up to use a substitution variable, the report would always run with the predefined value of the substitution variable. To change the value, a Power Users or Contributor had to change it manually using the Model > Model Administration > Substitution Variables page.
Any level of user can now change the value of substitution variables while running a report. The new value is used during that session, but the report reverts back to the original substitution variable value the next time the report is run. For example, a Contributor may set up a report with a substitution variable defined as CurMth = January 2017. The end user can change the value to July 2017 when running the report. The next time the report is run, January 2017 is used by default but again can be changed easily at runtime.
Selecting a different dimension member name is available in SpotlightXL and Spotlight.
Power Users and Contributors can set up substitution variables with expressions. Expressions are added to a substitution to derive another member name from the same dimension.
Substitution variables are most commonly used in the Time and Scenario dimensions.
Note:
Changing the value of a substitution variable is similar to the concept of selecting a dimension member from a POV on the page axis. When you change the POV or the value of the substitution variable, the data is refreshed. The difference is that a substitution variable can be placed anywhere in the report, such as a row or column axis.
Here is the overall process:
Power User or Contributor creates one or more substitution variables in the model.
Power User or Contributor creates one or more reports that use the substitution variables.
Any user with access to the report can run it and change the value of the substitution variable, provided they have security access to the dimension.
Creating Substitution Variables for Reports
To set up formatted reports with substitution variables for use at run-time, a Power User or Contributor must first create the substitution variables.
In Practice
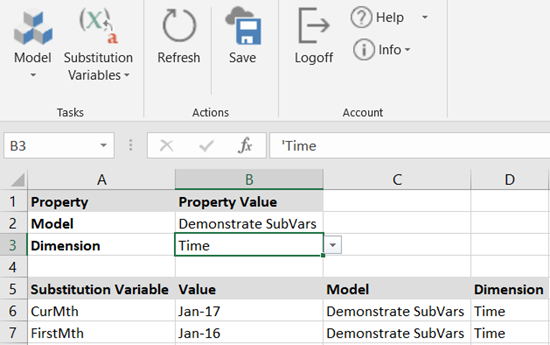
Select Model > Model Administration > Substitution Variables.
Select the model and dimension name from the list boxes.
Tip:You can see a list of all substitution variables created for all models by selecting All Models and All Dimensions from the list boxes.Enter the variable name with plain text. Avoid using the symbol @ in the variable name. For example, CurMth or Current Month. Variable names are case sensitive.
Specify the starting value for this variable. This value must be the same as a dimension member name in your model. For example, Jan-17.
Optionally, specify the model that the variable will be used on.
Optionally, specify the dimension that the variable relates to. For example, Time.
Click Save.
 Note:Substitution variables used in reports are different than variables created for calculations or maps. Always use Model > Model Administration > Substitution Variables to create substitution variables for reports.
If you make a mistake, simply delete the row containing the substitution variable that you created, then click Save to delete it.
Using Substitution Variables in Reports
In Practice: Setting up a report to use one or more substitution variables
Lay out the report with standard items, such as headings, rows, and columns.
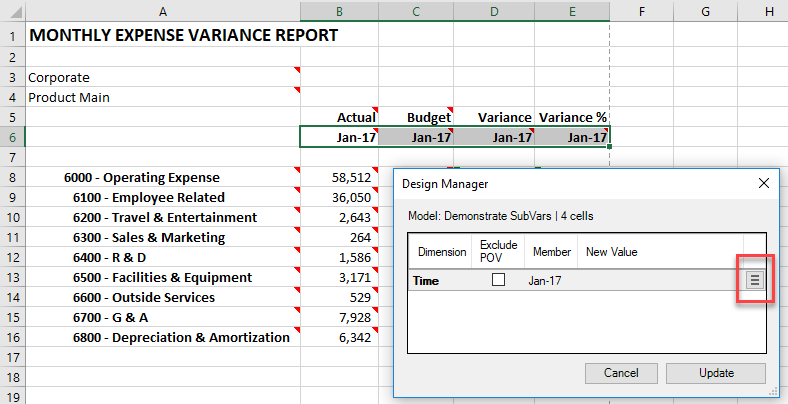
While in Report Design mode, select the cells containing the dimension member to be replaced with a substitution variable.
Click Design Manager. Notice that the current value is a regular dimension member, Jan-2017.
Click the Member Selection icon, then Select Member.
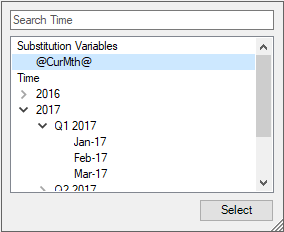
Click Select Member. At the top of the member selection box, notice that Substitution Variables are listed first.
Select @CurMth@ and click Select.
Now the Design Manager reflects the change from the original value (Jan-17) to the Substitution Variable @CurMth@. Also shown in light gray is the predefined value of CurMth.
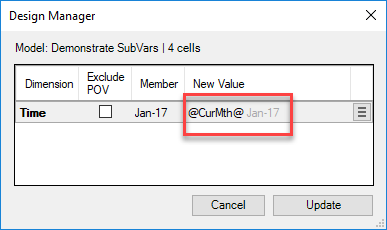
Click Update. The report now displays @CurMth@ in place of the 4 cells you originally selected.
Now you need to update the data cells to also use the substitution variable.
In Practice
Select all the data cells. In this example, columns B and C are data cells, while columns D and E contain Excel formulas.
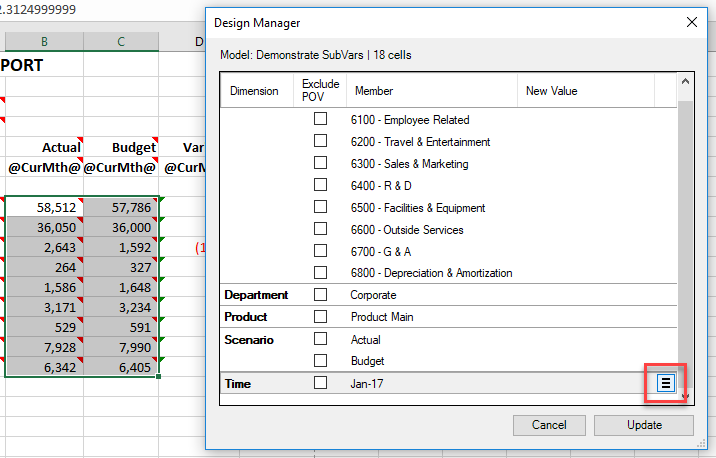
Click Design Manager. Scroll to the Time dimension. Notice that the current value is a regular dimension member, Jan-2017.
Click the Member Selection icon, then Select Member.
Click Select Member. At the top of the member selection box, notice that Substitution Variables are listed first.
Select @CurMth@ and click Select.
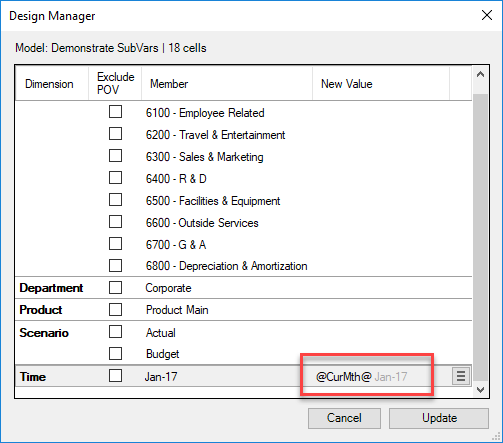
Now the Design Manager reflects the change from the original value (Jan-17) to the Substitution Variable @CurMth@. Also shown in light gray is the predefined value of CurMth.
Click Update. The report now displays UPDATED in place of the data cells you originally selected.
Click Save to save your report.
Selecting a Different Value for a Substitution Variable at Runtime
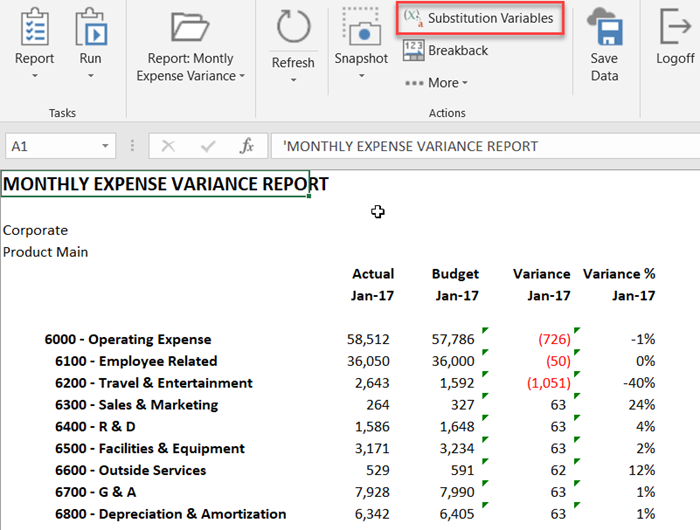
When the end user runs a report, if it contains a substitution variable, a new icon automatically appears on the menu ribbon.
In Practice
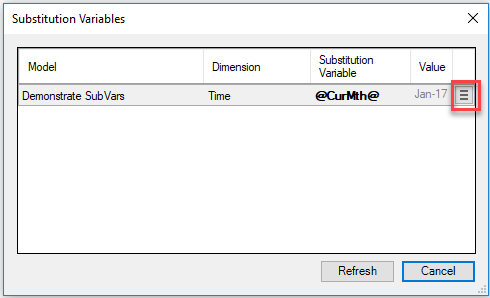
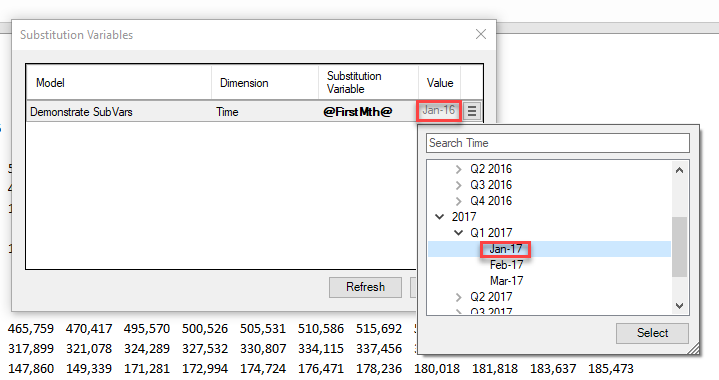
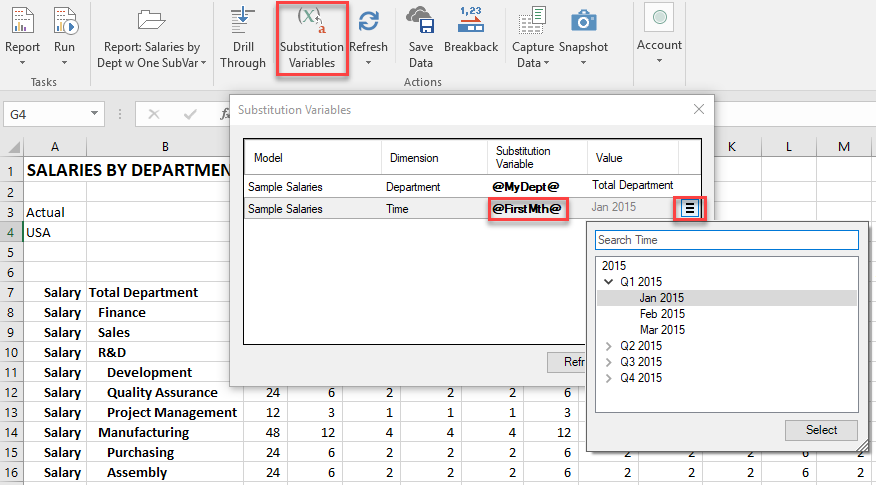
- With the cursor anywhere in the report, click Substitution Variables. The Substitution Variables box appears. It shows the name of the variable and the current value.
- Click the Member Select icon.
- From the member selection box, select the month that you want to see in the report.
- Click Select.
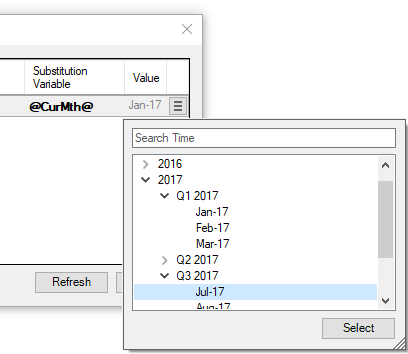
- Click Refresh to refresh the report.
The report now displays data for Jul-17. Using this method, the user can easily move back and forth between months, quarters, or years, without updating the definition of the report and without the need for the Power User or Contributor to update the substitution variable value permanently.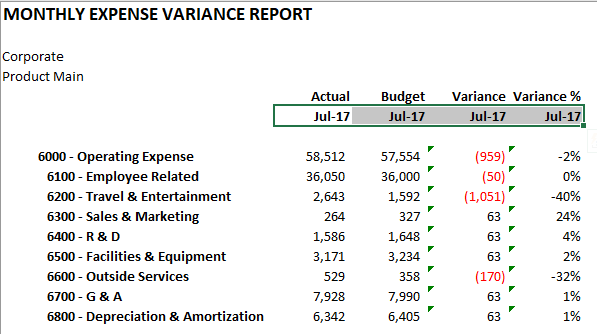
To reset the substitution variable back to its initial value, click Substitution Variables. From the Member Selection icon, select Reset to Default.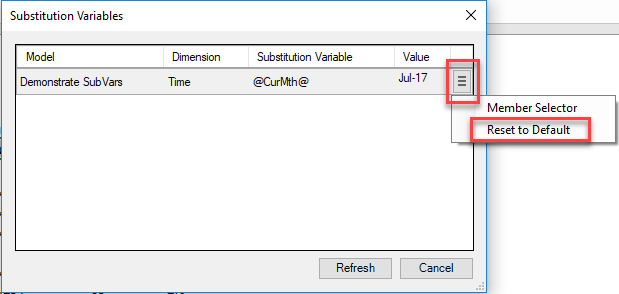
Using Substitution Variables with Expressions
Dynamic Planning supports the ability to enhance substitution variables by providing expressions. Expressions point to different members in the dimension about the predefined value of the substitution variable.
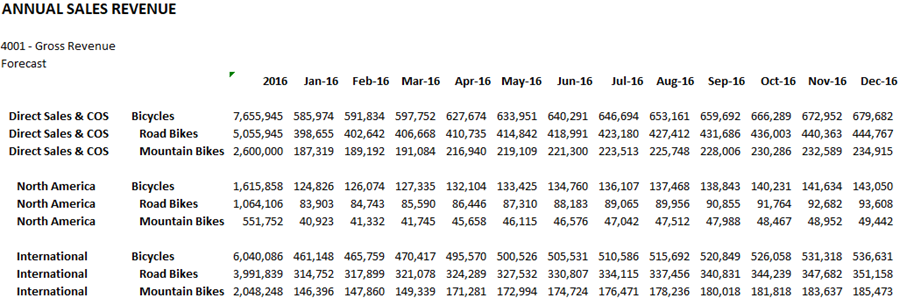
Here is a basic annual revenue report. Expressions will make this report easier to maintain in the coming years.
Define the following substitution variable:
FirstMth = Jan-16
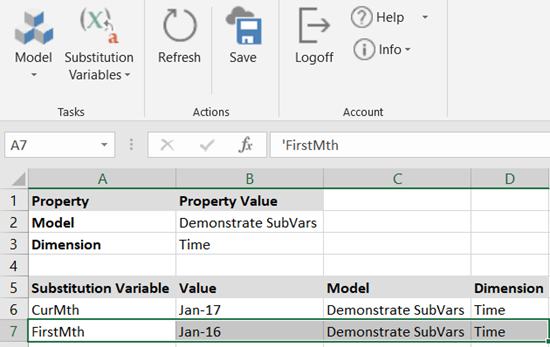
Now go to Report Design to use this variable.
In Practice
Select all the cells in the worksheet.
Click Design Manager.
Each member in the Time dimension will be replaced with a substitution variable or expression.
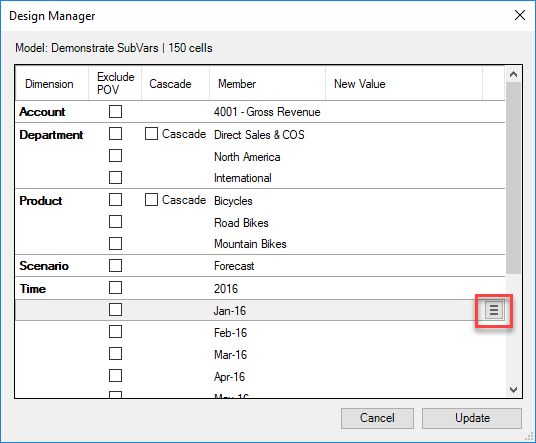
Select Jan-16.
Click the Member Selection icon, then Select Member.
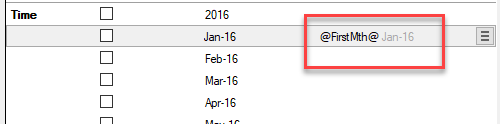
Select @FirstMth@ and click Select. Now the Design Manager reflects the change from the original value (Jan-16) to the Substitution Variable @FirstMth@. Also shown in light gray is the predefined value of FirstMth.
Repeat steps 3-5 for Feb-16.
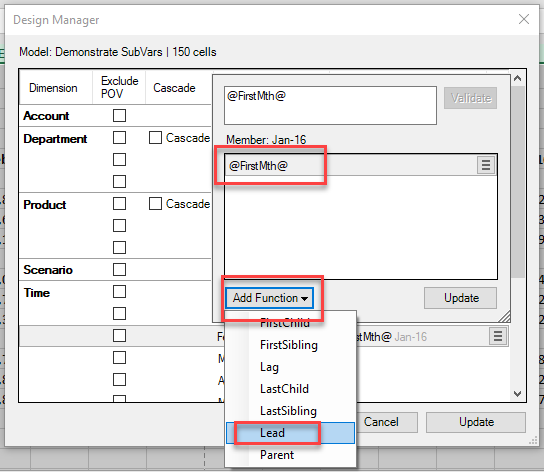
While still on Feb-16, click the Member Selection icon again, then Expression.
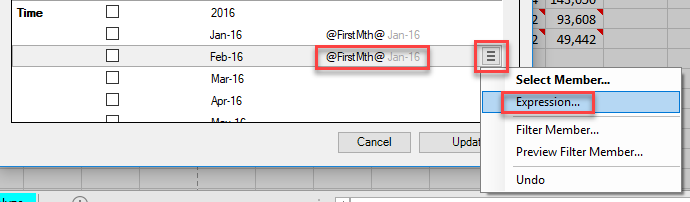
The Expression box appears and FirstMth is already selected.
Click Add Function.
Click Lead.
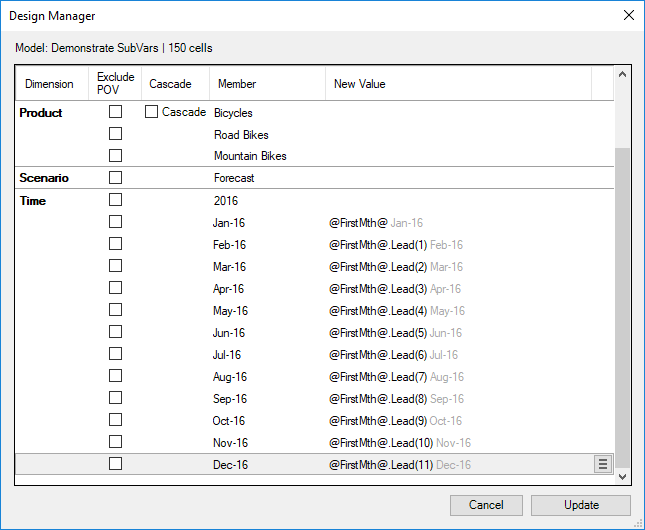
The Expression box now shows the Offset option. By default, the offset is 1. Offset refers to the number of members above or below the current member in the dimension hierarchy. Offset works within the current level and it skips over rollup members.
Lead refers to members below the current member in the hierarchy. For example, Jan-16, Lead(1) points to Feb-16. Lead is equivalent to fetching the next member in the hierarchy within the current level.
Lag refers to members above the current member in the hierarchy. For example, Jan-16, Lag(1) points to Dec-15. Lag is equivalent to fetching the previous member in the hierarchy within the current level.
Click Update to accept Lead(1).
Repeat steps 3-5 and 7-10 for the rest of the months to express all of the months in relation to FirstMth.
For the year 2016, a different expression is needed.
Repeat steps 3-5 for 2016.
While still on 2016, click the Member Selection icon again, then Expression.
The Expression box appears and FirstMth is already selected.
Click Add Function.
Click Parent. The parent of Jan-16 is Q1-16, so we want the parent of the parent to go up 2 levels to 2016. This is done by chaining two expressions together. For more information on chaining expressions, see Expression Chains.
Click Add Function again.
Click Parent. Now you see @FirstMth@.Parent.Parent, and 2016 is displayed to show you what value is returned with this expression.
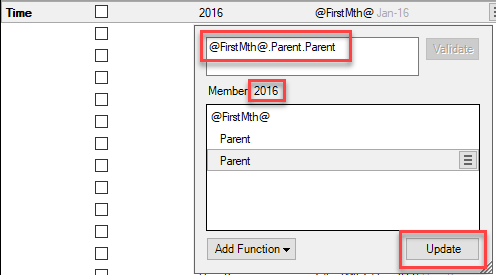
Click Update.
The Time dimension now reflects all members in relation to the substitution variable FirstMth.
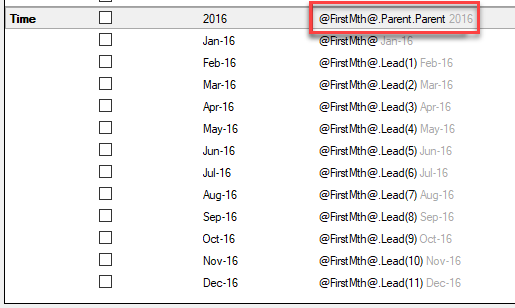
Click Update to save your changes and exit the Design Manager.
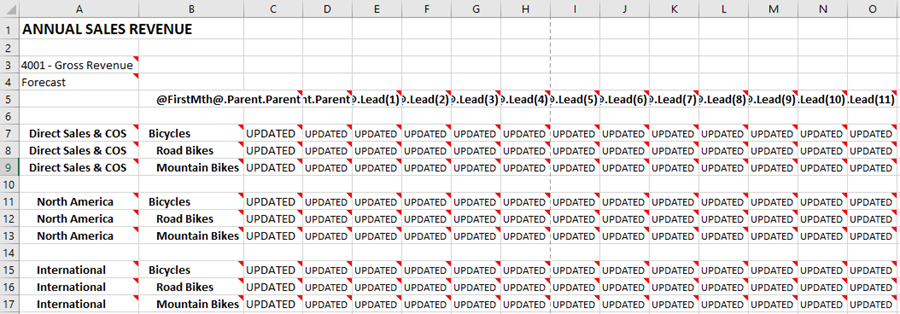
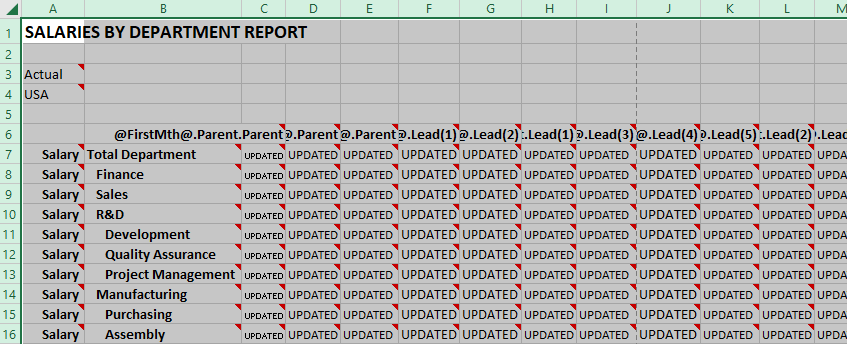
The report now displays UPDATED in place of the data cells, and @FirstMth@ and the expressions in place of the monthly headings.
Save the report design by clicking Save or Save As. Consider changing the name to preserve the original report until you are confident that the new report is accurate.
Now when you run the report, you can use the Substitution Variables box to change the starting value to the first month of any year in your hierarchy.
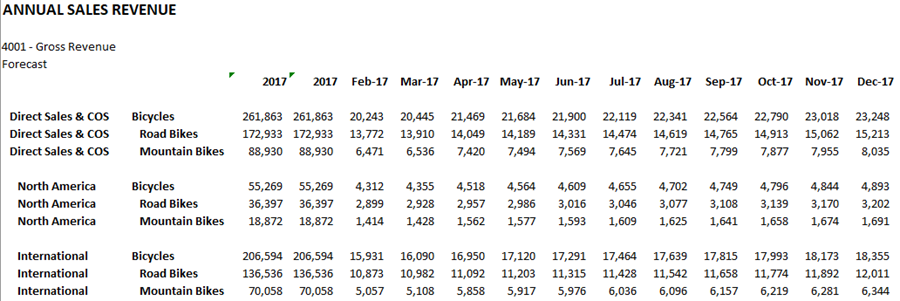
After selecting Jan-17, click Refresh.
Notice that the same report now works for other fiscal years. Users just need to select the first month of the fiscal year and entire report is derived from that substitution variable dynamically. Because of the introduction of expressions, a Power User or Contributor can design reports that are more dynamic in nature. And it will reduce the report maintenance going forward.
Converting Existing Reports with Substitution Variables to Use Expressions
Many existing reports are set up with multiple substitution variables. These reports can be converted to use one substitution variable and many expressions for easier maintenance.
Consider the following model and its current list of substitution variables.
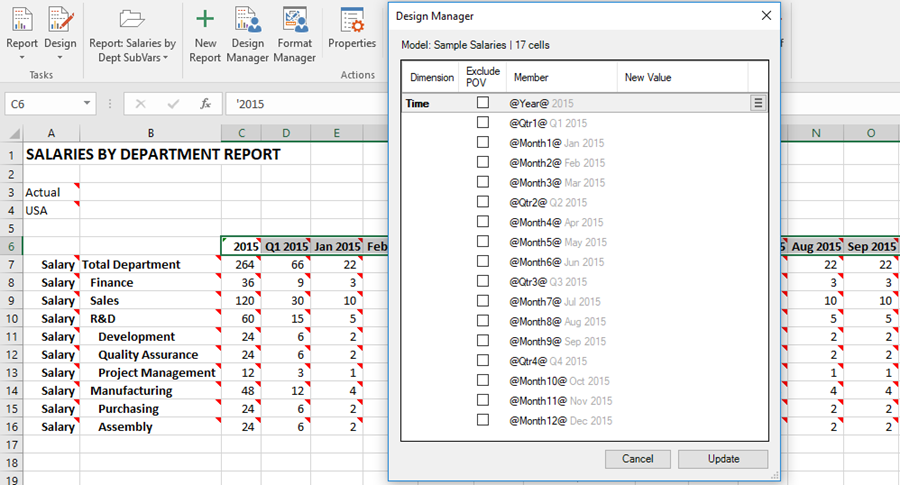
These substitution variables are used in all of the company reports that show data by month, quarter, or year. Below is a report of Salaries by Department. You can see the use of 17 substitution variables in the report.
To convert this report and any other reports to use a single substitution variable, first decide which member should be the starting point that you can create expressions from. For example, if you start with the first month of your fiscal year, then you can use Sibling, Lead, or Lag to offset at the same level to other months. Or go back one level with Parent and use Lead or Lag to offset to quarters, or go back two levels with Parent.Parent and use Lead or Lag to offset to years. Or you can start with the year and use Child expressions to get to the quarters and months.
For this example, we will base all the time entries in the report on the first month of the year. A Power User or Contributor user must create the substitution variable.
In Practice
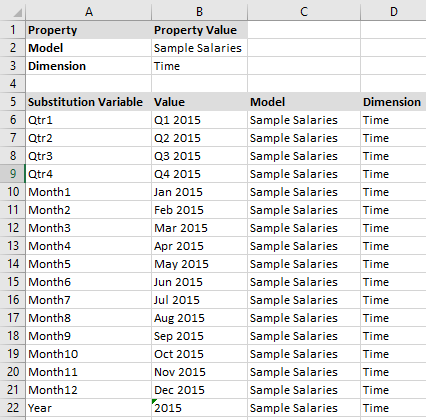
Define the following substitution variable for the model Sample Salaries and the dimension Time:
FirstMth = Jan 2015
Note:All the previous substitution variables defined for this model still exist (those rows are hidden in the screenshot below); you are adding a new one at the bottom. After you convert all your reports over to using just one substitution variable, you can delete all the extraneous substitution variables.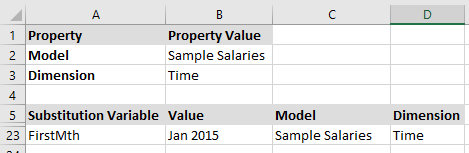
Open the report and go into Design mode.
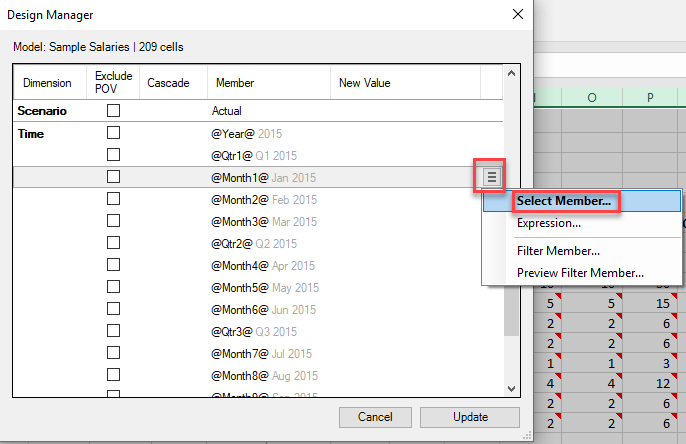
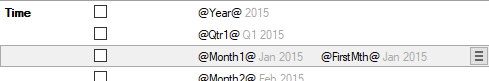
Select all the cells in the worksheet, then click Design Manager. Scroll down to the Time dimension.
Select the @Month1@ variable, which is currently set to Jan 2015.
Click the Member Select button and click Select Member.
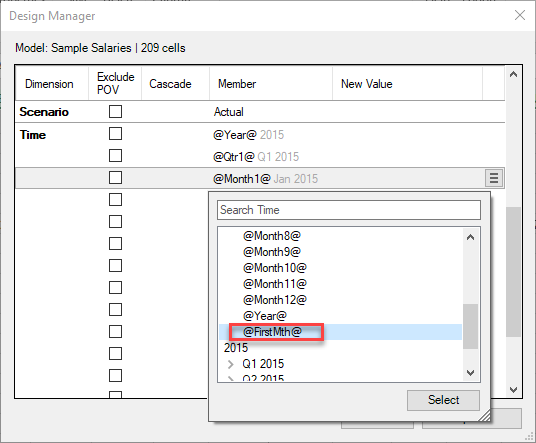
Scroll to find the new variable that you created, FirstMth. Select it and click Select.
The New Value column now shows the @FirstMth@ substitution variable. In grey, Jan 2015 is displayed.
Click Update. The report now displays UPDATED in place of the data cells and @FirstMth@ in place of Jan 2015.
With all the cells in the worksheet still select, click Design Manager again.
Scroll down to the Time dimension and select @Month2@.
Repeat steps 5-6 to replace @Month2@ with @FirstMth@.
Click the Member Select button and click Expression.
Click Add Function and select Lead.
Keep the default Offset of 1, and click Update.
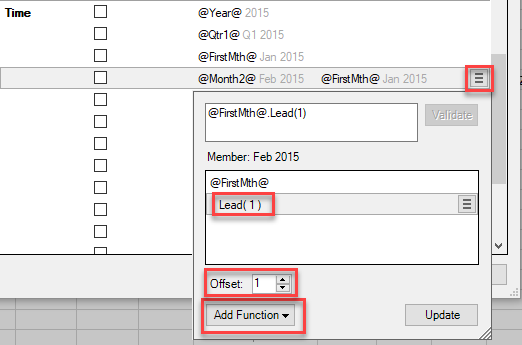
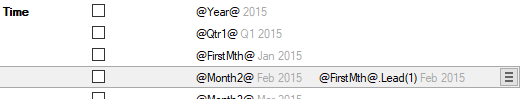
The New Value column now shows the @FirstMth@.Lead(1) substitution variable plus expression. In grey, Feb 2015 is displayed.
Repeat steps 5-6 and 11-12 for the rest of the months, adding one more to the Offset for each subsequent month. Now all the months are expressed in relation to FirstMth.
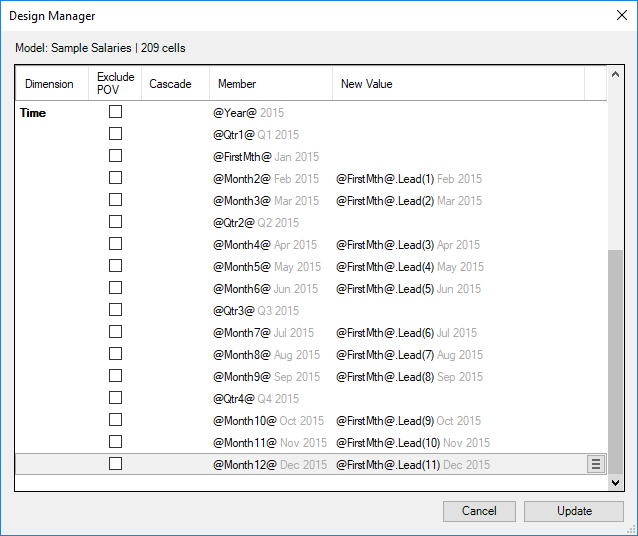
Click Update to insert these changes into the report.
With all the cells in the worksheet still select, click Design Manager again.
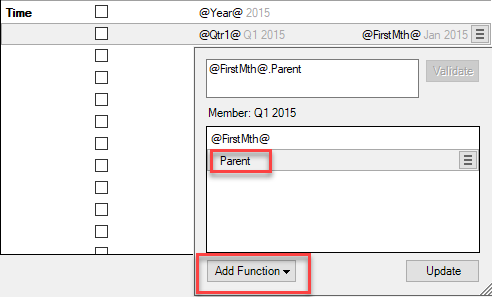
Scroll down to the Time dimension and select @Qtr1@.
Repeat steps 5-6 to replace @Qtr1@ with @FirstMth@.
Click the Member Select button and click Expression.
Click Add Function and select Parent.
Click Update.

Select @Qtr2@.
Repeat steps 5-6 to replace @Qtr2@ with @FirstMth@.
Click the Member Select button and click Expression.
Click Add Function and select Parent.
Click Add Function and select Lead with Offset of 1.
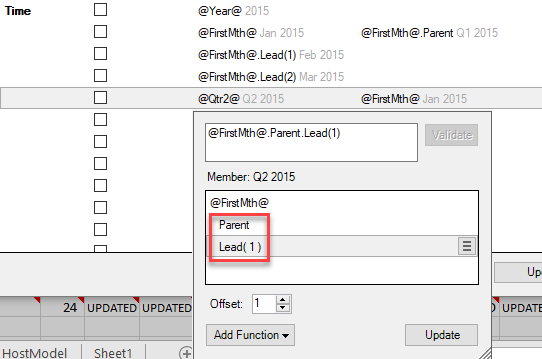
Click Update.
Repeat for the remaining quarters, by creating the following chain expressions for them:
@FirstMth@.Parent.Lead(2) = Q3 2015
@FirstMth@.Parent.Lead(3) = Q4 2015
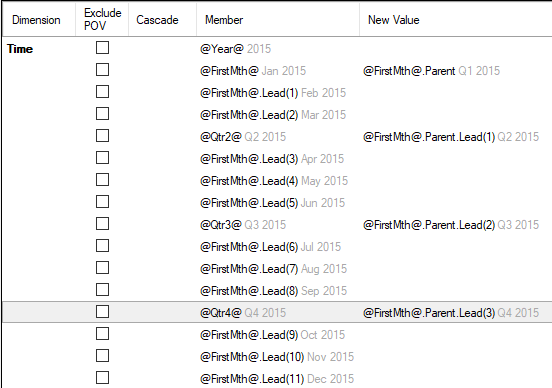
Click Update to insert these changes into the report.
With all the cells in the worksheet still select, click Design Manager again.
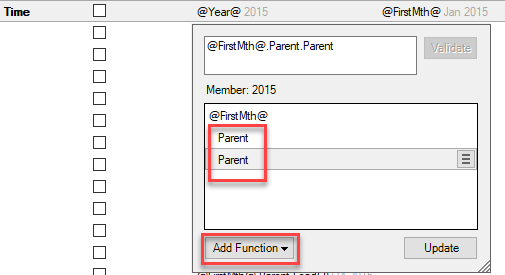
Scroll down to the Time dimension and select @Year@.
Repeat steps 5-6 to replace @Year@ with @FirstMth@.
Click the Member Select button and click Expression.
Click Add Function and select Parent.
Again, click Add Function and select Parent.
Click Update.

Click Update to insert these changes into the report.
Now save the report design by clicking Save or Save As. Consider changing the name to preserve the original report with multiple substitution variables until you are confident that the new report is accurate.
Compare the data to your original report to ensure it is accurate.
Click Run to go into Run mode.
When running the report, now you can click the Substitution Variables button on the ribbon to change the FirstMth variable to the first month of any year.
Was this article helpful?