How to Create and Modify Dynamic Reports Summary
- 10 Minutes to read
- Print
- DarkLight
- PDF
How to Create and Modify Dynamic Reports Summary
- 10 Minutes to read
- Print
- DarkLight
- PDF
Article summary
Did you find this summary helpful?
Thank you for your feedback
Build and Run a Dynamic Report
The information below provides a high-level overview to create a Dynamic Report.
- From the File Cabinet, click the Add list box and select Dynamic Report.
- Select a reporting area, which represents the multidimensional cube upon which the report will be built.
- Drag and drop dimensions for page, row, and column axes to complete the structure or design of your report. Alternatively, use Report Sets on row and column axes.
- Map (associate) dimension members and lock desired dimensions using the Mapped Members pane.
- Select Member Options.
- For Report Sets, use the Member Selector pane to select and lock properties.
- Click Header & Footer to select options (style, color, format) to display header and footer details on your Dynamic Report.
- Drag and drop variables to the Header & Footer fields.
- At this point, you can preview or run the report.
- Manipulate report output by suppressing empty columns or rows, performing pivots, selecting report ranking details, and enabling drill through capabilities.
- Modify formula exception details.
- Enable functions, which you can use to create calculations with assistance, rather than entering them manually in the formula bar.
- Save the report.
If a Dynamic Report in a Report Collection or Financial Package Publisher fails due to concurrent processes running or OLAP connectivity issues, Planful will automatically perform a reprocess. The maximum number of retries allowed is 3. With the Retry option, the chances of getting errors (listed above) is reduced significantly. However, because these reports are re-executed up to 3 times, the overall execution time is increased when errors are encountered.
For detailed information about creating dynamic reports, refer to the Dynamic Reports topic.
Enhanced Drill Through in Dynamic Reports
Note:
You can disable Drill Through functionality for a specific report. See How to Disable Drill Through Functionality.
Drill through functionality in Dynamic Reports is available for:
Financial Reporting Area
Transactions
Translations
Template lines and sublines
Capital details for your budgets and forecasts
Workforce Planning data from GL data
Data Load Rules data
Operational Planning (including Preloaded and Forecast type scenarios)
Consolidation data
From a drill through report, you can view details for a single or multiple templates. All Financial dimensions, the corresponding currency, and amounts for each period are displayed in the drill through report for all modules and templates. Columns displayed in the drill through report are dependent on the module and the template accessed by the user. A Measure column is displayed on Operational Planning, Capital Planning, Workforce Planning, Translations, Consolidation, and GL Data Load tabs. Source dimensions are displayed for Translations and dates are displayed for Transactions. Budget Entity, Template Lines, Sublines, Notes are displayed in drill through for Planning templates. Empty columns are suppressed.
All values displayed in a drill through report inherit data format (decimals, thousand separators, scale etc.) from their parent cell.
Calculated members, calculations, advanced rules, excel formulas, formula exceptions, rank, pivot are not supported in drill through reports.
Note:
This functionality is enabled by default for all new and existing customers.
For detailed information about creating dynamic reports, refer to the Dynamic Reports topic.
Template Notes in Dynamic Reports
Display template notes for members in a Dynamic Report. The advantage of this feature is the ability to see notes recorded in a template within the Dynamic Report interface and output. For example, a user can make a note in a template that a department will gain a certain amount in funding or gain a headcount in the coming quarter. This information is important when reporting on the department budget. So, displaying notes like this provides pertinent information in reports without having to open the template in the Planning Control Panel.
Notes entered in the template are displayed in a Dynamic Report only after the template is opened and saved at least once from the Budget Control Panel. Or, if the Simulation Engine is run for the template.
Time and Reporting dimensions allow rollup members, however, all other dimensions have to be leaf members for notes to be rendered in a Dynamic Report. When you drill down on a rollup member, you will see the notes associated with the leaf members under the rollup member.
How to Display Template Notes in a Dynamic Report
Open the Dynamic Report.
Click the More listbox.
Select Show Notes. You can also select Hide Notes to hide them from display.
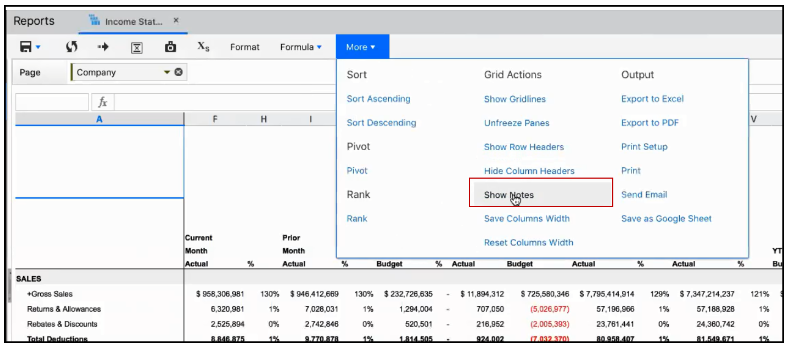
Once you click Show Notes, a Notes column is displayed on the report and notes are displayed for each line in the report. Notes are always vertically bottom aligned like the other cells in the report.
A date/time stamp with user name is added to the beginning of each note. The date/time stamp format is applied based on user location and language settings. The maximum number of characters displayed in the notes field is 1024, which includes that username and date/time stamp.
Notes are aggregated and displayed when coming from several sources. For example, notes sourced from multiple templates for the account and scenario combination. Consolidation happens for multiple scenarios, companies, departments, and so on for the page or column axis for leaf members in the hierarchy.
Notes are retained when running a Dynamic Report in a Report Collection or Financial Package Publisher. Notes are also retained when the Dynamic Report is sent in an email or exported and when you save a snapshot of a Dynamic Report.
Note:
Running a Dynamic Report with notes may impact performance.
Notes are not time bound. For example, if a scenario’s duration is Jan 17 to Jan 19, but the time selected in the report is Dec 16, notes are till displayed for these lines even though data does not exist on those scenarios for Dec 16.
If you suppress empty rows/columns, corresponding notes are also suppressed. Similarly, if the report line does not have any data, notes are also not displayed for those lines.
Note:
Notes are supported for Financial and Financial Snapshot Reporting Areas only.
Modify the Look and Feel of Dynamic Report Output
The information below provides details on how to modify the design of Dynamic Report output as the design of reports consumed (or data pulled) into a Dynamic Report is based on the original report setup.
In Practice
Let’s say you have a report set called Net Income in your Dynamic Report. Net Income displays in your Dynamic Report with a purple background, which you don't like. To change the color of the output, in this case, open and edit the Report Set. To do so:
Navigate to the File Cabinet and locate the Report Set (in this case it is called Income Statement Base).
Select the checkbox next to Income Statement Base and click Setup.
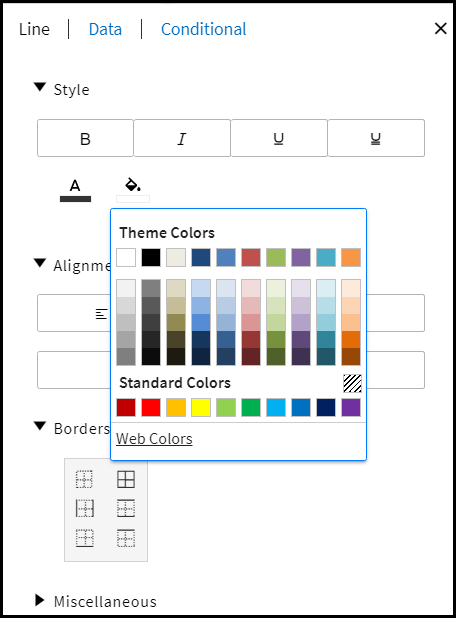
On the Report Set Setup page, select the line and click Format.
Select a different Background Color.
Click Save. Return to the Dynamic Report and click Run. Net Income will now have a new background color.
Exporting Dynamic Reports Output in Unprotected View
Use unprotected view to edit exported Dynamic Reports. Complete the following steps to export your reports in unprotected view:
- Open Microsoft Excel.
- Select File, Options.
- Under Options, select Trust Center in the left pane.
- Click Trust Center Settings.
- Click the Protected View in the left pane of Trust Center window.
- Uncheck Enable Protected View for files originating from the Internet and Enable Protected View for files located in potentially unsafe locations options.
- Click OK.
How to Modify a Dynamic Report from the Template Interface Accessed from the Planning Control Panel
A full access user or reporting administrator can access a Dynamic Report linked to a Template from the Planning Control Panel.
A full access user can modify the design of the report (as in the Dynamic Report interface) and save changes made to the Dynamic Report from the Planning Control Panel. Users with read-only or regular user access without edit permission can make changes, but cannot save (or save as) these changes to the report. If an object on the page is locked, a read-only user will not be able to modify member selections for that dimension.
The following modifications can be applied to a Dynamic Report accessed from the Planning Control Panel:
Drag and drop objects from the left pane into the layout area.
Drag and drop objects from the layout area to reorder or remove them.
Make changes to member selections on the page/row/column axes.
Make changes to the header/footer.
Make changes to items such as suppression, format, insert formulas, formula exceptions, rank, sort, charts (if opened), pivot, grid actions, substitution variables values, and pick list.
A full access user or reporting administrator can save the changes back to the original report or perform a Save As.
Note:
Users must have dimension and security access to make the changes in the list above.
When you map Dynamic Reports to Templates and execute the report, the original report selections are replaced on the Scenario and Budget Entity combination segments (if applied to the page) with the selections from the budget templates and entity mappings. These selections are applied from the budget templates/entity mappings only if the dimensions/attributes/attribute hierarchies exist at the page level in the Dynamic Report. However, the selections for Scenario and Budget Entity combinations are not updated automatically in the original Dynamic Report. For all other dimensions/attributes/ attribute hierarchies and objects on the row or column axis, the original report selections are retained when the Dynamic Report is run from the Planning Control Panel.
Note:
You can audit Dynamic Report actions. The audit log is located under Maintenance, Audit, View Audit Log. Select the appropriate application area and proceed by selecting the dates in which you would like to view audit details.
Integrating Dynamic Reports with Financial Package Publisher
Add Dynamic Reports to the Financial Package Publisher from within the Financial Package Publisher interface. Within Financial Package Publisher, select Dynamic Report as the Content Type and select the Dynamic Report you would like to include in the Financial Package Publisher report.
Drilling Capabilities
Drill down – hierarchical drill - expand a line on the report to see data for lower level members in the main/alternate/attribute hierarchy
Drill through – drill on a number into the transactional data or translational details that were loaded with Data Load Rules
In Practice: Drill Down
Time dimension data - For example, if you expand 2017, you can view data for the 4 quarters associated with 2017. If you expand each quarter you can view data for each month.
Variable data - If you expand a variable, such as @CURYR@, you can view data for the 4 quarters associated with the current year variable. You can expand the quarters to view data for each month.
Simple Rule in a Report Set
- For example, you define a line as follows:
sum({4010 - Gross Sales , 4020 - Royalties , 4030 - Indirect Sales , 4100 - Intercompany Sales - Mfg})
You can drill down to view data for 4010, 4020, 4030, and 4100.
Or, let's say you define a line as follows:
sum({@CURMTH@ , @CURMTH-1@ , @CURMTH-2@ , @CURMTH-3@ , @CURMTH-4@})
You can drill down to view data for the current month and the previous 4 months.
Note:
A rule represents data elements in the cube similar to rules created in Excel (similar to cells, rows, and columns). Report Sets are built using rules.
In Practice: Drill Through
You have Net Income on the row and Aug-17 on the column. Click the number and drill to the daily transactional or translations data. This works only if the data was loaded with Data Load Rules.
You have Net Income on the row and @CURMTH@ on the column. Click the number and you can drill to the daily transactional or translations data if loaded via Data Load Rules.
You have Net Income on the row and sum({@CURMTH@ , @CURMTH-1@ , @CURMTH-2@ , @CURMTH-3@ , @CURMTH-4@}). When you drill through, you can view the transactional or translations data for the current month and the previous 4 months.
You have ([Account].&[1068],[Department]. &[101],[Project].&[565]) on the row defined using the Multiple dimension option in Report Sets and MTD on the column. You can drill to the daily transactional or translations data.
Drill-through displays values from the beginning of the year to the current period when YTD or QTD are applied.
Values displayed in the drill-through pop-up window are applicable for all periods, from either the beginning of the current fiscal year or the period selected during report design. For example, if current month is set to September, drill-through displays the values from January until September if YTD is the Measure applied.
The columns for transactional or translation drill through data can be sorted in the pop-up window.
Note:
Drill through will work if both the row and column use simple rule definitions. If multi-dimensional rules are defined using the Advanced Rule page, the system will not automatically translate the rule to a simple rule definition, and drill through is not opened until you manually convert the advanced rules into simple rules.
Was this article helpful?