Dynamic Planning How to Filter Members Using Design Manager
- 2 Minutes to read
- Print
- DarkLight
- PDF
Dynamic Planning How to Filter Members Using Design Manager
- 2 Minutes to read
- Print
- DarkLight
- PDF
Article summary
Did you find this summary helpful?
Thank you for your feedback
Filtering member options is helpful when updating an existing report, finding specific report dimension members, and previewing members you might filter.
Filter Member
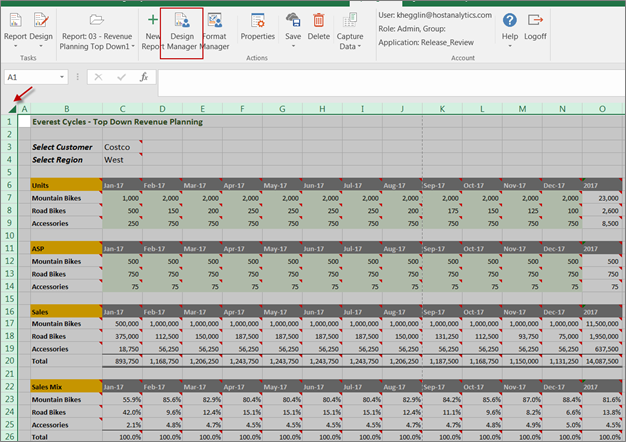
To use Filter Member, open a report in design mode by selecting the Report task and the Design subtask.
Select the entire spreadsheet as shown below and click Design Manager.
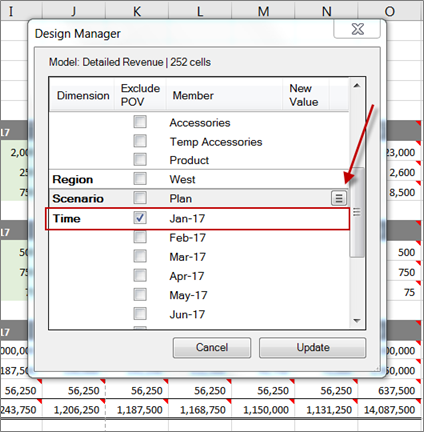
Select a dimension member to filter. In this case Jan 17 is selected (show below).
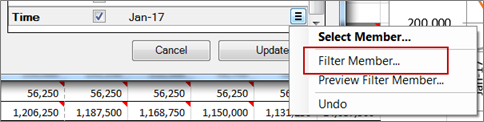
Now, select Filter Member as shown below.
The result is that the Jan 17 member filtered is selected in the design manager and is also highlighted within the spreadsheet as shown below.
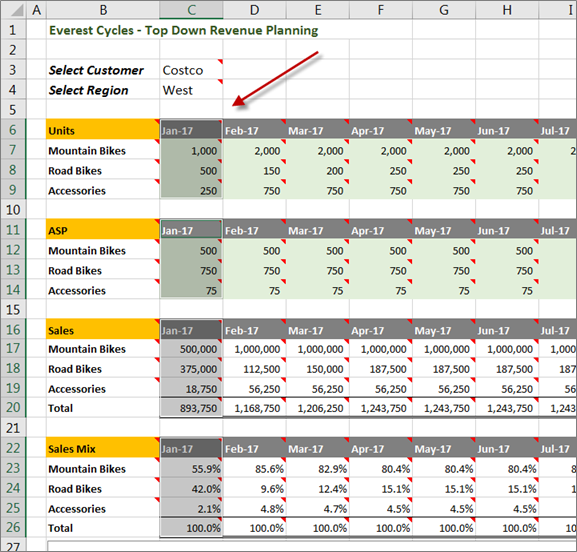
If you would like to make any changes to the report and you want to select only a specific member from the report design and then make the change, in this example Jan-17 this new ‘Filter Member’ option will be very helpful.
Preview Filter Member
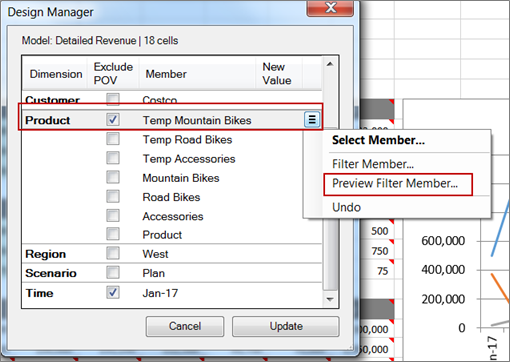
To use Preview Filter Member, open a report in design mode by selecting the Report task and the Design subtask. Select the entire spreadsheet and click Design Manager. Select a dimension member you want to preview prior to filtering. In this case, the Temp Mountain Bikes is selected along with the Preview Filter Member option as shown below.
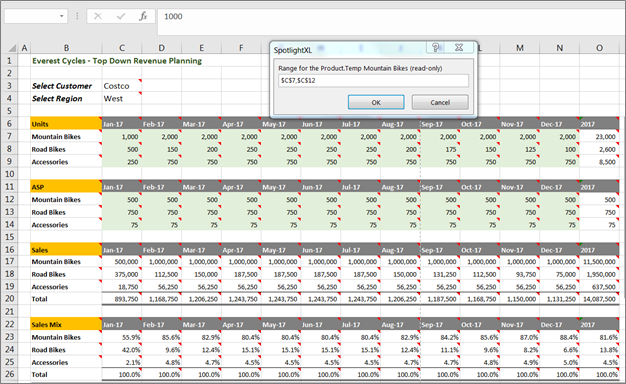
The result is that the cell range is displayed as shown below. This way you know exactly where the member exists within the report.
Use Case
This use case steps you through the process of selecting the Data and Member Design Manager options to populate values within a report.
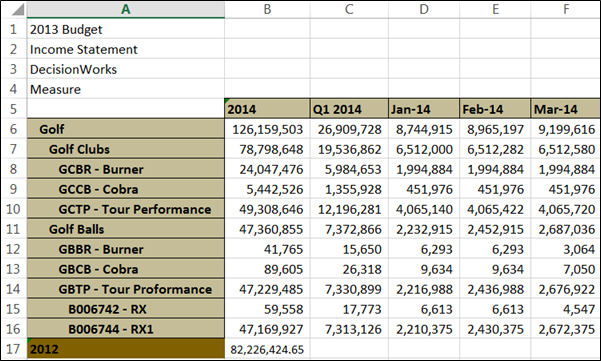
In the use case below, DecisionWorks (a fictional company) has a model called FinanceMaster. A report named Golf Product Report is saved to FinanceMaster. The CFO wants to see how the Golf product line has performed over the past two years by comparing the data in this report with data from 2012 within the same report.
Golf Product Report
Perform the following steps to add a new data intersection to report on income from 2012:
- Select the blank cell (B17) below 2014 data.
- Click Design Manager.
- Select Data.
- Select FinanceMaster as the model. The model
- the report is saved to populates the list box by default.
- Select Golf for Product.
- Select 2012 for Time. The data intersection in this case is where Golf intersects with 2012.
- Click Update.
- Format the cell as needed. For example, currency with no decimals.
- Click Save.
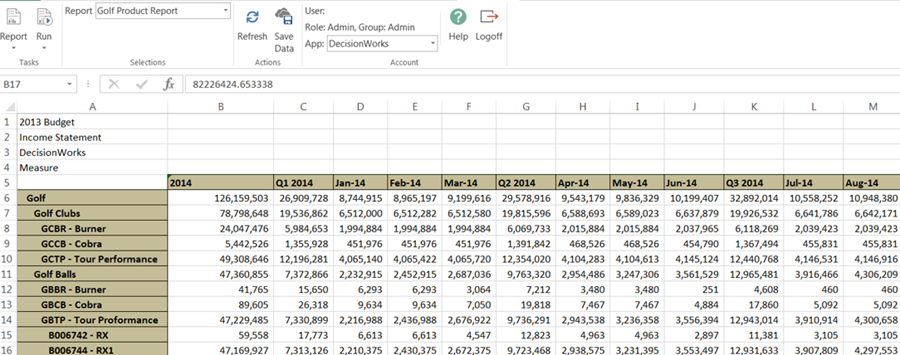
- Select the Run subtask. The result is displayed as shown below.
Next, add the Golf 2012 time dimension member to the report.
- Select the Design subtask.
- Select on the empty cell (A17) to the left of the cell you just populated with data.
- Click Design Manager.
- Select Member.
- The FinanceMaster model is selected by default.
- Select the Time dimension from the Dimension list box.
- Click the search box and select 2012.
- Click Update.
- Save the report.
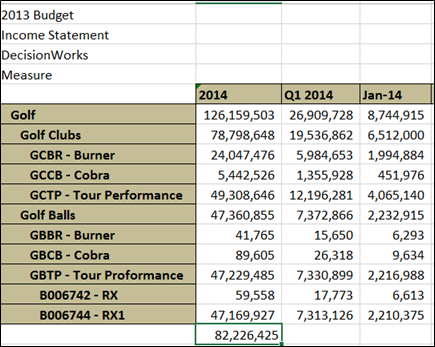
- Select the Run subtask. The result is displayed below. You can format the report by adding background color, interesting rows, and so on.
Create a Report with a Filtered Dimension from Multiple Models
Note:
This is applicable for worksheet-based filters only.
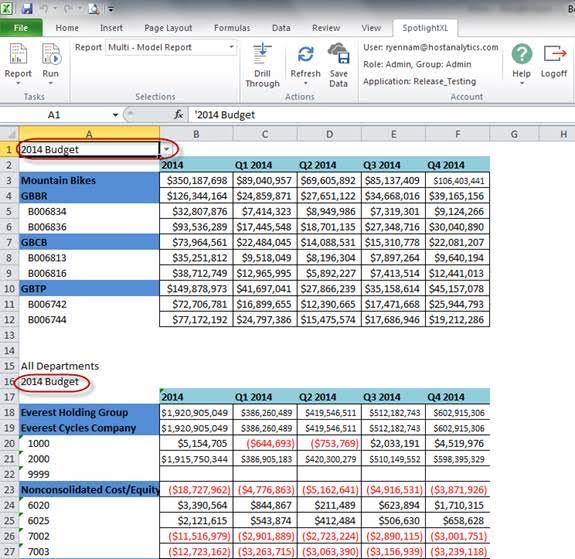
When defining a report that pulls data from multiple models, you can filter dimensions.
The image below shows a report that pulls data from multiple models. To view different dimensional data, select the 2014 Budget list box. Select the dimension and the report is instantly updated.
Was this article helpful?