How to Use Excel Based Formulas
- 2 Minutes to read
- Print
- DarkLight
- PDF
How to Use Excel Based Formulas
- 2 Minutes to read
- Print
- DarkLight
- PDF
Article summary
Did you find this summary helpful?
Thank you for your feedback
Excel Based Formulas
You can write to data intersections that have Excel-based formulas on reports. More simply, when you design a report you can “capture” data intersections, or the combination of dimensional intersections, that define a value on a report. This will ensure that when you run the report it is always referencing the most current data from the database.
Excel-based formulas can be defined on a data intersection previously “captured” for a report. This enables you to manipulate drivers in a model that updates calculated values. For example, you might have units, price, and revenue measures. You can capture all three of these measures to be included in a report. You can then update the report to have revenue calculated as units * price. When a user selects save on the report then the updated value for the data intersection (revenue) will be written to the database and will be the newly retrieved value the next time the report is run.
Use Case
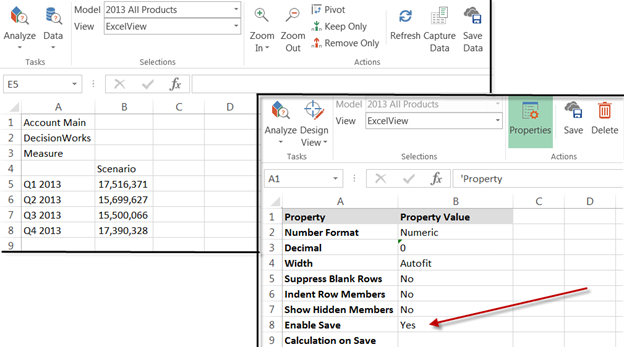
You have a model called 2013 All Products and a view called ExcelView. Enable Save is set to Yes as shown below.
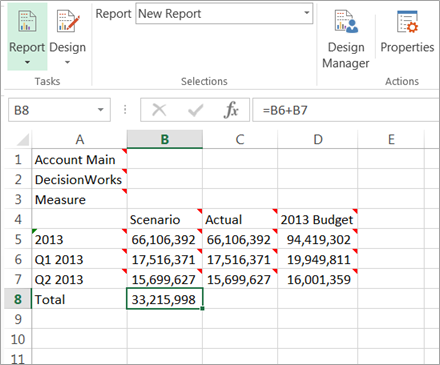
2013 All Products provides information for all 4 quarters of 2013, but you want to display totals for Q1 and Q2. Select Q3 and Q4 2013 and click Remove Only. Select the Scenario cell and double-click to display all scenarios.
Click Save Data.
Select the Design Report subtask to create a report with an Excel formula to report on Q1 and Q2 totals for the scenario.
In cell A8, enter the word Total. In cell B8 enter the following Excel formula: =B6+B7
Click Properties and select 2013 All Products from the Save on Model list box. Click Save. Name the report Excel report.
Note:
You cannot view this report in Spotlight as it has an Excel-based formula.
Select the Run subtask and the report is displayed.
Now that the total for Scenario is displayed, the Total for Actual and 2013 Budget is also needed. Select the Design Report subtask.
Select cell C8 and enter the following formula: =C6+C7
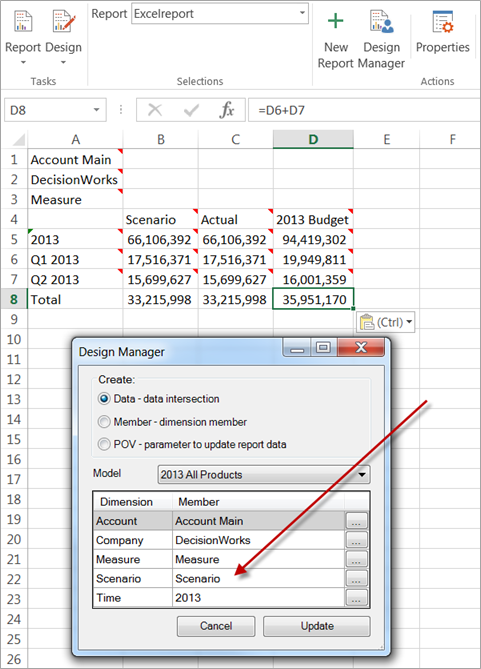
Select cell D8 and enter the following formula: =D6+D7
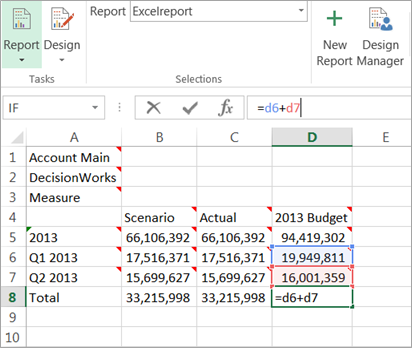
Click Save.
IMPORTANT
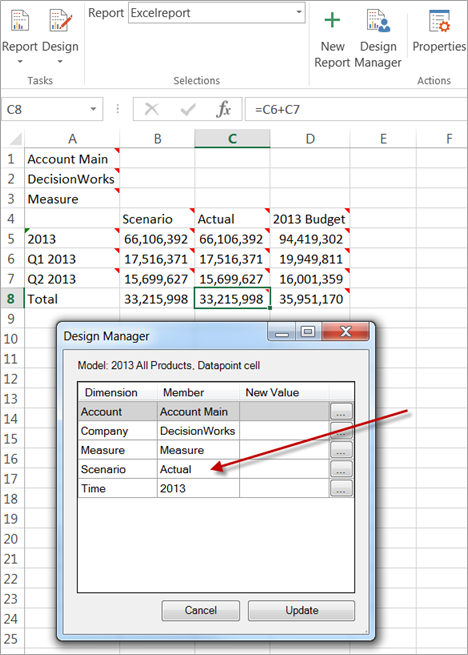
You must manually enter an Excel formula for each cell. Do not copy and paste Excel formula cells as the Member Cell (discussed earlier in these release notes) is not captured. An example is provided below.
Select cell C8 and click Design Manager. As shown below, the Member Cell, Actual is properly captured.
Let’s say you used copy and paste. You copy cell B8 and the underlying Excel formula to cells C8 and D9. Now, select cell C8 and click Design Manager. Notice the scenario is incorrect because the Member Cell is not captured in the copy and paste. It should be the 2013 Budget versus the Scenario.
Was this article helpful?