June 18 Release Notes
- 18 Minutes to read
- Print
- DarkLight
- PDF
June 18 Release Notes
- 18 Minutes to read
- Print
- DarkLight
- PDF
Article summary
Did you find this summary helpful?
Thank you for your feedback
Reporting: Standard Reports
The Standard Reports are available when the enhanced drill through functionality is enabled. These reports MUST be enabled by Host Analytics Support. Once enabled in your application, Admin users must deploy these reports to make them available for users. These reports can be deployed by navigating to Maintenance > Reports > Standard Reports. Select each report, click More, and select Deploy.
The Standard Reports offer an alternative solution to customers using Business Analytics. You can also use the enhanced drill through functionality to report on data, such as sublines. The Standard Reports are available when the enhanced drill through functionality is enabled. If you are not a Business Analytics customer, you can still take advantage of the reports and enhanced drill through functionality.
The Standard Reports are:
Budgeted Data
Capital Budget by Scenario
Subline Data
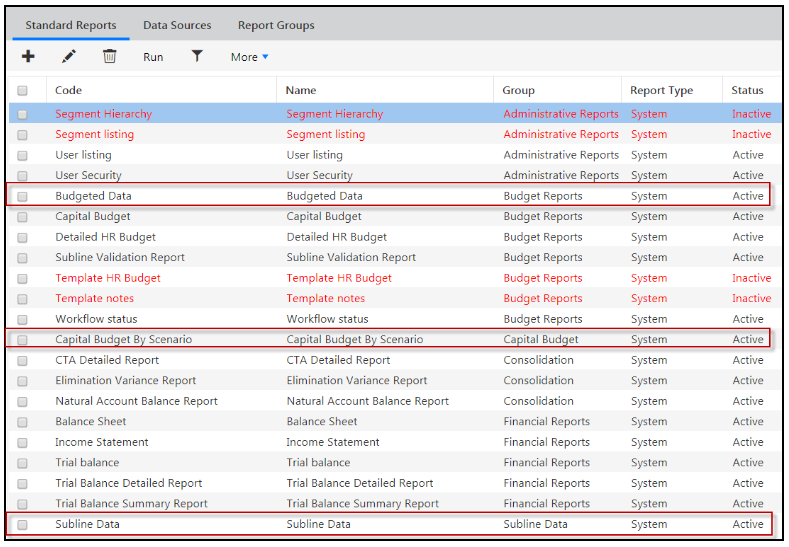
The remainder of this section discusses each of the Standard Reports above as well as information on where you can use them to produce results similar to Business Analytics.
Budgeted Data
Run the Budgeted Data report to report on planned budgets for a scenario and entity. This report provides a comprehensive look at all budgeted data for all templates mapped to an entity. An example of report output is shown below.
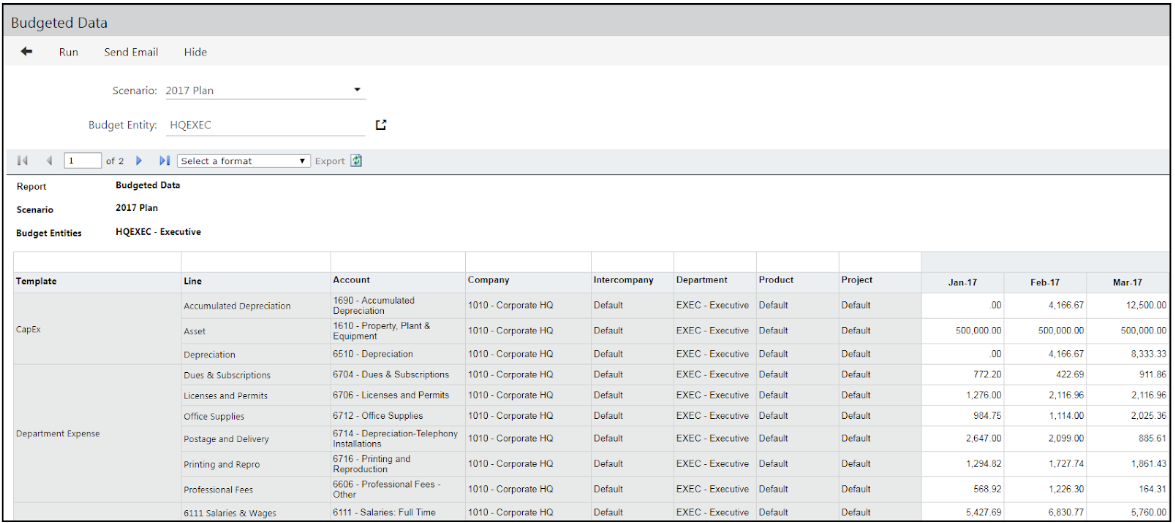
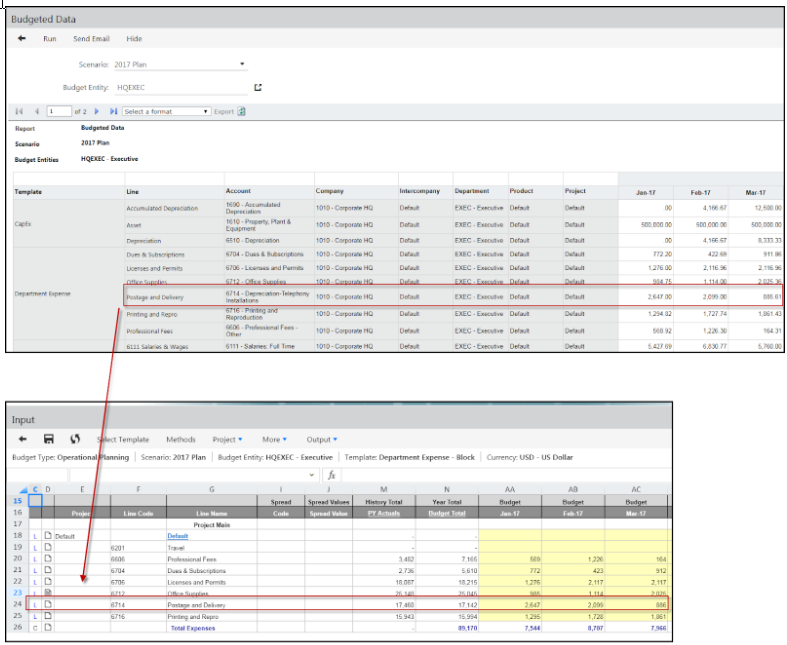
Open a template from the Planning Control Panel for the scenario and entity.
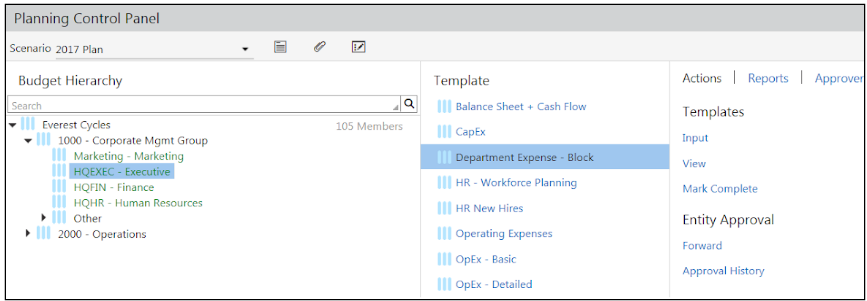
You can see that the Budgeted Expense for Postage and Delivery was pulled from the template mapped to the entity and scenario for which the report was run.
Make sure you deploy the report to make it available in the File Cabinet for users. Optionally, map the report to templates to run from the Template Input interface.
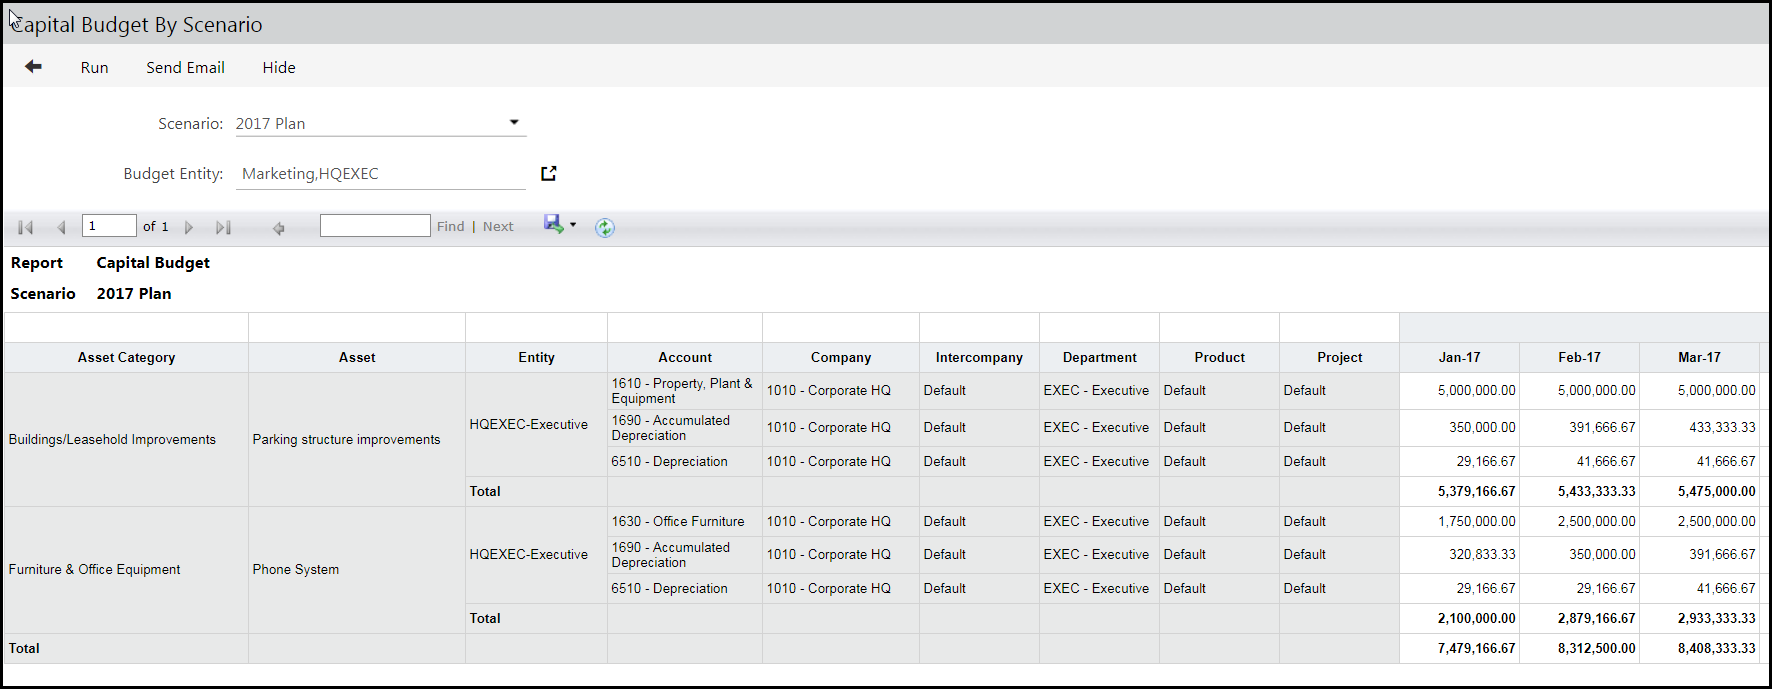
Capital Budget by Scenario
This report provides a comprehensive look at your budgeted data for all Capex items in all templates for a specified scenario and entity.
Here is an example report.
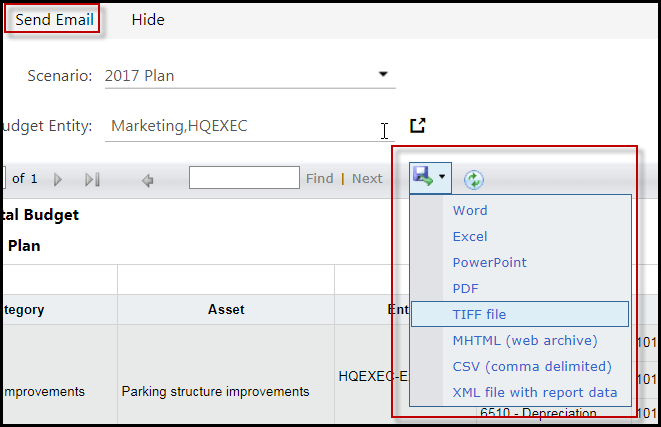
 The report can be emailed or exported in several different formats as shown below.
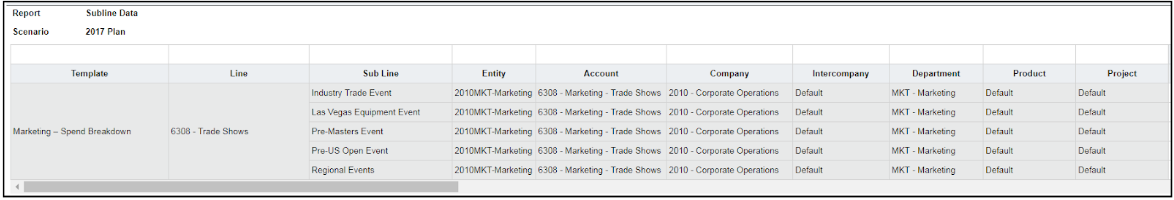
Subline Data
Run the Subline Data report to report on sublines for all templates for a selected scenario and budget entity. You can go into each template and view sublines, but this comprehensive report provides a simpler way to view the data in one central location.
Make sure you deploy the report to make it available in the File Cabinet for users.
Additionally, map the report to templates to run it from the Template Input interface. Mapping reports to templates is done on the template add/edit screen (accessed by navigating to Maintenance > Templates > Template Setup.
In Practice
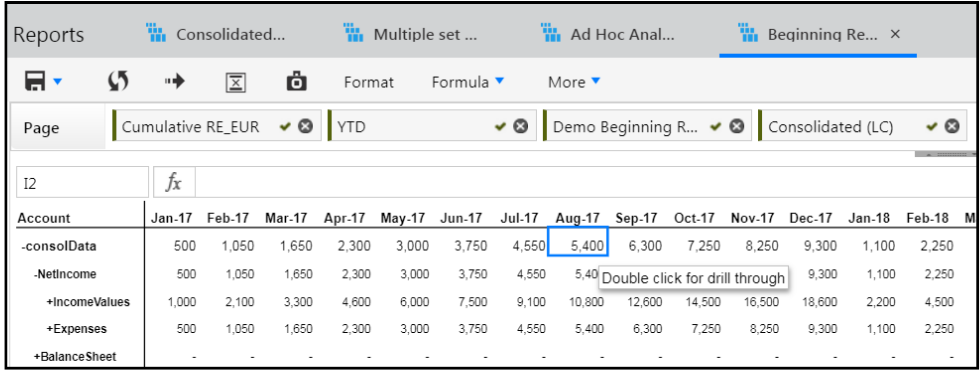
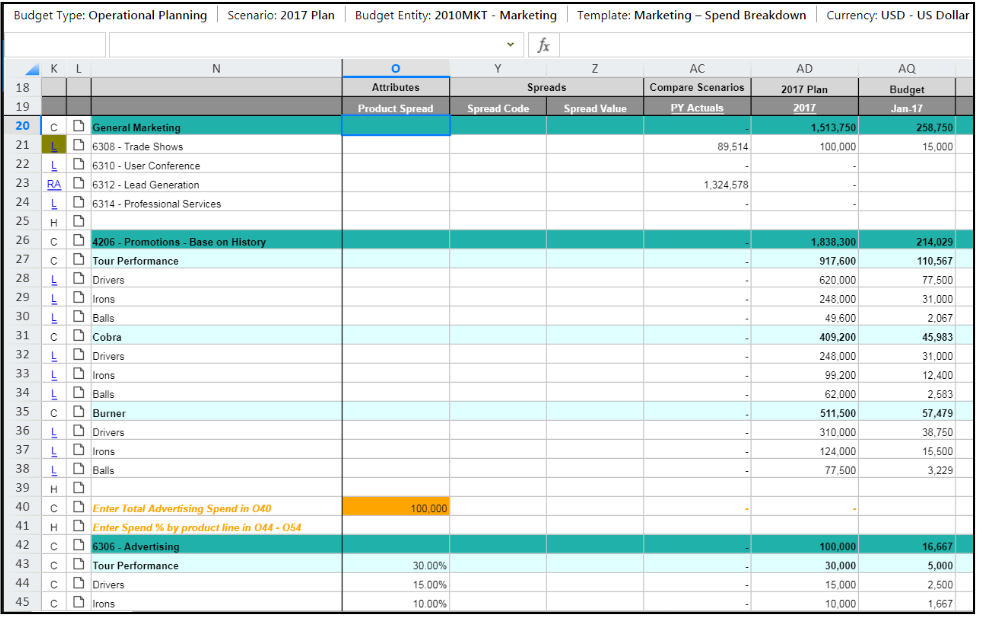
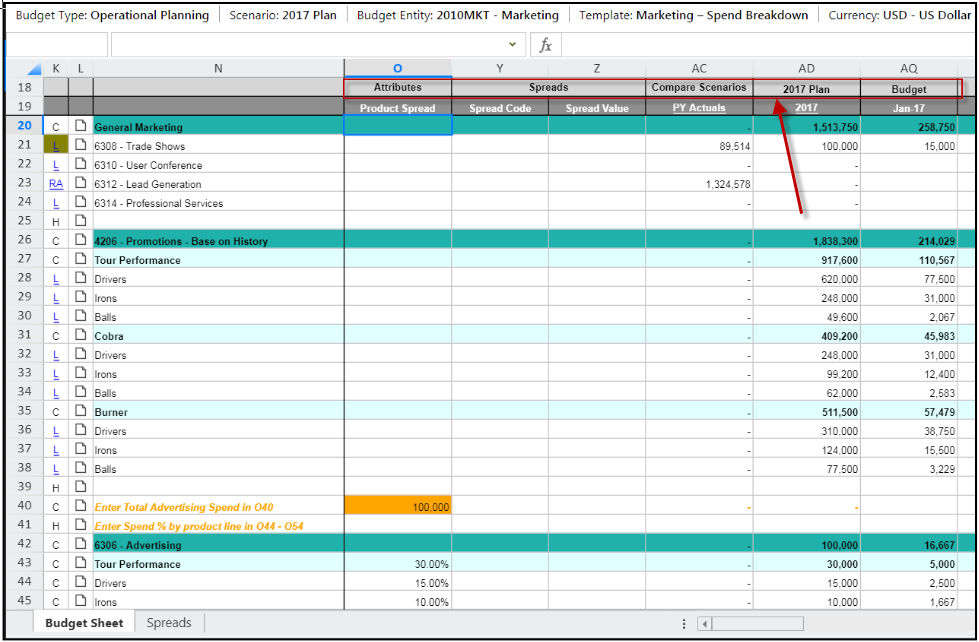
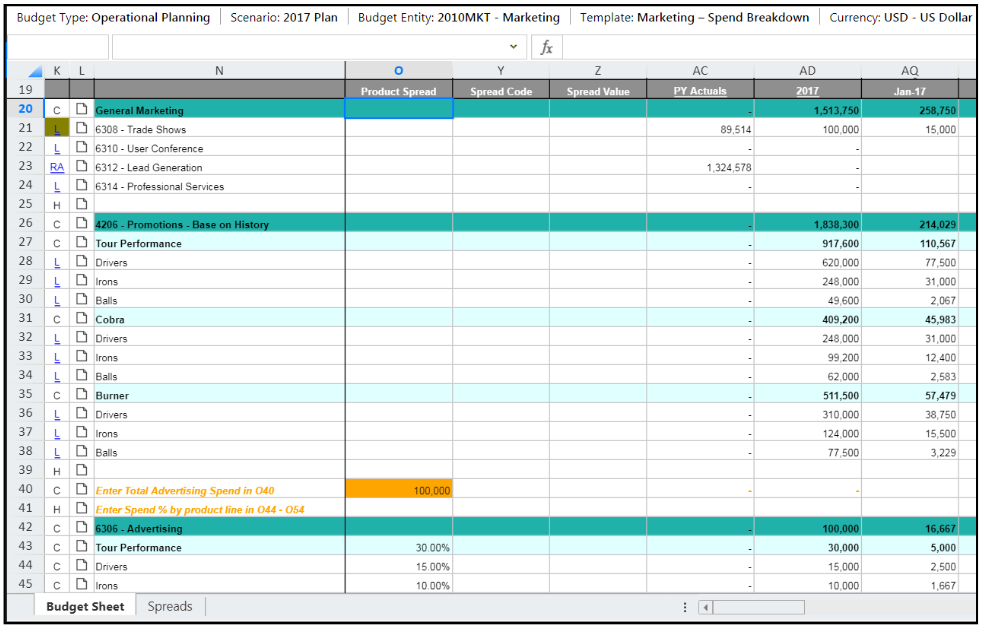
An example Subline Data report is shown below. You can filter by Scenario, Entity, View, and Time. You can view this report by Month, Quarter or Scenario. The report displays sublines for the 6308 Trade Shows account.
If you open a template in the Planning Control Panel for this scenario and budget entity, the 6308 account is displayed in the template and the L is highlighted indicating there is subline data as shown below.
Click L to launch the Subline page where you can see the same data in the report.
Reporting: Enhanced Drill Through in Dynamic Reports
This is an opt-in feature. You must contact Host Analytics Support to enable this feature in your application.
Drill through functionality in Dynamic Reports has been expanded for the Financial Reporting Area. In addition to current drill capabilities to view transactions and translations, we’ve added the ability to drill to template lines, sublines and capital details for your budgets and forecast.
This drill through functionality provides users with the ability to view and analyze all financial, operational, capital, transactional data from a single place.
From a drill through report, you can view details for a single or multiple templates. All Financial dimensions, the corresponding currency, and amounts for each period are displayed in the drill through report for all modules and templates. Columns displayed in the drill through report are dependent on the module and the template accessed by the user. Source dimensions are displayed for Translations and dates are displayed for Transactions. Budget Entity, Template Lines, Sublines, Notes are displayed in drill through for all Global Template Single Copy Planning templates. Empty columns are suppressed.
All values displayed in a drill through report inherit data format (decimals, thousand separators, scale etc.) from their parent cell.
Note:
If you are an existing customer (prior to this release), you must contact Host Analytics Support to enable this feature.
Calculated members, calculations, advanced rules, excel formulas, formula exceptions, rank, pivot are not supported in drill through reports.
The following table displays the artifacts that can be drilled through when used in a Dynamic Report.
Included in June 18 Release | Not Included in June 18 Release | |
|---|---|---|
Scenario Types | Budget Forecast | Preloaded |
Template Types | Global Template Single Copy Global Template Entity Copy Allocation Line Item Block Capital | Detailed HR Refresh Closed Period Actual Data Template Template Based HR Initiatives |
Data Load Rules | Translations Transactions | GL Data |
Others |
| Shared Mode Consolidation Currency Conversions |
Note:
Template attributes are not displayed in the drill-through report.
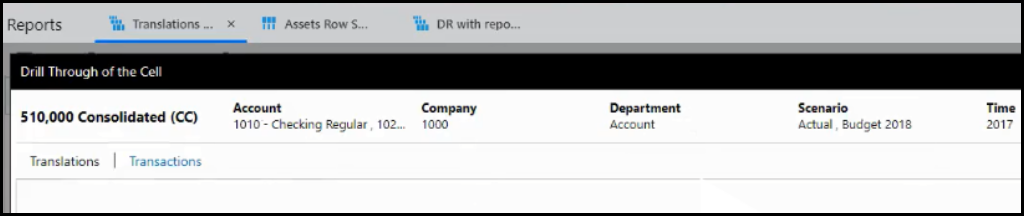
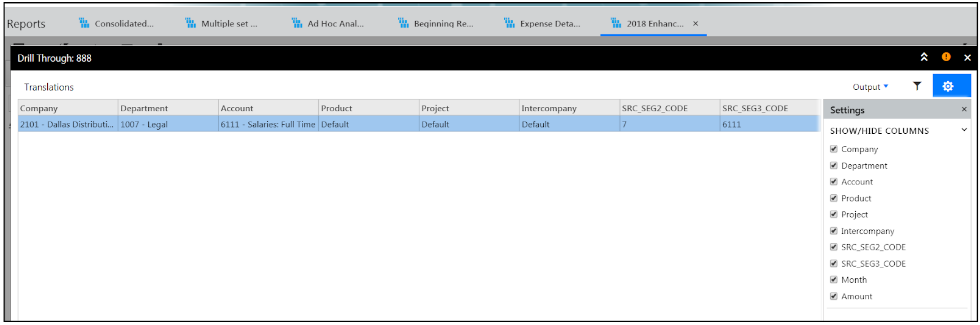
Here is an example of drill through from a Dynamic Report to Translations and Transactions data.
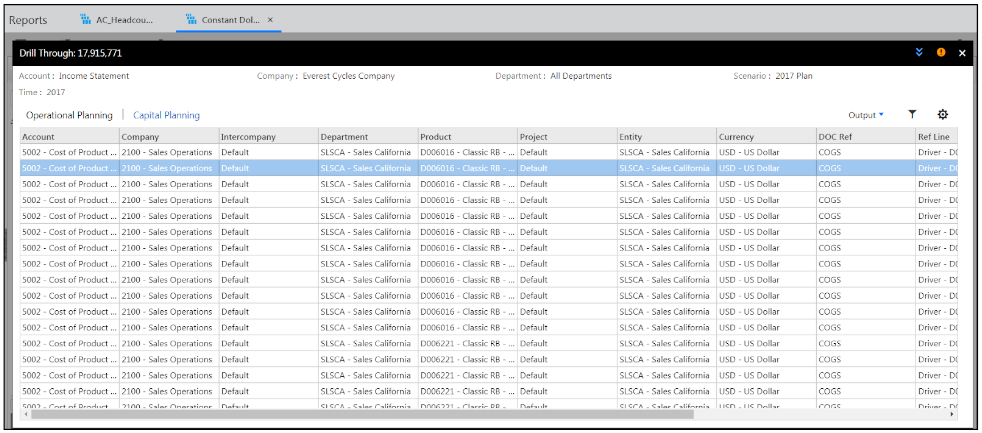
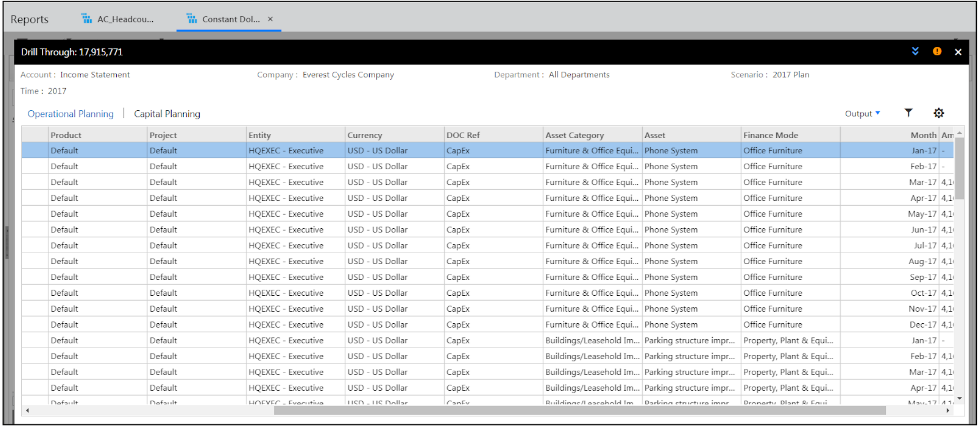
Here is an example of drill through to Planning and Capital template data. Header data is displayed. Click Operational Planning or Capital Planning to display associated data. For Capital Planning, Asset Name and Category data is displayed.
In Practice:
To drill through a Dynamic Report to display template data, complete the following steps:
Access a Dynamic Report.
Double-click on a cell within the Dynamic Report. Another screen appears. The properties of the cell are displayed in the header portion. Data is displayed for the intersection.
The related data for the cell is displayed. Click the Settings icon to select columns to show or hide. Additionally, you can show/hide columns in Operational and Capital Planning where the data will be aggregated based on segment/dimension combinations
Optionally, export the data to Excel by selecting Output > Export to Excel. Filter the data and select the double up or down arrows to display header details.
Important Details:
Drill Through is enabled for Financial reporting area only.
Drill Through works with dimensions, report sets, attributes, attribute hierarchies, alternate hierarchies.
For QTD, YTD measures, drill through data is displayed from the beginning of the period to the current period.
Data honors the formatting from the source cell and the user locale.
All transaction amounts are displayed in Common Currency irrespective of the reporting dimension applied on the report/source cell. Transaction data exists only for Actual Scenarios.
Operational and Capital Planning data is displayed in Local Currency irrespective of the reporting dimension applied on the report/source cell. Operational Planning data exists only for Budget/Forecast scenarios.
In the Operational Planning tab, when you turn off Sublines or Lines, the report is re-rendered, which removes the associated rows and columns associated. If both lines and sublines are turned off, data is aggregated at the Doc Ref (Template) level. If Doc Ref is turned off, data is aggregated for the unique segment and currency combination.
In the Capital Planning tab, when you turn off Asset, the report is re-rendered, which removes the rows and columns associated and the data is aggregated for Asset Category. If Asset and Category are turned off, data is aggregated at the Doc Ref (Template) level. If Doc Ref is turned off, data is aggregated for the unique segment and currency combination.
When you export a drill through report, all sources are exported to Excel. Each source on the drill through report becomes a tab in the Excel workbook.
The Drill Through report allows a maximum of 30K rows per source.
Planning: Template Usability Enhancements
We’re delivering two enhancements with this release for Planning Templates:
Ability to Hide Tabs
You now have the ability to display or hide the tabs for Global Fields and Spreads that appear at the bottom of the Template Input and View screens.
In Practice:
Open a template from the Planning Control Panel in Input or View mode. Select the More list-box and click Hide Tabs..
To return to the original display, select the More list-box and click Show Tabs.
 In the screen below, the tabs are displayed.
In the screen below, the tabs are hidden.
Option to Display or Hide Column Scenario Header Details
Users now have the ability to customize the template display by hiding column header information in the Template Input and View screens. Column headers display information such as scenario name. Admin users can choose to set the display globally (to hide or show) for column headers. If an Admin user hides the display of column headers globally, other users will not be able to see this information. This ability allows Admins to control the information displayed for regular users. If this information is displayed regular users can toggle this information on or off.
In Practice:
Open a template from the Planning Control Panel in Input or View mode. Select the More list-box and click Hide Scenario Header to hide the scenario names at the top of each column.
To return to the original display, select the More list-box and click Show Scenario Header.
An example with column scenario headers displayed is shown below.
An example with column headers hidden is shown below.
Additional User Login Detail Provided in Audit Log
The Audit Log will now capture failed application login attempts. This enhancement provides Admin users with additional user detail.
To view the audit log, click Maintenance > Audit > View Audit Log. Select the User Audit Area and the Application User. Click View Logs to view failed login attempts by the selected user.
Data Integration: Optional Parameter for Sign Reversal in the GLData_Retrieve API
The GLData_Retrieve API retrieves a collection of GLData objects that meet the filter criteria supplied as parameters. Each GLData object returned from this method corresponds to a row of GL data in the database.
With this release, an additional optional parameter has been added to this API. The parameter called ApplyCreditDebit applies a negative sign to credit amounts for all data retrieved when ApplyCreditDebit is set to Yes. Credit type accounts are then stored in the database as a negative (meaning that a credit becomes a debit / negative), but is displayed as a credit / positive in reports.
Note:
Debit accounts typically display data in the same sign as stored in the database.
The benefit of enabling this optional parameter is that the data exported from the GLData_Retrieve API will match the figures (credit/debit) extracted using Export Data.
The default value for ApplyCreditDebit is set to No so that your current configuration behaves as always. In the image below, the sample code shows the ApplyCreditDebit parameter.
GLData_Retrieve API with ApplyCreditDebit:
Description:
When the ApplyCreditDebit option is not specified, the default value is No. This feature is applicable for Credit Accounts only when data is posted with Credit/Debit as Yes in the Data Load Rule.
Case1:
Below is the input/output for the default case, which is when ApplyCreditDebit is set to No.
Input:
<ns:GLData_RetrieveWithLogin>
<ns:LoginName>mborra@hostanalytics.com</ns:LoginName>
<ns:Password>VASavi@61</ns:Password>
<ns:TenantCode>ETLCPMTENANTBASEQFQACopy</ns:TenantCode>
<ns:FilterCollection>
<ns:GLDataFilter>
<ns:Field>FiscalYear</ns:Field>
<ns:FieldOperator>Equals</ns:FieldOperator>
<ns:Value>
<ns:string>2012</ns:string>
</ns:Value>
</ns:GLDataFilter>
<ns:GLDataFilter>
<ns:Field>FiscalPeriod</ns:Field>
<ns:FieldOperator>Equals</ns:FieldOperator>
<ns:Value>
<ns:string>4</ns:string>
</ns:Value>
</ns:GLDataFilter>
<ns:GLDataFilter>
<ns:Field>Segment2</ns:Field>
<ns:FieldOperator>Equals</ns:FieldOperator>
<ns:Value>
<ns:string>112ETL</ns:string>
</ns:Value>
</ns:GLDataFilter>
<ns:GLDataFilter>
<ns:Field>Scenario</ns:Field>
<ns:FieldOperator>Equals</ns:FieldOperator>
<ns:Value>
<ns:string>Forecast2012</ns:string>
</ns:Value>
</ns:GLDataFilter>
<ns:GLDataFilter>
<ns:Field>AmountType</ns:Field>
<ns:FieldOperator>Equals</ns:FieldOperator>
<ns:Value>
<ns:string>MTD</ns:string>
</ns:Value>
</ns:GLDataFilter>
</ns:FilterCollection>
<ns:ApplyCreditDebit>No</ns:ApplyCreditDebit>
</ns:GLData_RetrieveWithLogin>
Output:
<GLData_RetrieveWithLoginResponse xmlns="http://www.HostAnalytics.com/API/SOAP/StateFree/Common/2009/03/19">
<GLData_RetrieveWithLoginResult>
<GLData>
<Segment1>Flow-MTD-Credit</Segment1>
<Segment2>112ETL</Segment2>
<Segment3>000</Segment3>
<Segment4>00</Segment4>
<Segment5>1000</Segment5>
<Segment6>000</Segment6>
<Segment7>00</Segment7>
<Segment8>000-0000</Segment8>
<Scenario>Forecast2012</Scenario>
<Reporting>G/L Data (LC)</Reporting>
<Amount>40.000000</Amount>
<AmountType>MTD</AmountType>
<FiscalYear>2012</FiscalYear>
<FiscalPeriod>4</FiscalPeriod>
</GLData>
<GLData>
<Segment1>Flow-MTD-Credit</Segment1>
<Segment2>112ETL</Segment2>
<Segment3>000</Segment3>
<Segment4>00</Segment4>
<Segment5>1000</Segment5>
<Segment6>000</Segment6>
<Segment7>00</Segment7>
<Segment8>000-0000</Segment8>
<Scenario>Forecast2012</Scenario>
<Reporting>Currency (LC to CC)</Reporting>
<Amount>80.000000</Amount>
<AmountType>MTD</AmountType>
<FiscalYear>2012</FiscalYear>
<FiscalPeriod>4</FiscalPeriod>
</GLData>
<GLData>
<Segment1>Balance-YTD-Debit</Segment1>
<Segment2>112ETL</Segment2>
<Segment3>000</Segment3>
<Segment4>00</Segment4>
<Segment5>1000</Segment5>
<Segment6>000</Segment6>
<Segment7>00</Segment7>
<Segment8>000-0000</Segment8>
<Scenario>Forecast2012</Scenario>
<Reporting>G/L Data (LC)</Reporting>
<Amount>40.000000</Amount>
<AmountType>MTD</AmountType>
<FiscalYear>2012</FiscalYear>
<FiscalPeriod>4</FiscalPeriod>
</GLData>
<GLData>
<Segment1>Balance-YTD-Debit</Segment1>
<Segment2>112ETL</Segment2>
<Segment3>000</Segment3>
<Segment4>00</Segment4>
<Segment5>1000</Segment5>
<Segment6>000</Segment6>
<Segment7>00</Segment7>
<Segment8>000-0000</Segment8>
<Scenario>Forecast2012</Scenario>
<Reporting>Currency (LC to CC)</Reporting>
<Amount>80.000000</Amount>
<AmountType>MTD</AmountType>
<FiscalYear>2012</FiscalYear>
<FiscalPeriod>4</FiscalPeriod>
</GLData>
</GLData_RetrieveWithLoginResult>
</GLData_RetrieveWithLoginResponse>
Case2:
Below is the example input/output when ApplyCreditDebit is set to Yes.
Input:
<ns:GLData_RetrieveWithLogin>
<ns:LoginName>mborra@hostanalytics.com</ns:LoginName>
<ns:Password>VASavi@61</ns:Password>
<ns:TenantCode>ETLCPMTENANTBASEQFQACopy</ns:TenantCode>
<ns:FilterCollection>
<ns:GLDataFilter>
<ns:Field>FiscalYear</ns:Field>
<ns:FieldOperator>Equals</ns:FieldOperator>
<ns:Value>
<ns:string>2012</ns:string>
</ns:Value>
</ns:GLDataFilter>
<ns:GLDataFilter>
<ns:Field>FiscalPeriod</ns:Field>
<ns:FieldOperator>Equals</ns:FieldOperator>
<ns:Value>
<ns:string>4</ns:string>
</ns:Value>
</ns:GLDataFilter>
<ns:GLDataFilter>
<ns:Field>Segment2</ns:Field>
<ns:FieldOperator>Equals</ns:FieldOperator>
<ns:Value>
<ns:string>112ETL</ns:string>
</ns:Value>
</ns:GLDataFilter>
<ns:GLDataFilter>
<ns:Field>Scenario</ns:Field>
<ns:FieldOperator>Equals</ns:FieldOperator>
<ns:Value>
<ns:string>Forecast2012</ns:string>
</ns:Value>
</ns:GLDataFilter>
<ns:GLDataFilter>
<ns:Field>AmountType</ns:Field>
<ns:FieldOperator>Equals</ns:FieldOperator>
<ns:Value>
<ns:string>MTD</ns:string>
</ns:Value>
</ns:GLDataFilter>
</ns:FilterCollection>
<ns:ApplyCreditDebit>Yes</ns:ApplyCreditDebit>
</ns:GLData_RetrieveWithLogin>
Output:
<GLData_RetrieveWithLoginResponse xmlns="http://www.HostAnalytics.com/API/SOAP/StateFree/Common/2009/03/19">
<GLData_RetrieveWithLoginResult>
<GLData>
<Segment1>Flow-MTD-Credit</Segment1>
<Segment2>112ETL</Segment2>
<Segment3>000</Segment3>
<Segment4>00</Segment4>
<Segment5>1000</Segment5>
<Segment6>000</Segment6>
<Segment7>00</Segment7>
<Segment8>000-0000</Segment8>
<Scenario>Forecast2012</Scenario>
<Reporting>G/L Data (LC)</Reporting>
<Amount>-40.000000</Amount>
<AmountType>MTD</AmountType>
<FiscalYear>2012</FiscalYear>
<FiscalPeriod>4</FiscalPeriod>
</GLData>
<GLData>
<Segment1>Flow-MTD-Credit</Segment1>
<Segment2>112ETL</Segment2>
<Segment3>000</Segment3>
<Segment4>00</Segment4>
<Segment5>1000</Segment5>
<Segment6>000</Segment6>
<Segment7>00</Segment7>
<Segment8>000-0000</Segment8>
<Scenario>Forecast2012</Scenario>
<Reporting>Currency (LC to CC)</Reporting>
<Amount>-80.000000</Amount>
<AmountType>MTD</AmountType>
<FiscalYear>2012</FiscalYear>
<FiscalPeriod>4</FiscalPeriod>
</GLData>
<GLData>
<Segment1>Balance-YTD-Debit</Segment1>
<Segment2>112ETL</Segment2>
<Segment3>000</Segment3>
<Segment4>00</Segment4>
<Segment5>1000</Segment5>
<Segment6>000</Segment6>
<Segment7>00</Segment7>
<Segment8>000-0000</Segment8>
<Scenario>Forecast2012</Scenario>
<Reporting>G/L Data (LC)</Reporting>
<Amount>40.000000</Amount>
<AmountType>MTD</AmountType>
<FiscalYear>2012</FiscalYear>
<FiscalPeriod>4</FiscalPeriod>
</GLData>
<GLData>
<Segment1>Balance-YTD-Debit</Segment1>
<Segment2>112ETL</Segment2>
<Segment3>000</Segment3>
<Segment4>00</Segment4>
<Segment5>1000</Segment5>
<Segment6>000</Segment6>
<Segment7>00</Segment7>
<Segment8>000-0000</Segment8>
<Scenario>Forecast2012</Scenario>
<Reporting>Currency (LC to CC)</Reporting>
<Amount>80.000000</Amount>
<AmountType>MTD</AmountType>
<FiscalYear>2012</FiscalYear>
<FiscalPeriod>4</FiscalPeriod>
</GLData>
</GLData_RetrieveWithLoginResult>
</GLData_RetrieveWithLoginResponse>
Best Practice Tips
Only use this feature if the data amounts need to be retrieved with a sign reversal for credit amounts. Otherwise, do not make any changes to this parameter and the default setting will continue to work with the existing parameters.
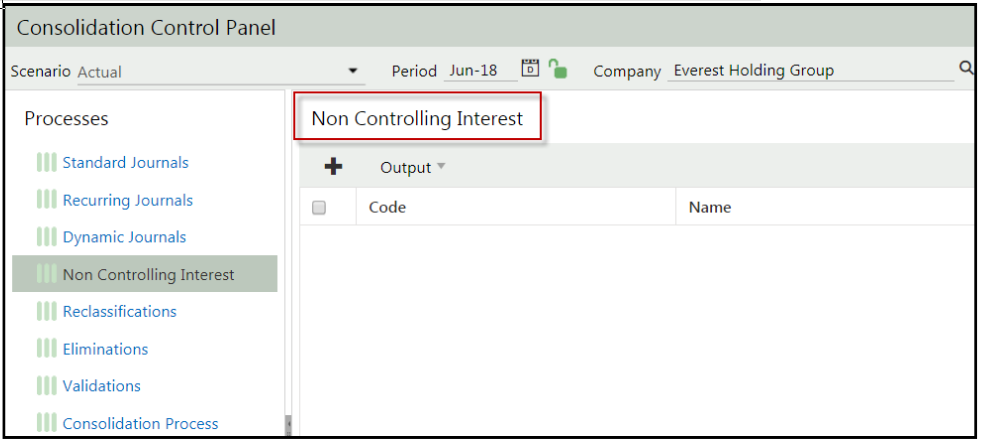
Consolidation: Name Change from Partial Ownership to Non Controlling Interest
To comply with the naming convention set forth by FASB (Financial Accounting Standards Board), we’ve changed the name of Partial Ownership to Non Controlling Interest in the application. When you access the Consolidation Control Panel, the process that was named Partial Ownership is now named Non Controlling Interest as shown below.
Instead of adding a Partial Ownership Rule, you will add Non Controlling Interest.
This change also affects the Audit Area and Job Manager name. In both cases, the name has changed from Partial Ownership to Non Controlling Interest as shown below.


Best Practice Tip
To check Audit Log for actions prior to this release for Partial Ownership, select Non Controlling Interest as the Audit Area. The Audit description for the audit entry will remain unchanged and help when reviewing the log if you need to check for Partial Ownership related actions.
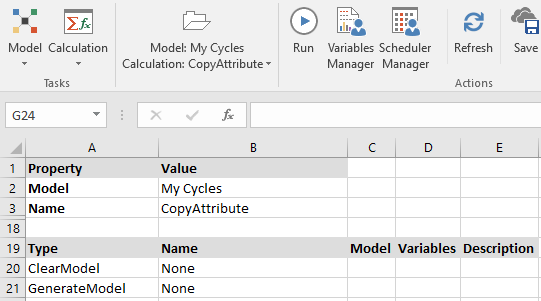
Modeling 2.5.1: Leveraging Attributes in Modeling
Using Attributes in Formulas to Identify Cells to Calculate
In this release, you can use Attributes within formulas to identify the data cells that should be modified by the formula.
List the Attribute in the Filter section of the formula. This is the section where you provide the Dimensions list.
In the Filter column, only LeafMembers is supported.
In the Filter Value column, you can specify the attribute member, a variable, or a variable expression.
Attributes cannot be used in the Formula Design or Formula Member section. They can be used only in the Filter section of the Formula.
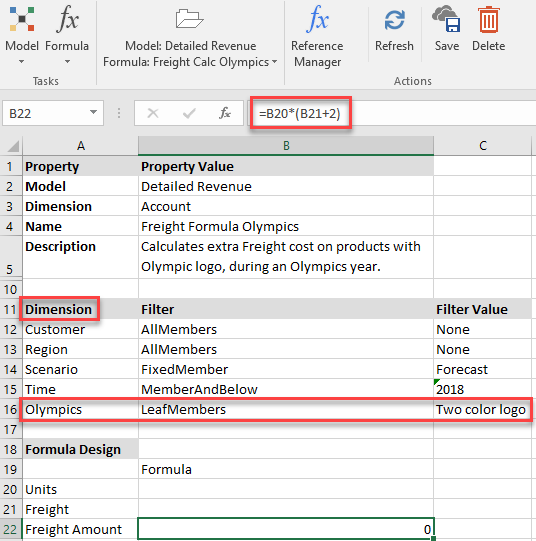
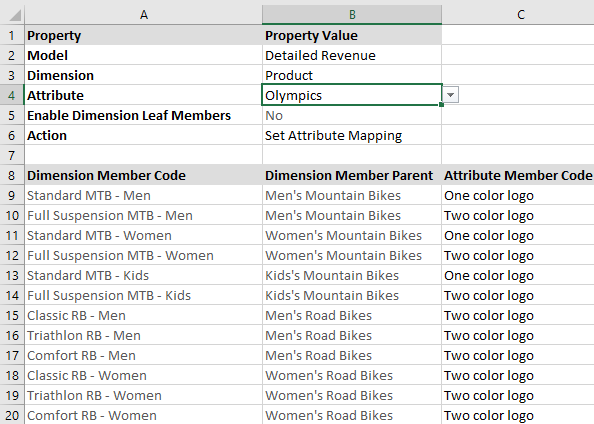
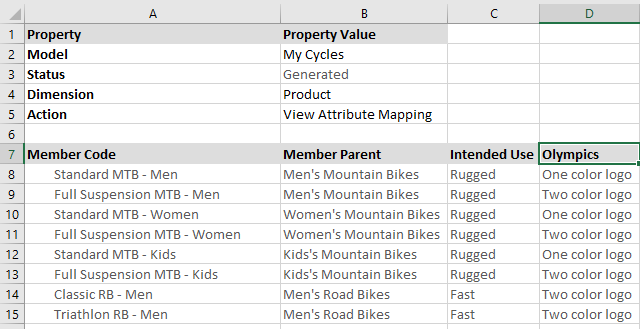
Consider the following Attribute defined on the Product dimension, Olympics:

Then define a formula that assumes that freight costs will be higher for products with an Olympics logo on them. In the example below, freight costs per unit are increased by $2 for products with a 2-color Olympic logo on them.
If you want to set the year and attribute value just before running the calculation, you could add variables to the Filter Value. Regular dimensions and Attributes can both use variables.
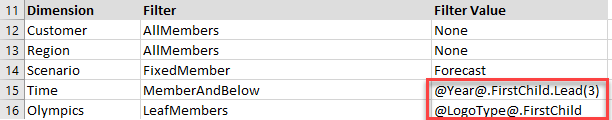
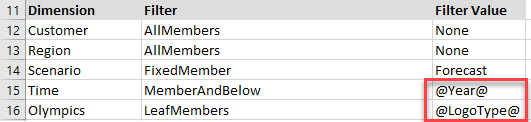 You can also use variable expressions for the Filter Value. In the following example, the 4th quarter of the year and the first logo type in the Olympics attribute will be calculated with the formula. Regular dimensions and Attributes can both use variable expressions.
For more information on expressions, see Example Substitution Variable Expressions.
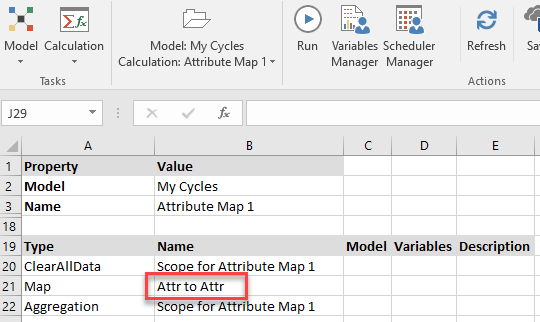
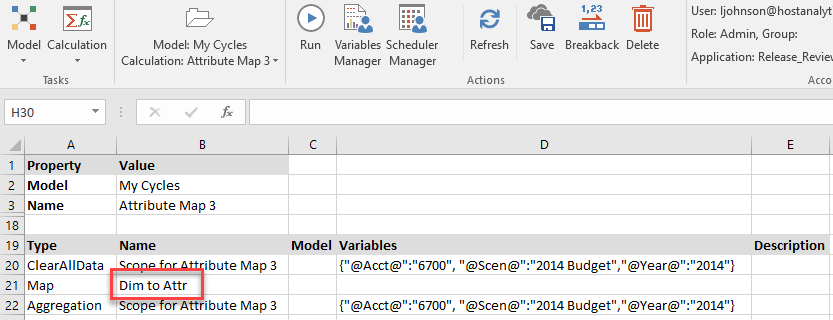
To run the formula, create a calculation that includes a row for the formula to be executed and defines the variables. Then add a row to aggregate the parents affected by the formula, if desired. In the example below, Scenario and Year is a separately defined Scope with variables @Scen@ and @Year@.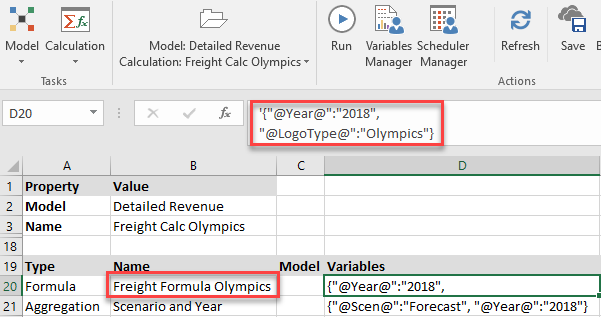
Your title goes here
Attributes are supported only in the Filter section of the Formula.
You can use attributes with or without the base dimension included in the Filter section of the Formula. When you are using attributes along with the base dimension, both members will be used in filtering the cells for the formula to include in the calculation.
Best Practice: use attributes in formulas only if needed.
Using Attributes in Maps for Leaf Data Transfer
In this release, you can use Maps with Attributes to copy leaf-level data from one analytic model to another, from a master model to an analytic model, or from an analytic model to a master model. This feature is not designed to transfer data from HACPM_Financial to analytic models.
Attributes provide a way to group a set of leaf dimension members together. The group can be composed of leaf members at different levels or in different parent structures within a dimension. Thus, it may be more efficient for you to copy leaf data between models using attributes to describe the set of members, instead of specifying each member you want to copy.
Attributes do not have data associated with them directly. Attributes point to base dimension leaf members which have data associated with them. When you transfer data to or from an attribute, you are copying data to or from the associated base dimension leaf members.
The Map must be of Type Data and must Transfer only Leaf data.
There are three methods to choose from:
Attribute in Source to Attribute in Target (one to one): copies the data for source base leaf members to corresponding target base leaf members.
Specify Filter Type LeafMembers in Source to LeafMembers in Target, or MemberAndBelow in Source to MemberAndBelow in Target.
Specify Match Criteria Common if the base leaf members associated with the source and target are not identical.
The attribute member names can be the same or different between source and target. For example, the attribute name in the Source could be USA/Can and the attribute name in the Target could be US and Canada.
You can use variables and variable expressions with attribute and dimension member names.
Example 1
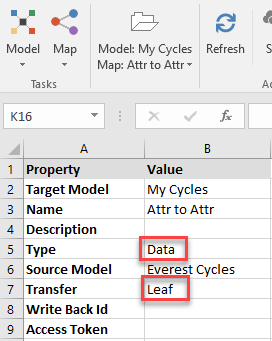
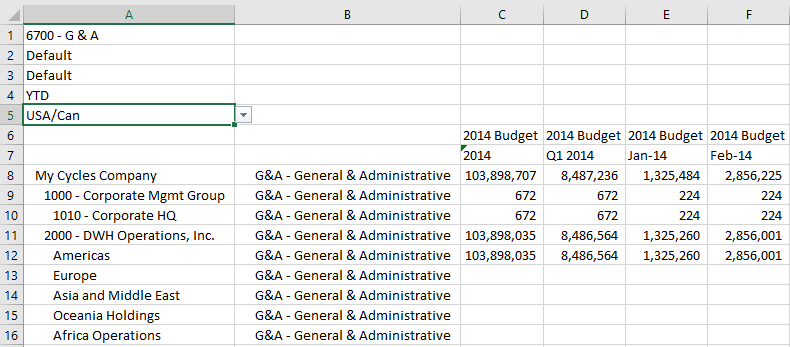
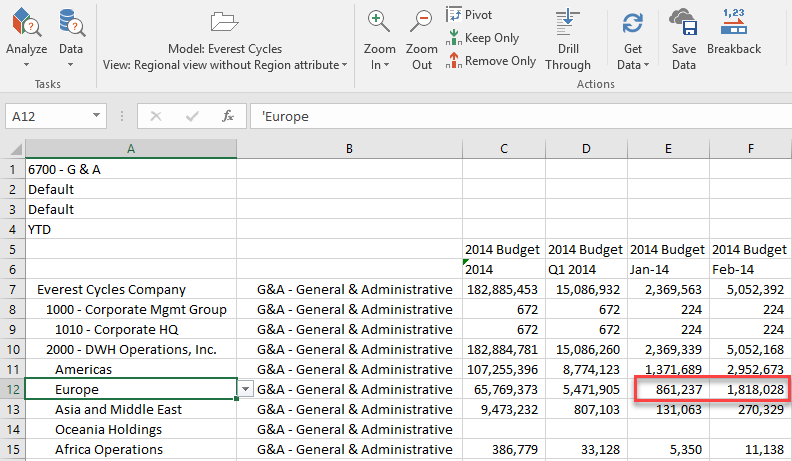
The following example copies leaf-level data from Everest Cycles to My Cycles, and both models have a Region attribute. Leaf data associated with the Region attribute USA/Can is copied to My Cycles.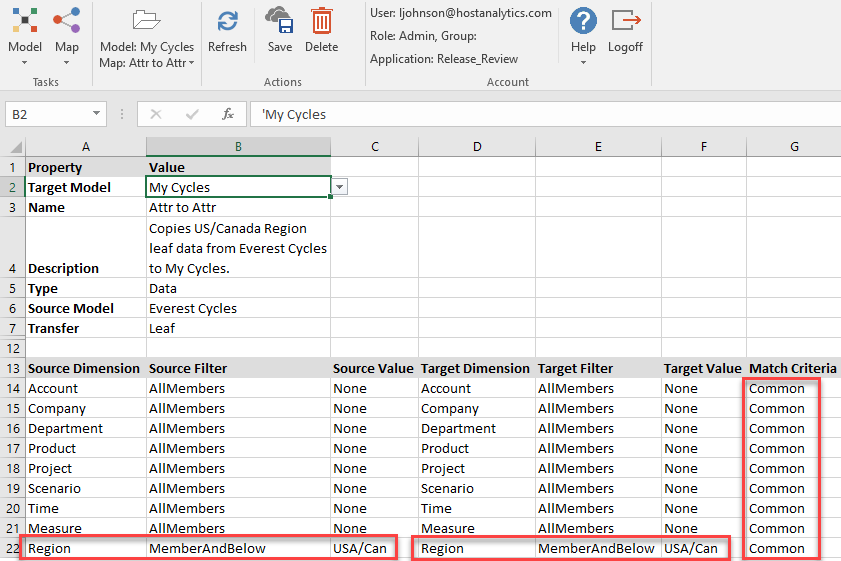
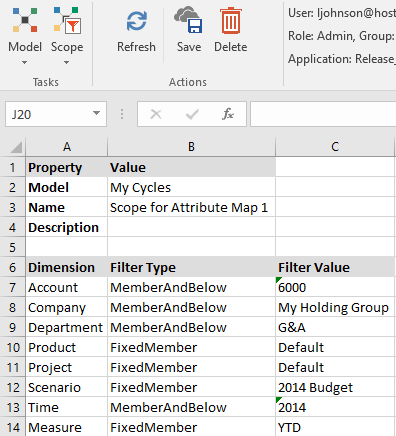
A scope defines which data in My Cycles will be used in the calculation. In this case, there are no variables in use, but you can use them if you wish.
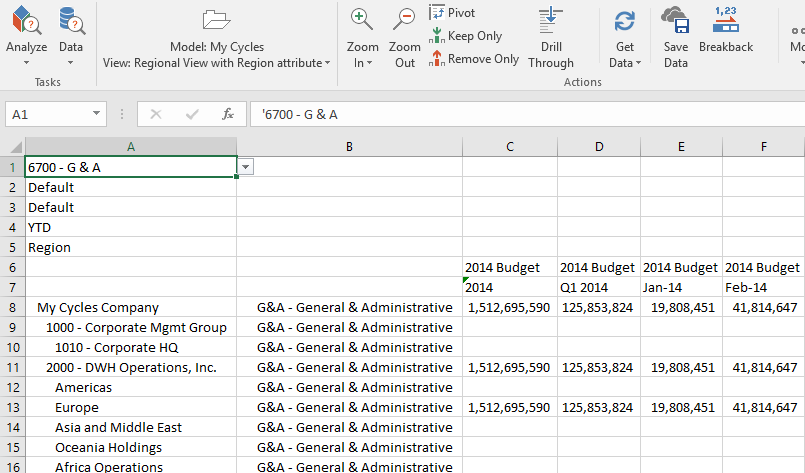
 Here is a look at the Target data before the calculation is run.
A calculation clears data in the Target, runs the map, and aggregates data.
Here is a look at the Target data after the calculation is run.
Note:
Also, you can select the Source Value and Target Value columns with a member selection drop-down. 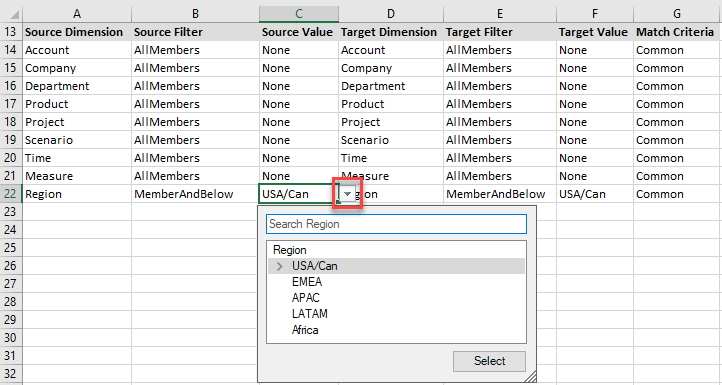
Attribute in Source to Dimension in Target (one to one): copies the data for source base leaf members to corresponding target dimension leaf members.
Specify Filter Type LeafMembers in Source to LeafMembers in Target, or MemberAndBelow in Source to MemberAndBelow in Target.
Specify Match Criteria Common if the base leaf members associated with the source and target are not identical.
The source attribute member names can be the same or different than the target dimension member names. For example, the attribute name in the Source could be USA/Can and the dimension member name in the Target could be North America.
You can use variables and variable expressions with attribute and dimension member names.
Example 2
The following example copies leaf-level data associated with the Region, USA/Can attribute from Everest Cycles to the Americas hierarchy in the Company dimension in My Cycles.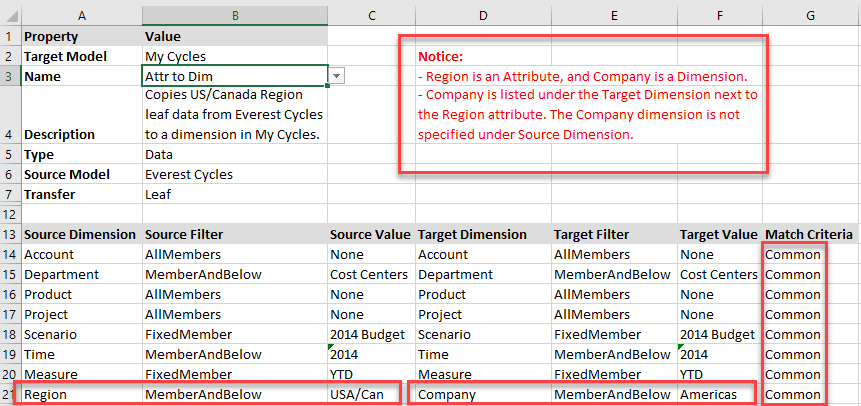
A scope defines which data in My Cycles will be used in the calculation. In this case, there are no variables in use, but you can use them if you wish.
A calculation clears Target data, runs the map, and aggregates data.
Here is a look at the Target data after the calculation is run.
Dimension in Source to Attribute in Target (one to many): copies the data from a source dimension member to all corresponding target base leaf members associated with the attribute.
Specify Filter Type FixedMember in Source to LeafMembers in Target.
Match Criteria is ignored on the row that refers to the attribute.
The source dimension member names can be the same or different than the target attribute names. For example, the dimension member name in the Source could be Europe and the attribute name in the Target could be EMEA.
The source dimension member can be a rollup member or a leaf member. Its data will be copied to each of the leaf base dimension members associated with the Target attribute. You copy data for only one source dimension member at a time.
You can use variables and variable expressions with attribute and dimension member names.
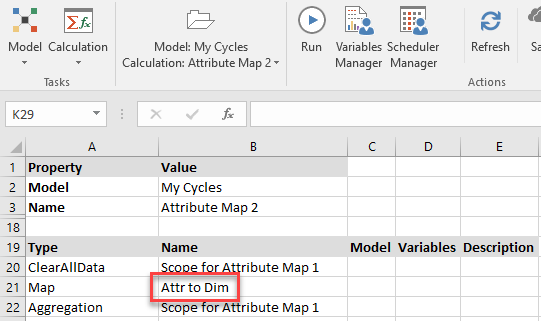
Example 3
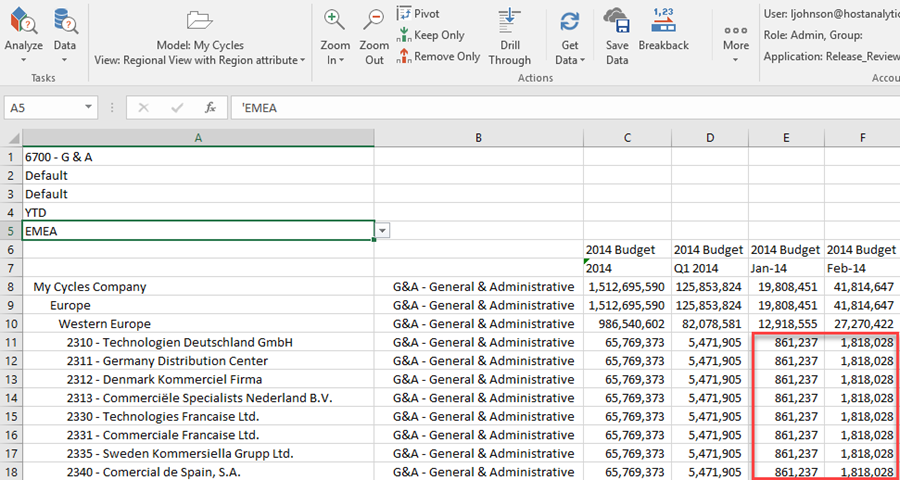
The following example copies the data for the fixed member Europe in the Company dimension from Everest Cycles to all base dimension leaf members associated with the EMEA hierarchy in the Region attribute in My Cycles. This is a one-to-many operation.
Note that Europe is a parent-level member. You can use any level of member as the Source.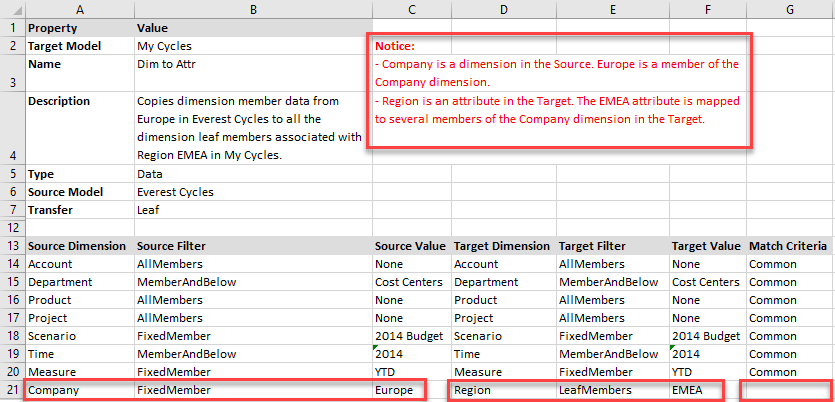
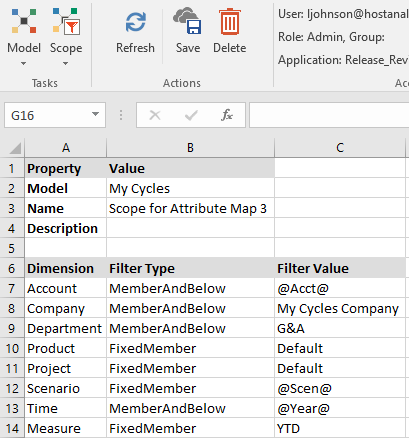
A scope defines which data in My Cycles will be used in the calculation. This example uses variables.
Here is a look at the Source data in Everest Cycles for Europe.
A calculation clears Target data, runs the map, and aggregates data.
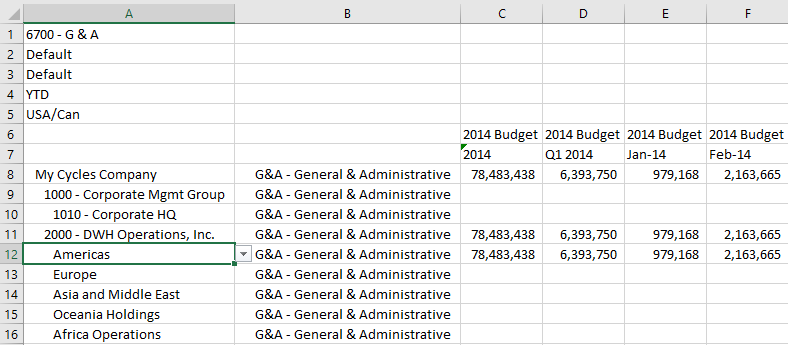
 Here is a look at the Target data in My Cycles after the calculation is run. Notice that the same data was copied to each base leaf dimension member that is associated with the EMEA attribute. This is a one-to-many operation.
Using Attributes in Maps for Metadata Transfer
In this release, you can copy Attributes along with their base dimension member mappings from a Source model to a Target model.
Each Attribute is associated with a dimension, and attribute members are mapped to the leaf members in the base dimension. You can copy both the attribute and the mappings from one model to another. This feature is not designed to transfer data from HACPM_Financial to analytic models.
The Map must be of Type Metadata or Both.
The Transfer type must be Leaf if used with map type Both.
When copying Attribute definitions and mappings, the following rules apply:
The Target model must be cleared and regenerated as part of the process.
The Source Filter Type can be AllMembers, LeafMembers, or MemberAndBelow.
The Target Filter Type can be AllMembers, LeafMembers, or MemberAndBelow.
Match Criteria Common is assumed, by default, on the row in the map that refers to the Attribute, whether you specify Common or not.
Lookups are not supported for attributes.
You can use variables and variable expressions with attribute and dimension member names.
The Attribute is created in the Target model and the dimension member mappings are copied for all dimension members that are common between the source and target.
If the Target model already has the same Attribute, its attribute hierarchy and mappings are deleted and replaced with the attribute hierarchy and mappings from the Source. The display labels originally assigned to the Target Attribute members are retained.
Example
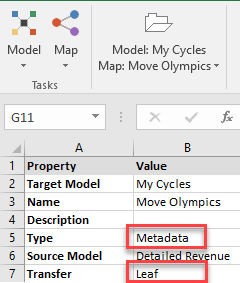
The following example copies the attribute Olympics and its mappings on the base dimension Product from Detailed Revenue to My Cycles.
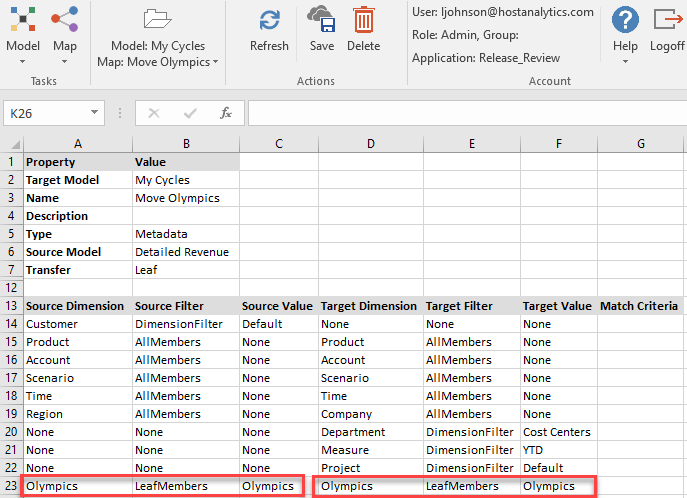
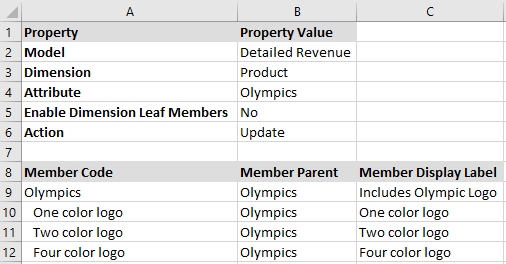
Here is a look at the attribute and mapping in the Source model.
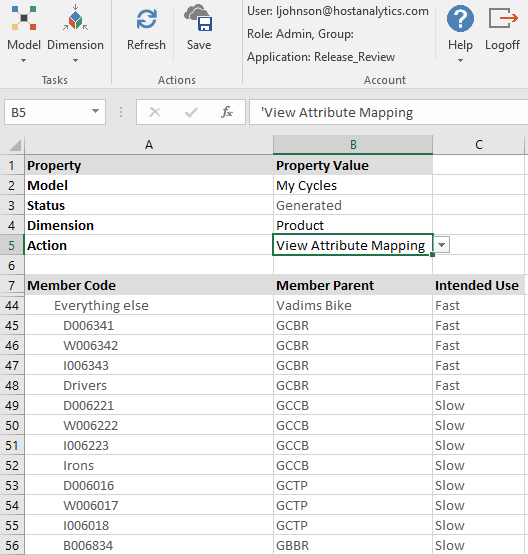
Here is a look at the Product dimension in the Target model, My Cycles, before the calculation is run. My Cycles has another Attribute called Intended Use that is unrelated to the Olympics Attribute that will be copied. It has many product codes that are different than the products in Detailed Revenue.
A calculation clears the Target model and regenerates it. When generating a model, only one map for that model can be of type Both or Metadata. Because the map we created is of type Metadata, the GenerateModel step automatically runs that map to create and move the metadata from the Source model.
Here is a look at the Product dimension in the Target model after the calculation is run. The Attribute has been copied along with the mappings.
Was this article helpful?