- 6 Minutes to read
- Print
- DarkLight
- PDF
Dynamic Planning Overview of Excel Reporting
- 6 Minutes to read
- Print
- DarkLight
- PDF
Providing Access to Excel Reporting Menu Items
In your application, the Excel Report task is available as shown below.
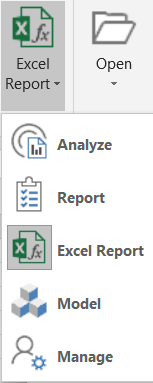
The actions available in the ribbon once Excel Report is selected vary based on user role and privileges.
Power User Access
Power users have access to all Excel Reporting functionality.
Contributor User Access
For Contributor users, menu choices will depend on whether or not the Power user has granted access to Design Excel Reports. By default, Contributor users have this access.
Contributors with design access have the following (initial) menu items:

Contributors without design access have the following (initial) menu items:

Reviewer User Access
Reviewers have the following menu items:

For Reviewer users, menu choices are consistent because Reviewer users cannot design Excel Reports.
The menu ribbon expands once you start working with a report.
The following list of tasks is available for Reviewers and Contributors without design access:
Opening Excel Reports
Refreshing Excel Reports
Organizing Reports into Folders
Working with the Metadata Manager
Deleting SpotlightXL Formula Cells
Discovering and Filtering the Data Selection
Creating Snapshots
User Access to Models and Dimensions
Working with the Excel Reporting Menu Items
The menu items you may have access to based on role and privileges described above:
Opens the folder structure, which contains reports. | |
Opens Design Manager, where you can set up data intersections, members, or point of view (POV) drop-downs for your Excel report. | |
View the dimensions and members that are used on the report. | |
Refreshes all data except for POV data. | |
More Menu | Provides options to create a snapshot report, Copy Spotlight Formulas to the Clipboard, or Paste Spotlight Formulas from the Clipboard. |
Optionally automatically refreshes all data whenever a POV is changed. You can choose from automatic refresh off, for the current sheet, or for the whole document. | |
Save reports to the Dynamic Planning Cloud where they will be stored of other users to download. |
Open
Open the folder structure to perform the following:
- Add a folder
- Rename a folder
- Delete a folder
- Download an Excel Report
For information on how to add a folder, rename a folder or delete a folder, click here and scroll down to the View and Report Organization Functionality topic as it also applies to Excel Reporting.
For information on downloading reports, see Publishing and Downloading Excel Reports
Design Manager
You use this action to design your Excel Report. This action opens Design Manager, where you can set up data intersections, members, substitution variables, or point of view (POV) drop-downs for you Excel report.
In Practice: Designing an Excel Report
The steps below provide an example of how to design an Excel report.
Put your cursor on cell A1 and click Design Manager.
In the Design Manager interface, select a model from the Model drop-down.
Click POV and select a dimension (in this case it is Company) from the Dimension list box to set up a POV for the Company dimension.
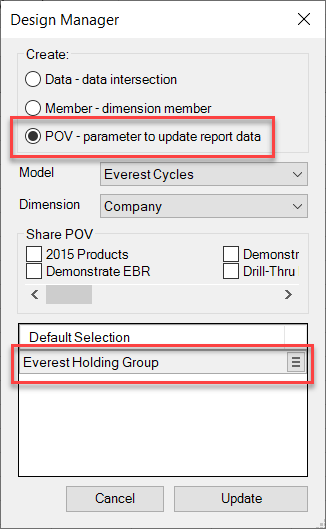
Click Update. Notice that cell A1 now displays the dimension member for Company and the contents of the cell is a SpotlightMetadata formula. Notice also that the ribbon has changed to reflect Design Manager and Refresh. Cell A1 now contains a drop-down that lets you select a member from the Company dimension.
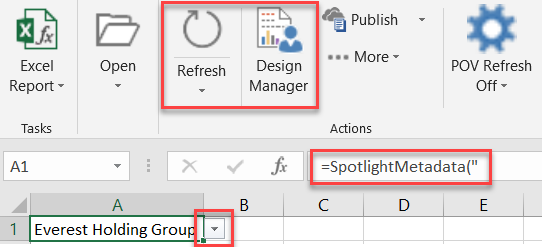
Select cell B1 and click Design Manager. Click Data to set up a Data intersection and click Update.
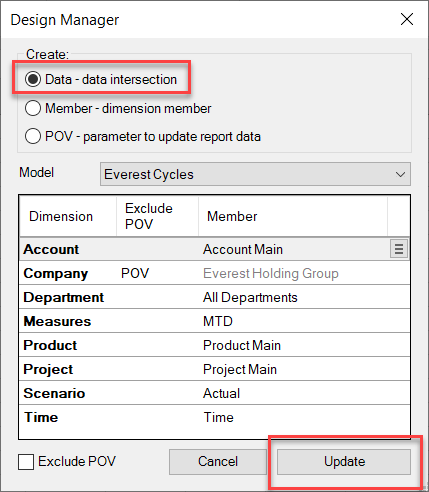
Notice that cell B1 now displays #REFRESH and the contents of the cell is a SpotlightData formula as shown below.

Click Refresh, and the data is retrieved as shown below.

Now, change the format of the cell to a numeric format, such as Accounting format. Click Refresh again. Your formatting selection is retained.
Warning:Do not modify the contents of SpotlightMetadata or SpotlightData formulas.Select cell A2, click Design Manager, click Member, and select Account from the Dimension list box.
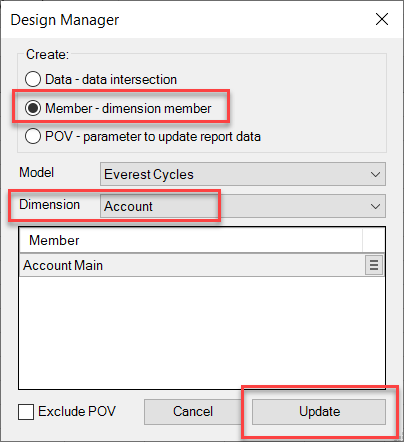
Click Update. Notice that cell A2 now displays the member from the Account dimension and the content of the cell is a SpotlightMetadata formula.
 Note:There is no concept of Design mode and Run mode when using Excel Reporting. You are working inside of a worksheet, such as Sheet1, or multiple worksheets, and you are inserting or viewing text, numbers, formulas, formatting, and SpotlightXL items with a live connection to the application and model in the cloud.
Copy or move the contents of cell B1 anywhere else in the worksheet. You can make multiple copies of it and format them however you wish. The format is retained when you click Refresh.
Metadata Manager
Reviewer and Contributor users without design access have Metadata Viewer on the menu ribbon. Metadata Manager allows you to view the dimensions and members that are used on the report.
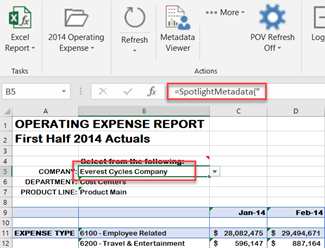
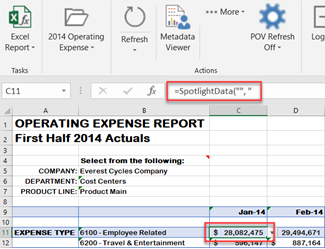
Metadata Viewer provides information only on cells with Spotlight formulas. If you click around in the worksheet, you see that some cells are plain text, some have Excel formulas, and some have Spotlight formulas.
Spotlight formulas have two variations:
- SpotlightMetadata()
- SpotlightData()
In Practice
Click on a POV cell, such as Company.
Click Metadata Viewer.
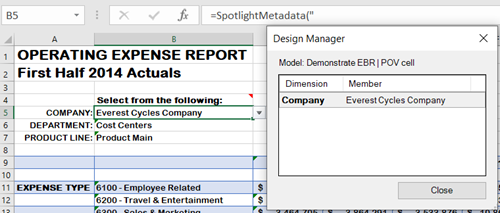
You see that Everest Cycles Company is the member being used from the Company dimension.
Click Close.
Click on a data cell.
Click Metadata Viewer from the ribbon.
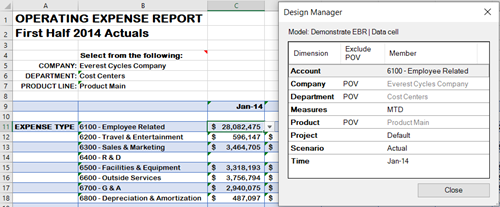
You see that data cell was created from the intersection of all the dimensions and members listed. This list of members may differ from the current POV selections. In the example, the POV for Departments is “Cost Centers.” In the Metadata Manager, the Departments member is “All Departments.” The list in the Metadata Manager shows how the data cell was originally created. When you change the POV in the worksheet and click Refresh, the data is dynamically updated from the model, but the original formula remains the same.
Note:If the model has Attributes, they are indented under the dimension they are associated with. Attributes that are grayed out are not in use.
Click Close.
If you have Publish privileges, you can click Publish on the menu ribbon to upload the model with any changes you have made.
Refresh
This action refreshes the data to match the currently selected POV. For example, select a different account in cell A2 and click Refresh.
See Also: Refreshing and Formatting Excel Reports
POV Refresh
This action optionally automatically refreshes all data whenever a POV is changed. You can choose from automatic refresh off, for the current sheet, or for the whole document.
If POV Refresh is set to Off, when you select a different POV, the data is not refreshed. This is useful if you have a large report and want to change several POVs before refreshing the data.
If POV Refresh is set to Sheet, the data in the current worksheet is refreshed whenever you change a POV cell.
If POV Refresh is set to Document, the data in the whole workbook is refreshed whenever you change a POV cell. This is useful if you are using multiple tabs in your workbook. One tab in the workbook can hold all the data drivers in POV cells, and the other tabs are refreshed whenever one of the drivers changes.

See Also: Refreshing and Formatting Excel Reports
Publish
Dynamic Planning includes the ability to create Excel Reports with Excel Reporting and publish the reports to the Dynamic Planning cloud. Users can then download the report and click to refresh the data. The ability to publish and store reports in the cloud is a collaboration feature to make it easier to store your most common monthly reports in one place.
A user with Power user privilege is required to set up reports that will be accessible by users. The Power user creates a template (or placeholder) for a report that will be published and made accessible to users. This template reserves a spot for the report in the Dynamic Planning cloud and defines which user groups have access to it.
For information on how to publish and download reports, see Publishing and Downloading Excel Reports

