Planful AI Analyst - Release Notes
- 7 Minutes to read
- Print
- DarkLight
- PDF
Planful AI Analyst - Release Notes
- 7 Minutes to read
- Print
- DarkLight
- PDF
Article summary
Did you find this summary helpful?
Thank you for your feedback
Oct 2025 Release
Planful AI: Planful AI Activity Log
With this release, we have introduced the Planful AI Activity Log, giving admins visibility into how users are engaging with the AI Assistant.
Note:
Users with navigation access will be able to view the link for Planful AI Activity Log.
.gif)
Administrators can access a new Planful AI Activity Log option under Maintenance > Application Audit. Export the log as an Excel (.xlsx) file with key details including User, Question, Time, Mode, Feedback Type, Assessment, and Comment.
This enhancement helps finance teams track AI adoption, measure usage patterns, and tailor training to drive higher productivity and ROI from Planful AI.
September 2025 Release
Planful AI Analyst: Threshold-Based Filtering
With this release, users can automatically filter data based on user-defined thresholds (for example, variances greater than 10%). This enhancement enables users to focus their analysis on material changes and outliers, while ignoring less significant data points.
By streamline reviews and highlight only what is most impactful, threshold-based filtering streamlines reviews and supports faster, more informed decision-making.
Sample Natural Language Queries:
Which expenses are more than 500K?
Which departments spent more than 10% above the budget?
Which product's revenues increased by more than 15% compared to last quarter?
Note:
Supported Query Categories:
Get Data
Scenario Variance
Time Variance
August 2025 Release
Planful AI Analyst: Breadcrumb Navigation for Drill Down
With this release, we have introduced breadcrumb navigation during drill-down actions on AI-generated tables or charts. As users explore data across multiple levels (e.g., from Operating Expense → Payroll → Recruiting), a dynamic breadcrumb trail shows the full navigation path.
.gif)
Key Capabilities:
Available in both default and full-screen AI drawer views.
Breadcrumb expands dynamically with each drill level retaining context and displays dimension values.
Clicking a breadcrumb item refreshes the visualization at that specific level.
Users can click the folder icon to return to the original top-level view.
Planful AI Analyst: Share AI-Generated Tables and Charts via Email
With this release, we have introduced generate AI-powered tables and charts based on their planning data and share them instantly via email directly from the AI drawer. This enhancement helps users quickly communicate insights and visuals without switching contexts, improving collaboration and decision-making speed.
Capabilities include:
Search and select one or more users with whom you want to share the information.
Customize the email subject line, with Excel or PNG attachments automatically included based on whether the table or chart view is shared.
This feature facilitates collaboration allowing you to easily share data and insights with relevant stakeholders
How to Share Planful AI-Generated Tables/Charts via Email
Open the Planful AI Drawer.
Click the Export icon in the upper-right corner of the chart or table.
Add email details, in the Share Email dialog:
Recipient(s): Type a user’s name and select from the list.
Subject: Defaults to the chart/table title. You can edit it as needed.
Click Send Email.
.gif)
Planful AI Analyst: Dual Axis and Pie Chart Support for Natural Language Data Questions
With this release, we have introduced additional visualization types for natural language queries.
New Supported Chart Types:
Dual Axis Charts: Ideal for comparing two different types of metrics (e.g., “Payroll Expense” vs. “Variance %”). Displays absolute values on one Y-axis and percentages on the other.
Pie Charts: Useful for breakdown or composition-based queries such as “Breakdown expenses by department” or “Percentage contribution by region.”
These visual enhancements provide users with dynamic and flexible representation of data per user preference.
(5).png)
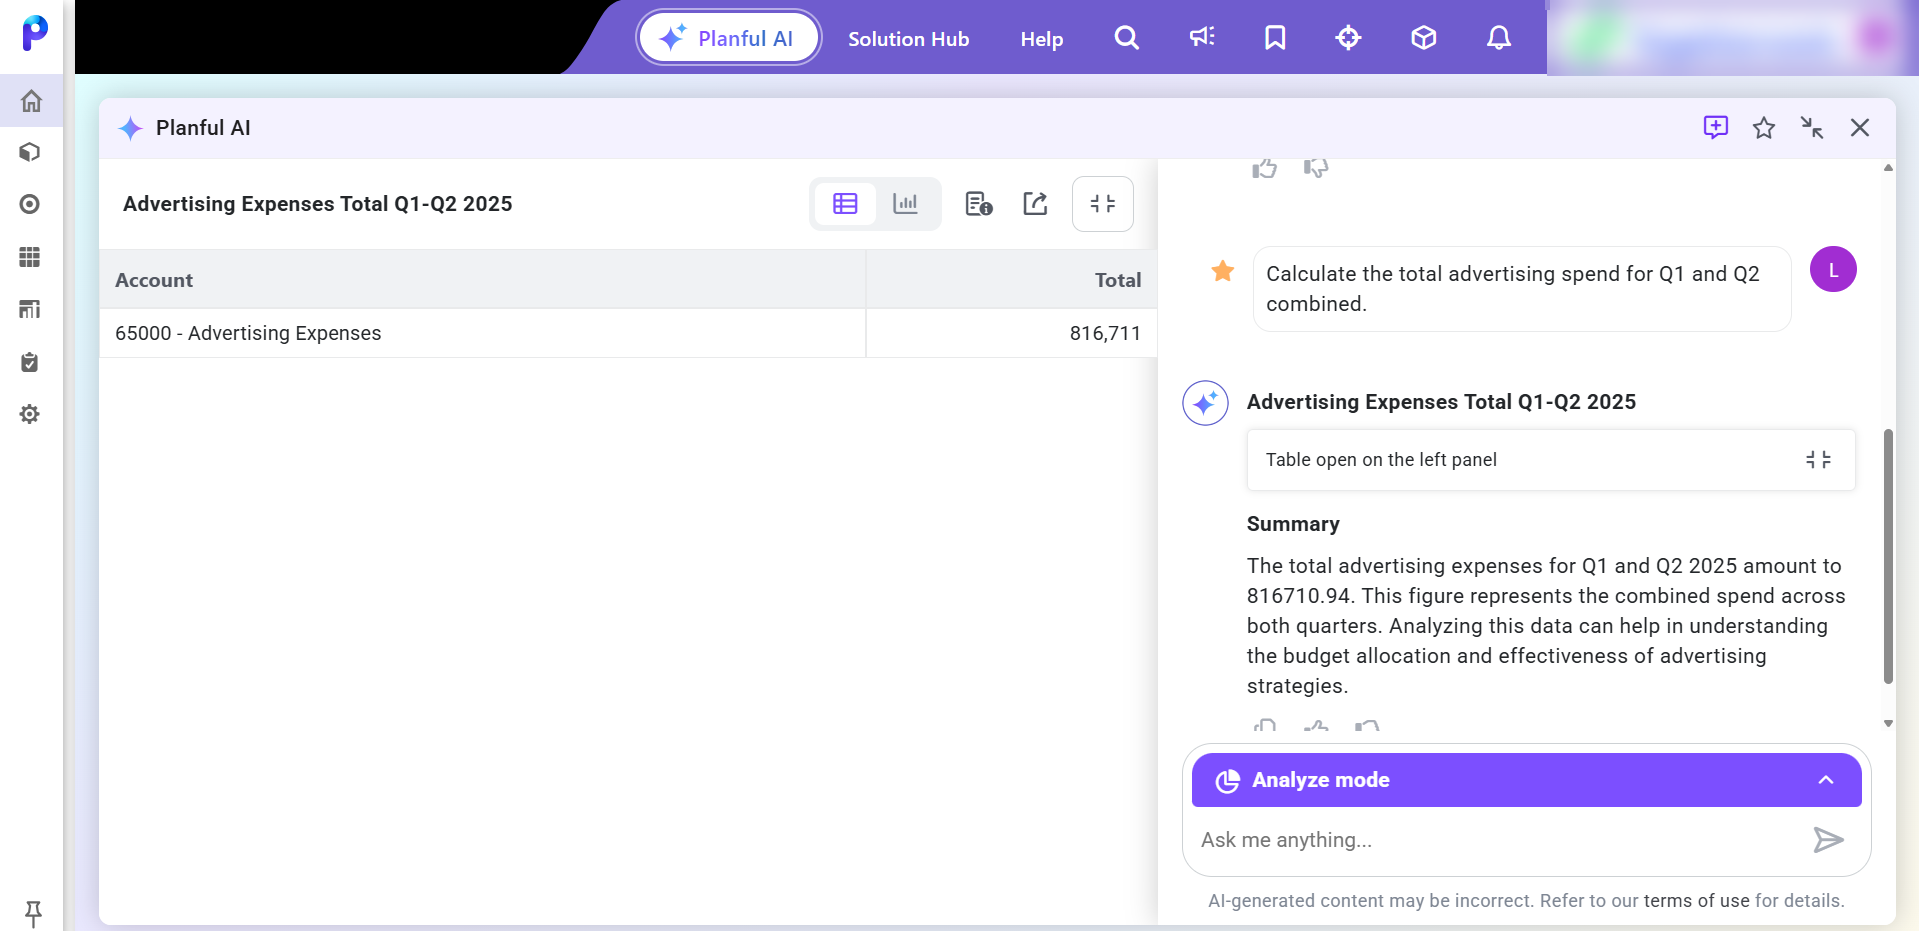
Planful AI Analyst: Natural Language Data Analysis - Sum Calculation
With this release, we have introduced support for natural language (NL) queries that perform simple calculations, beginning with Sum operations on financial cube data. This enhancement allows users to ask intuitive, natural language questions and receive actionable, calculation-based results directly within the Planful AI interface.
Users can now interact with Planful AI using natural language queries that include sum-based calculations such as:
What is the total revenue for the top five customers?
What are the total benefits and salaries costs for Q2?
Planful AI intelligently interprets the query, identifies relevant dimensions and filters, and returns results with a concise factual summary and chart visualizations. It enables users to ask questions involving summation across financial cube data, eliminating the need for manual configurations or formula definitions in reports.
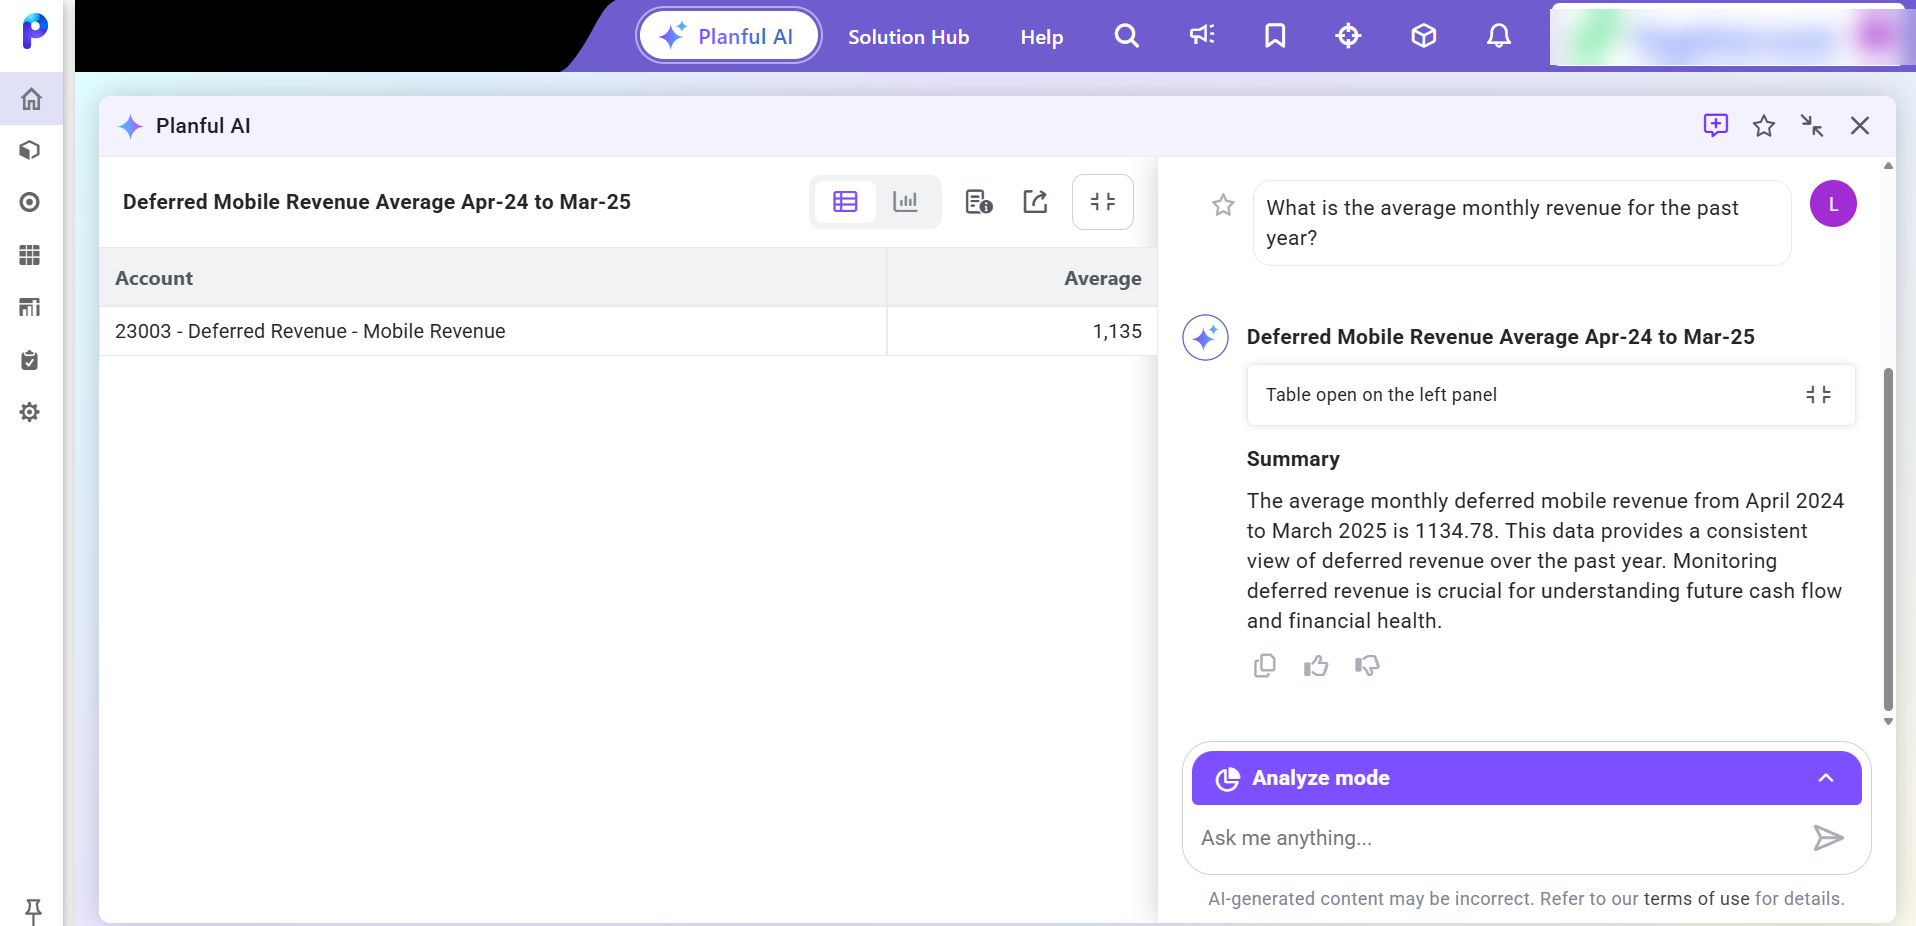
Planful AI Analyst: Natural Language Data Analysis - Average Calculation
With this release, we have supported average-based natural language queries, enabling users to analyze key financial metrics by asking questions in plain English. This intelligent capability performs instant average calculations such as average departmental expenses directly from the finance cube, saving time and enabling deeper, more intuitive insights.
Users can now interact with Planful AI using natural language queries that include average-based calculations such as:
What is the average monthly revenue for the past year?
What is the average expense per department for the last quarter?
Planful AI understands the question, identifies the relevant dimensions (e.g., time, department), and returns the calculated average in both tabular and chart formats. It enables users to compute averages across time periods or organizational dimensions without manually defining formulas.
July 2025 Release
Planful AI Help and Analyst: Support for Favorite Questions
With this release, Planful AI now allows users to mark frequently asked questions as Favorites in both Help and Analyze modes. This enhancement improves productivity by providing quicker access to commonly used queries.
.gif)
Key Benefits:
Mark Questions as Favorites: Each user-submitted question displays a Favorite icon (star icon), allowing users to mark or unmark it as a favorite with a single click.
Favorite Questions Limit: Users can save up to 20 favorites questions for quick access. To add more as a favorite, remove an existing one.
Easy Access & Reusability:
A Favorite icon in the top toolbar of the AI drawer shows a sorted list from oldest to newest.
Clicking a favorite question automatically populates it into the prompt bar.
Users can then edit and submit the question as needed.
Smart Suggestions While Typing: When a user types at least three characters, related favorite questions appear in a dynamic list above the prompt bar, offering quick suggestions.
Visual Cues & Maintenance:
When entering a question that matches a saved favorite, the Favorite icon appears filled, indicating it is already marked.
Users can remove favorites by clicking the delete icon in the Favorite menu or clicking the filled Favorite icon to unmark it directly from the conversation.
Clarification Mode Support: The Favorite feature is supported only for the initial question. It is not supported for follow-up questions.
Planful AI Analyst: Dimension Members Selector
With this release, Planful AI introduces a powerful enhancement to the clarification experience for natural language questions involving data. Users can now search and select specific dimension members such as departments, accounts, or products using a dedicated Dimension Members Selector, while asking questions related to refining data in case of ambiguous or missing inputs.
Key Benefits:
Search and select Dimension Member for data-related questions: Users will now see a Refine your search here link along with similar dimension member names as in the question. Clicking this opens a dialog where you can search and choose the required dimension member.
Intuitive Search Dialog:
Typeahead search: Suggestions appear after typing three or more characters.
Hover Tooltip: Displays the full dimension member name with its hierarchy path.
.gif)
Planful AI Analyst: Support for Large Data Responses
With this release, Planful AI now supports large data tables generated for data-related questions or analysis actions such as Drill Down and Analyze By. This enhancement ensures users can access the full dataset, even when results exceed the display capacity of the Planful AI drawer.
Key Benefits:
Seamless Export of Large Result: When the result data set for a question contains more than 500 cells, the data is automatically exported to an Excel file.
Download Includes Full Data and Headers: The exported Excel file contains the complete data set, including headers, formatted for immediate review and analysis.
June 2025 Release
Planful AI: Introduced Planful AI Analyst
With this release, we are excited to introduce Planful AI Analyst—an intelligent, generative AI assistant embedded within the Planful application. It empowers finance and business teams to perform real-time financial analysis using natural language. By eliminating the need for manual report building or complex formulas, Planful AI Analyst provides instant insights, trend analyses, and performance comparisons.
Note:
To enable Planful AI Analyst, please contact your Planful Account Manager.

Key Benefits:
Gain Instant Financial Insights: Retrieve real-time data summaries, trends, and comparisons using natural language, no need to build or run reports.
Enable Self-Service Analysis: Empower executives and business teams to independently explore financial performance, reducing reliance on financial analysts.
Engage in Context-Aware Conversations: Ask follow-up questions and refine results through ongoing dialogue for deeper, conversational analysis.
Drill Down with Ease: Break down financial data by dimensions such as region, department, or product with a simple query, without the need to find reports or manually create new ones.
Save Time and Boost Efficiency: Eliminate manual steps in reporting and analysis, freeing time for strategic financial planning.
Access Visual and Narrative Output: View results as tables, charts, or Planful AI-generated narratives to quickly interpret performance and trends.
Export with Flexibility: Download tables and visuals in Excel or PNG format for easy sharing and collaboration.
How to Use Planful AI Analyst
Click the Planful AI icon in the top toolbar.
In the Planful AI dialog box, expand the Help mode menu and select Analyze mode.
Type your financial question and press Enter or click the Arrow icon.
View the returned tabular data, charts, and a Planful AI-generated summary.
Click the Full Screen icon to expand the view or select the Thumbs Up or Thumbs Down icon to provide feedback on incorrect or irrelevant responses.
.png)
Was this article helpful?