Planful Analyst GIFs
- 1 Minute to read
- Print
- DarkLight
- PDF
Planful Analyst GIFs
- 1 Minute to read
- Print
- DarkLight
- PDF
Article summary
Did you find this summary helpful?
Thank you for your feedback
July’25 Release
Favorite Questions
You can mark frequently asked questions as Favorites. Simply click the star icon next to any question to pin it for future reuse.
.gif)
Dimension Members Selector
Eliminate confusion from vague queries by precisely selecting the right departments, accounts, or other dimension members. When Planful AI detects ambiguity, click refine your search "here" to open a selector with hierarchy based suggestions.
.gif)
August’25 Release
Breadcrumb Navigation for Drill Down
Understand data context at a glance with interactive breadcrumb trails during drilldowns. As you explore AI-generated tables or charts, each level of navigation is captured visually. Click any breadcrumb to navigate back and reorient your analysis quickly without restarting from scratch.
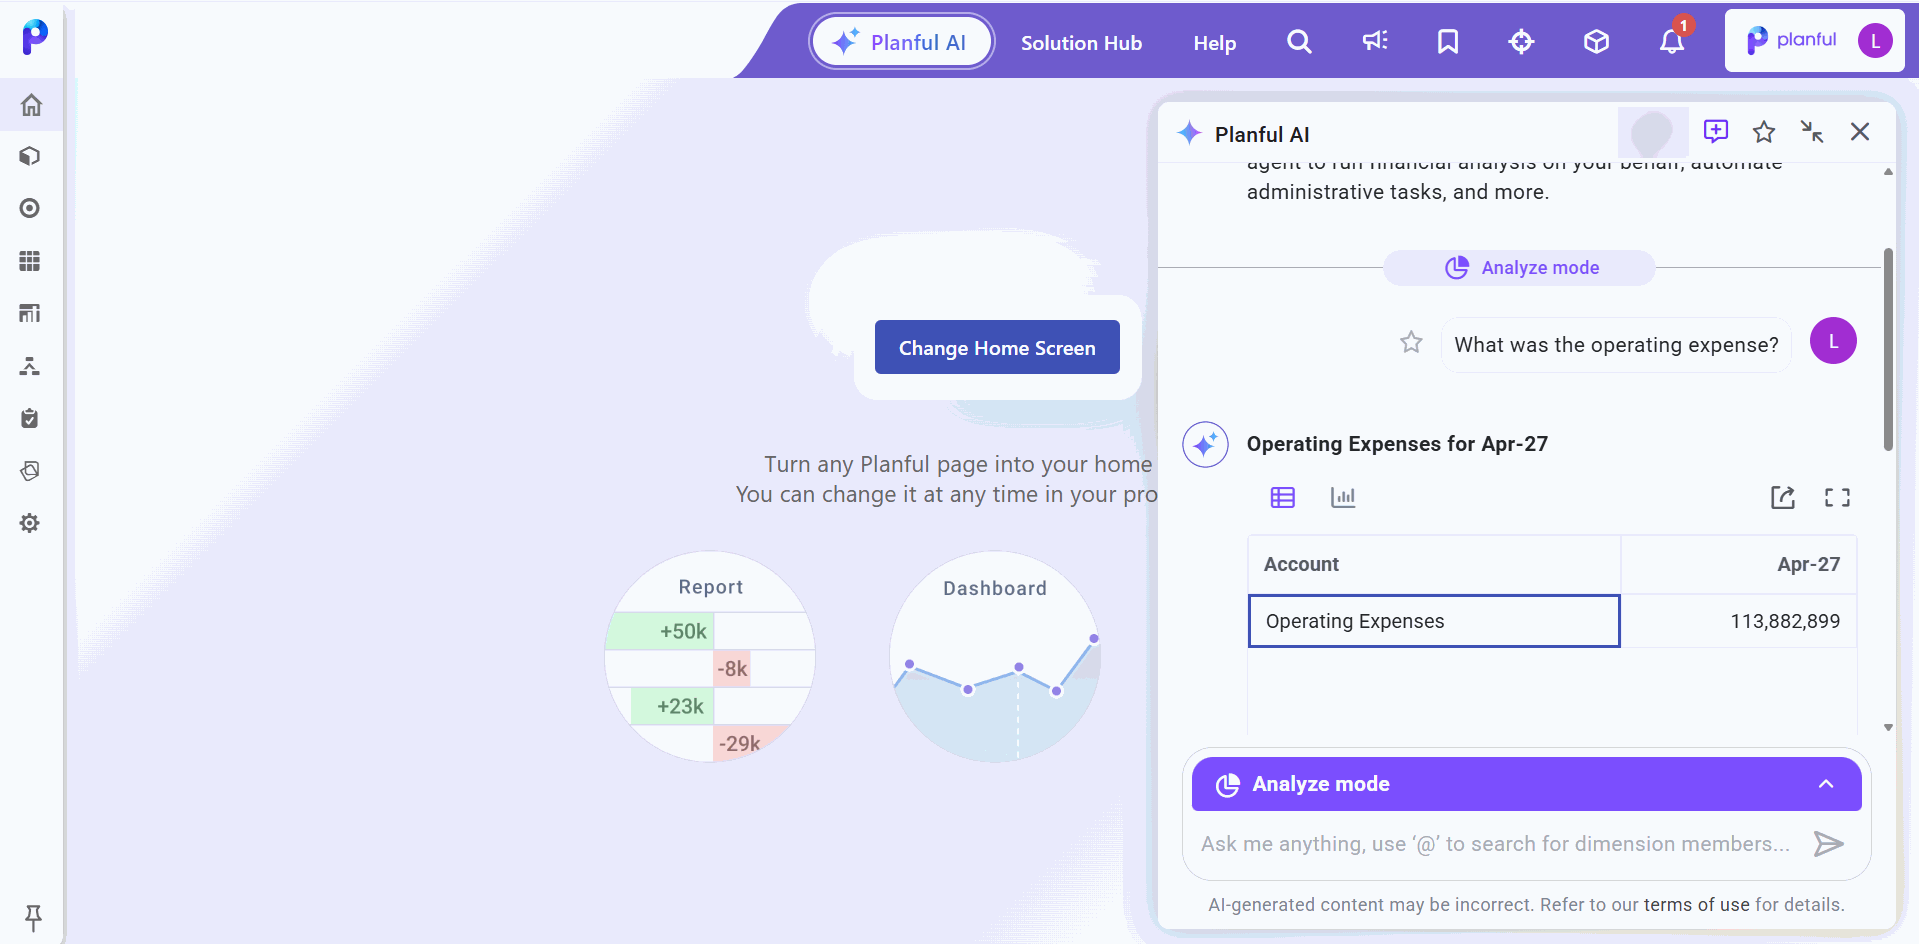
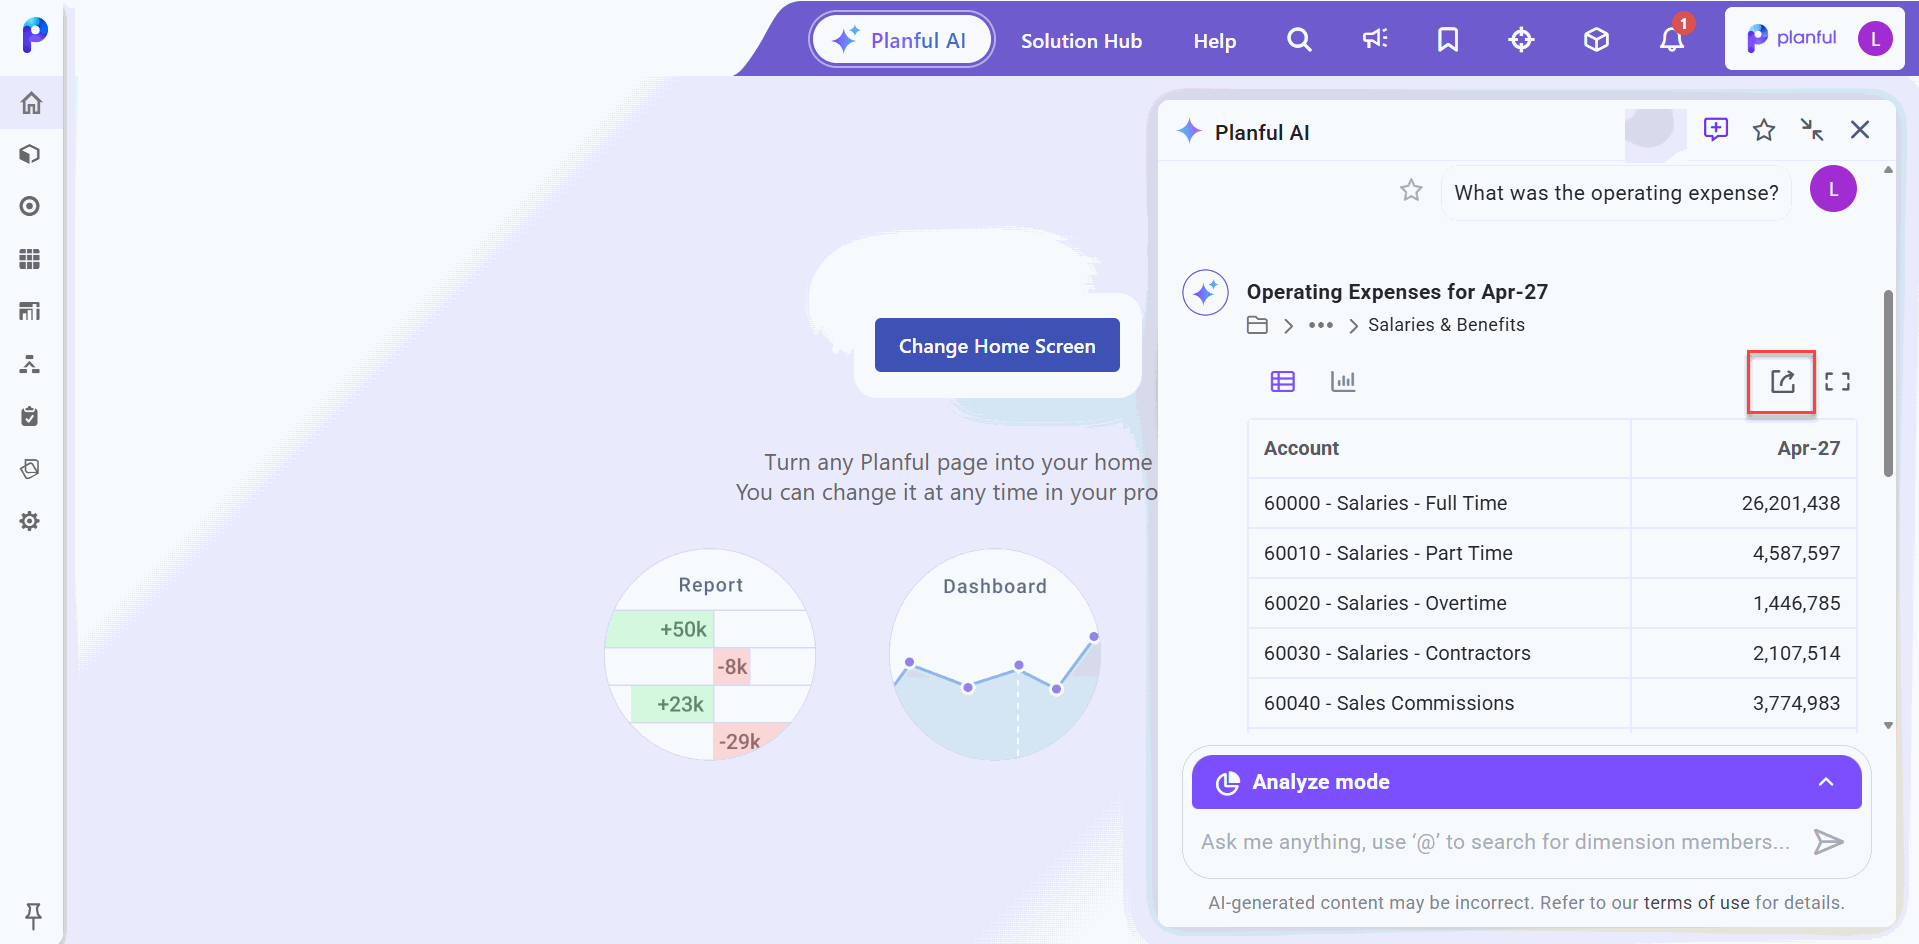
Share AI-Generated Tables and Charts via Email
Click the Share icon above the table/chart to send the data and insights to stakeholders in just a few clicks—no need to export or leave Planful.
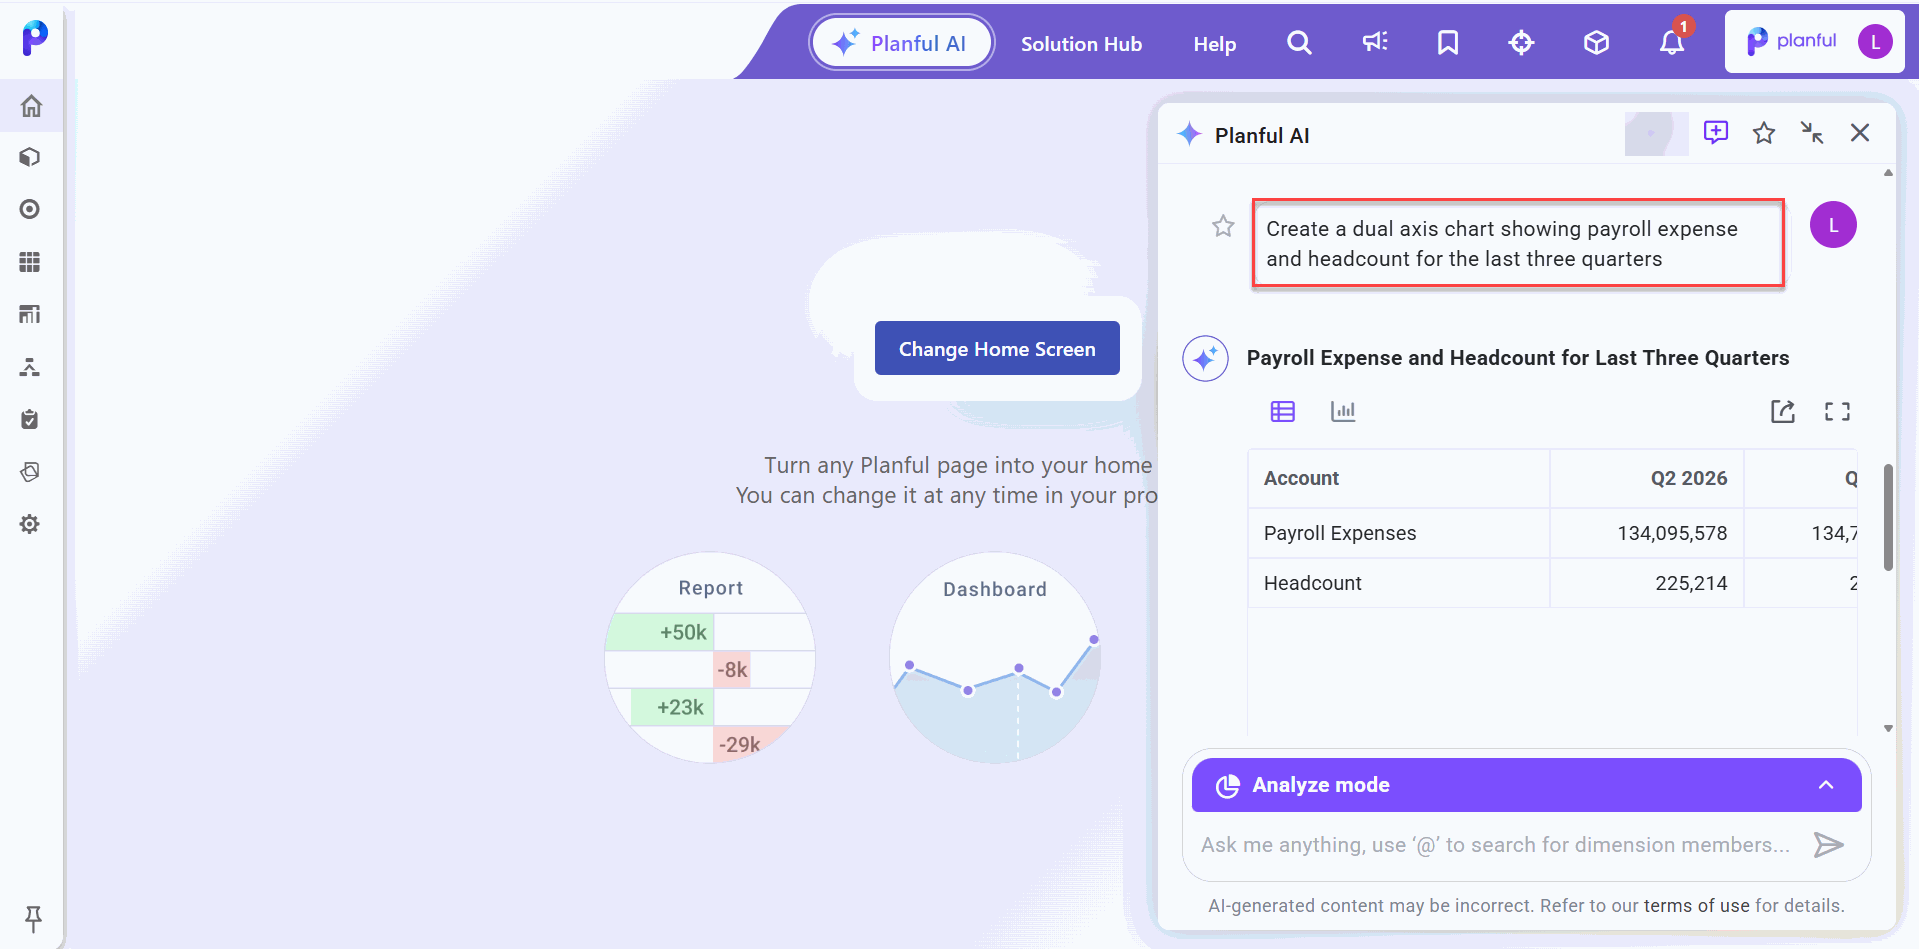
Dual Axis and Pie Chart Support
Pie charts for comparing proportions or relative contributions and Dual axis for analyzing two metrics (e.g., revenue vs. expense) side by side in a single view.
September’25 Release
Planful AI Analyst: Dimension Member Autocomplete
You can now use the type-ahead suggestions to quickly select the required dimension member, reducing ambiguity and speeding up asking questions.
.gif)
October’25 Release
Planful AI: Activity Log
The new Planful AI Activity Log gives admins visibility into how users interact with the AI Assistant. Available under Maintenance > Application Audit, it can be exported to Excel with details like user, question, time, and feedback. This helps teams track adoption, monitor usage, and drive greater ROI from Planful AI.
.gif)
Planful AI: Variance Sign Alignment with Account Properties
Planful AI now aligns variance signs with Account Properties, ensuring results correctly reflect financial context across Income, Expense, and Statistical accounts. For example, if expenses exceed budget by $50K, AI displays –$50K; if under budget, it shows $50K.
Note: Contact Planful Support to enable this feature flag.
.gif)
Was this article helpful?