Reporting and Analysis Primer
- 1 Minute to read
- Print
- DarkLight
- PDF
Reporting and Analysis Primer
- 1 Minute to read
- Print
- DarkLight
- PDF
Article summary
Did you find this summary helpful?
Thank you for your feedback
If you have never created views in Spotlight, this section provides a primer.
In Practice
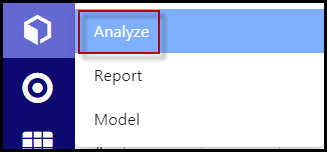
From the Model icon, select Analyze.
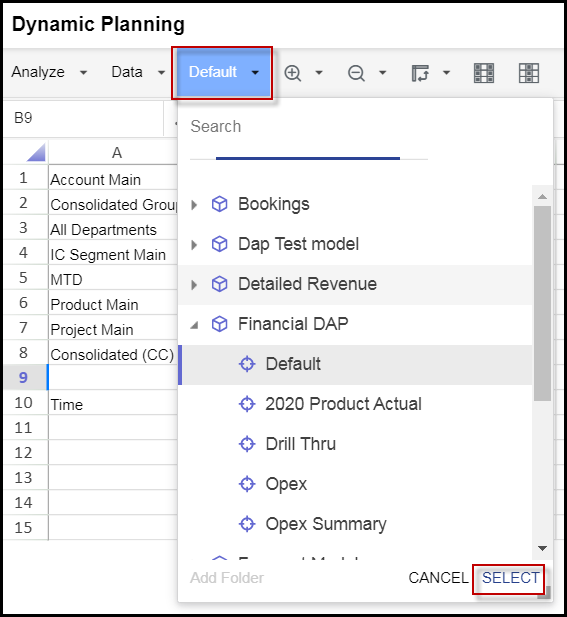
From the View drop-down, look for the model you just created, click the Default view, and click Select.
The default view shows all the dimensions in the model. These dimensions should be familiar to you because they come from the Financial Reporting Area.
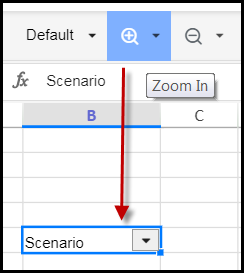
You can select a dimension name, and then click Zoom In and Zoom Out on dimensions that appear as headings for the rows and columns.
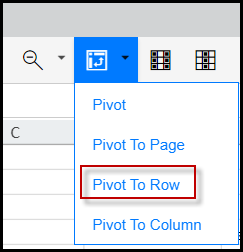
To move a dimension from the upper left into the row and column area, select the dimension, then select Pivot, Pivot to Row, or Pivot to Column.
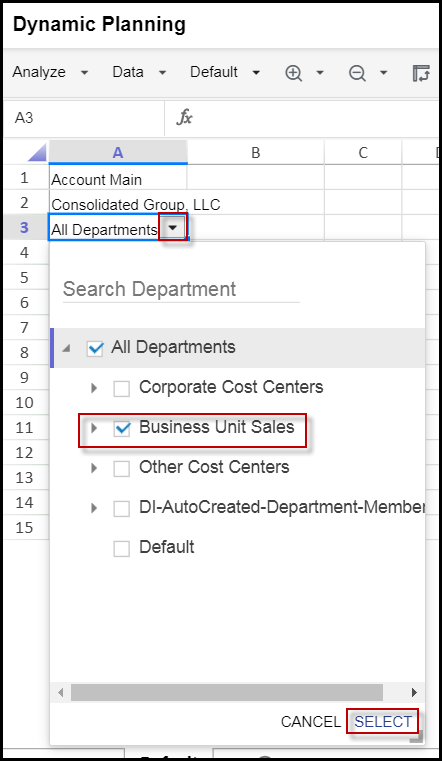
Click the drop-down next to a dimension to select a member of that dimension, then click Select.
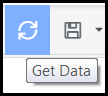
To refresh the data, click Get Data.
Continue placing dimensions where you want them on the report and clicking Zoom In or Zoom Out to refine the look of the view.
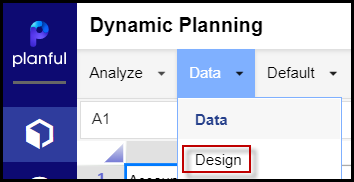
When you are done, click Design from the Data menu.
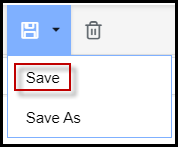
Click Save and give the view a name.
Click Data from the Data menu to exit Design mode.
You can create as many views as you want and save them as part of the model.
You can also create Reports, Excel Reports, and Snapshots from SpotlightXL.
Note:
There is no option for Save Data, Breakback, Drill-Through, or Calc on Save. This is because the model that connects to PCR is read-only from within Dynamic Planning. However, if you create a report that contains data from multiple models and one of those models is not connected directly to PCR, the data from that model can be saved.
Was this article helpful?