Cube Settings Summary
- 19 Minutes to read
- Print
- DarkLight
- PDF
Cube Settings Summary
- 19 Minutes to read
- Print
- DarkLight
- PDF
Article summary
Did you find this summary helpful?
Thank you for your feedback
Cube Settings is accessed by navigating to Maintenance > Reports > Cube Settings. There are 5 application pages that make up Cube Settings (shown below). Each of the application pages (tabs) is discussed in detail below.
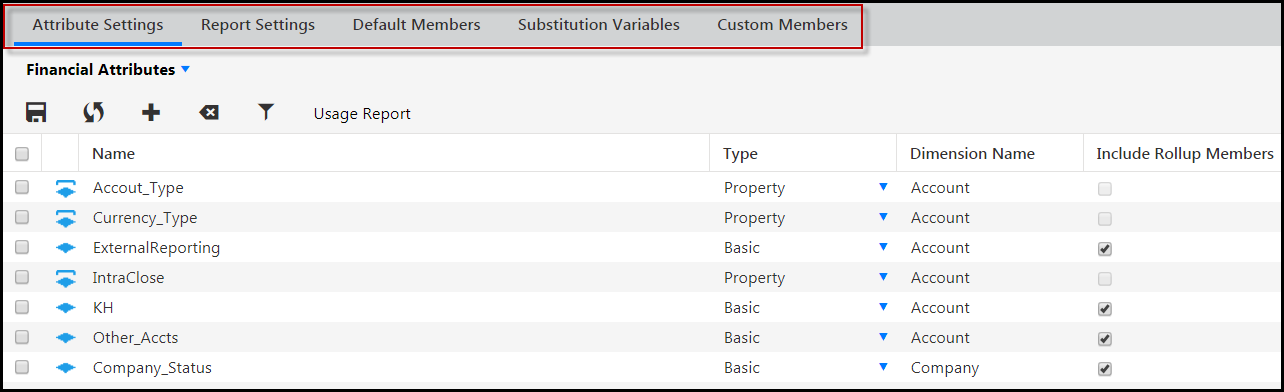
Attribute Settings
What are Attributes and How are They Used
Attributes and attribute hierarchies are mapped to reporting cubes for reporting purposes. You can map attributes as either attribute hierarchies or properties, with up to ten attributes and hierarchies per Financial reporting cube and ten for the Sales reporting cube (twenty total). Attributes can be used just like dimensions (for example, sliced and diced across axes and drilled down upon).
You can add any remaining attributes (those in addition to the 10 per cube) created on dimensions as member properties. There is no limit to the number of properties that can be mapped. Attributes mapped as properties cannot be drilled upon. Properties show up as notes on a report. They can be included as mapped properties in the report setup for a Dynamic Report. When you run the report, they’re displayed.
Attribute Settings are processed in the cloud so that you can continue working while processing takes place. Once complete, you will be notified.
Note:
You cannot map properties for the Workforce Reporting Area.
Mapping and Unmapping Workforce Planning Default Measures for Reporting Purposes
All default measures are enabled for selection on the Attribute Settings page so that you can map and unmap them to and from the reporting area. If you did not want to include annual salary or bonus, for example, in a Dynamic Report, you can hide them from the Measure dimension.
In Practice:
To Map Workforce Planning Default Measures from Attribute Settings Screen:
Navigate to Maintenance > Reports > Cube Settings.
The first tab is displayed when the screen opens, which is Attribute Settings.
Select Workforce Attributes from the list-box.
Click the Add button to select measures to map.
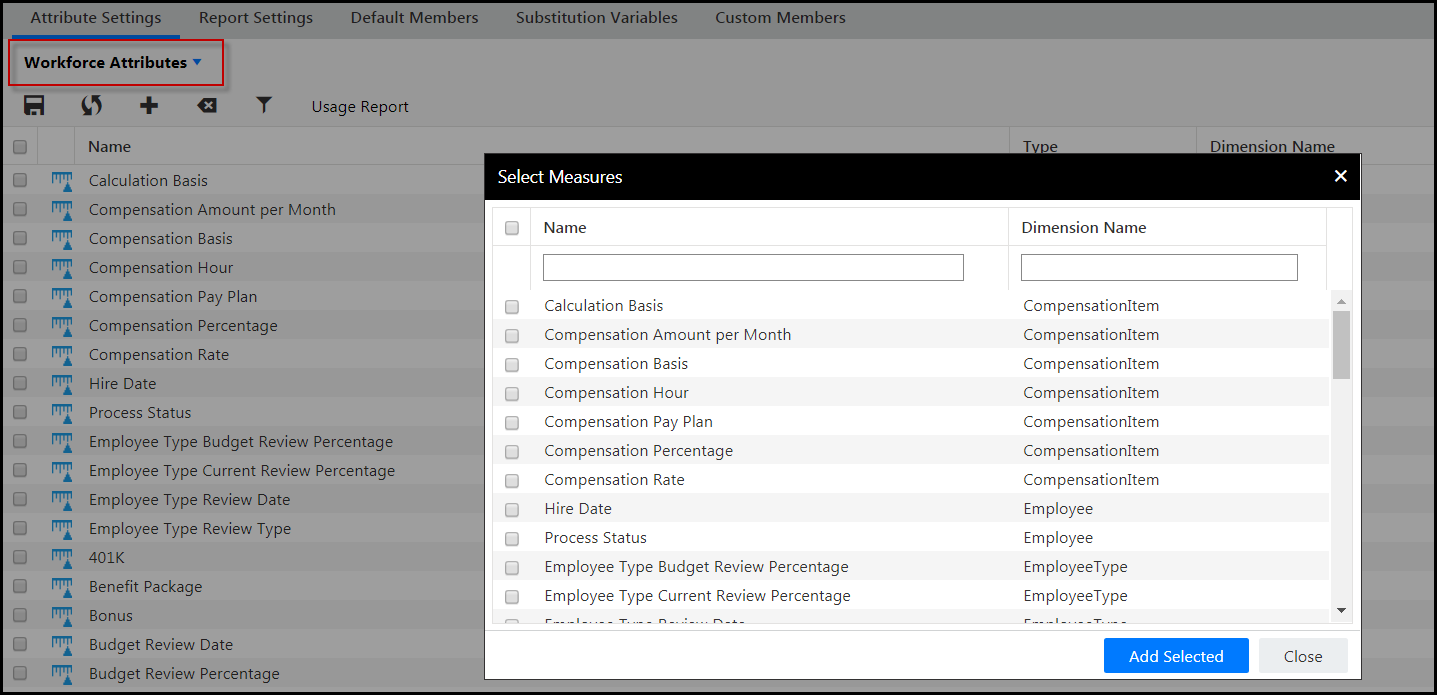
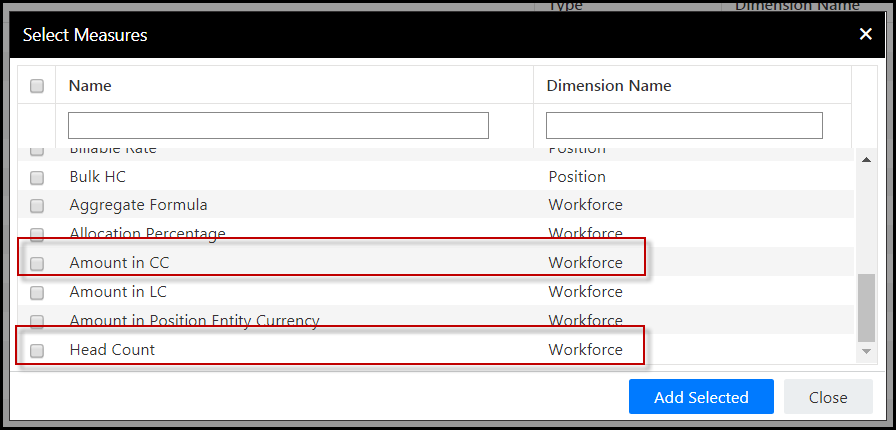
You MUST map Amount in CC (Common Currency), Headcount and any one of the measures each from the Position and Employee dimensions to take advantage of Workforce Reporting. See images below.
Click Add Selected.
Click Save.
Unmapping Measures
Not all measures can be unmapped. You will receive an informational message for measures that cannot be unmapped. Workforce Reporting measures (Amount in CC, Headcount and any one of the measures each from the Position and Employee dimensions) are required to be mapped.
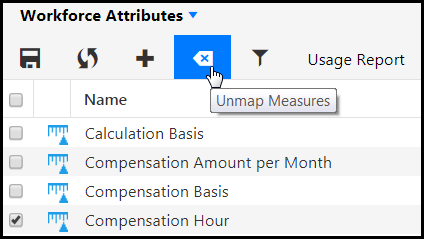
To Unmap Measures:
Click the checkbox next to the measure you want to unmap.
Click the Unmap Measures button shown below.
Report Settings
Overview
This is where you enter the maximum number of formula exceptions. Exceptions include invalid formulas. The maximum number of formula exceptions that can be configured is 999.
What is the Purpose of Formula Exceptions
Use formula exceptions to override the calculations performed on report results.
Default Members
What are Default Members
When you run a Dynamic Report, the system expects values for each dimension mapped to the cube, regardless if you use the dimension in the report. For this reason, default values are automatically created for each dimension.
How to Edit Default Members
- Navigate to Maintenance >Reports >Cube Settings.
- Click the Default Members tab.
- Select a Reporting Area (Financial, Sales, etc.) The pre-defined default members for each dimension appear under the Default Member Name column, listing the root node value in the hierarchy (e.g., Department Main for Department dimension).
- Click the Change Default Member icon for the dimension default member you want to edit. The Hierarchy screen appears.
- Navigate through the hierarchy and highlight the member of the hierarchy you want to assign as default.
- Click Select. The change appears under the Default Member Name column.
Note:
When you update the default member for a secured dimension, ensure that all reporting users have access to the new member, otherwise they will not be able to design or run reports using the Reporting Area
Substitution Variables
What are Substitution Variables
Substitution variables are used in the creation of Dynamic Reports and Report Sets. A substitution variable replaces a complex multi-dimensional expression (Rule) with a specified value. Substitution variables must be added to Report Sets as lines to be reflected in reports. Planful provides over 40 system-defined substitution variables.
The purpose of using a substitution variable is to:
Improve report performance
Improve Report Set maintainability
Dynamically display report column/row headers
How to Access the Substitution Variable Page
To access the Substitution Variable page, navigate to Maintenance > Reports > Cube Settings and click the Substitution Variables tab.
How to Add a Substitution Variable to Use in a Reporting Formula
- Navigate to Maintenance > Reports > Cube Settings and click the Substitution Variables tab.
- Click the Add icon.
- Enter an identifier in the Code field.
- Select the reporting area where you want the substitution variable defined.
- Select the dimension where you want the substitution variable defined.
- Select the Substitution Value by opening the Hierarchy dialog page. Use the hierarchy or filter functions to search for, and select, a specific value.
- Click Save.
What are Derived Variables
Derived Variables contain a formula that references a Substitution Variable and derives an appropriate value by evaluating the formula.
In Practice
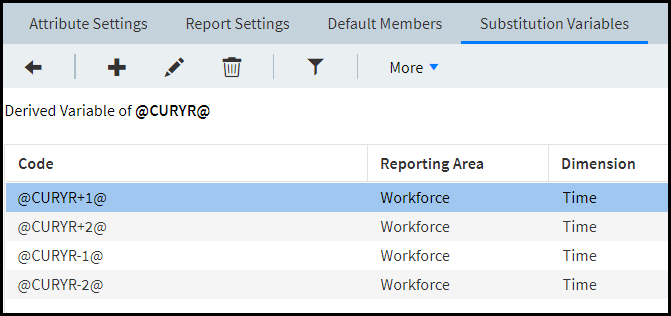
In the example below @CURYR@ is the substitution variable, which displays the current year for the Workforce reporting area. Derivatives of @CURYR@ are:
@CURYR+1@ = pulls data for the year following the current year
@CURYR+2@ = pulls data for 2 years from the current year
Description of Fields on the Substitution Variable Page
Grid Fields
Code - The name of the substitution variable as used in reporting formulas.
Reporting Area - The reporting area where the substitution variable is defined.
Dimension - The dimension where the substitution variable is defined.
Value - The value a substitution variable points to.
Derived Variables - The number of derivatives for the selected variable.
Substitution Variables Explained with Examples
A substitution variable contains a Name and Value pair. For example:
Substitution Variable Name: @CURMNTH@
Substitution Variable Value: Jan-2018
The Substitution Variable Name is replaced by its Value when the report is executed, thereby making reporting flexible. In the example above, you may create a report column using a the @CURMNTH@ Substitution Variable. When the report is executed the Name is substituted by its Value (i.e. Jan-2018).
In Practice
Let's say you want to create a Rule for the following:
Prior Year Quarter 1
Prior Year Quarter 2
Prior Year Quarter 3
Prior Year Quarter 4
Q1 Prior year – Openingperiod(Ancestor(Parallelperiod(year,1,Time.CurrentMember),year))
Q2 Prior year - Openingperiod(Quarter,Ancestor(Parallelperiod(year,1,Time.CurrentMember),year)).lead(1)
Q3 Prior year - Openingperiod(Quarter,Ancestor(Parallelperiod(year,1,Time.CurrentMember),year)).lead(2)
Q4 Prior year - Openingperiod(Quarter,Ancestor(Parallelperiod(year,1,Time.CurrentMember),year)).lead(3)
You can also create prior year quarters as derived variables on the @CURQTR@ substitution variable:
@PRYRQTR1@ - Openingperiod(Quarter,Ancestor(Parallelperiod(year,1,@CURQTR@),year))
@PRYRQTR2@- Openingperiod(Quarter,Ancestor(Parallelperiod(year,1,@CURQTR@),year)).lead(1)
@PRYRQTR3@- Openingperiod(Quarter,Ancestor(Parallelperiod(year,1,@CURQTR@),year)).lead(2)
@PRYRQTR4@- Openingperiod(Quarter,Ancestor(Parallelperiod(year,1,@CURQTR@),year)).lead(3)
Substitution Variables can be used on any of the dimensions or attributes available and in any of the reporting areas. You cannot create a substitution variable that includes multiple dimensions, however, you can add multiple dimensions while defining static report sets. For example, if you want to define November MTD you can set the Rule to (@CURMTH@,[Measures].[MTD]) in your report set. If you want to set November for a selected department you might use the following (@CURMTH@,@CURDEPT@).
Attributes and attribute hierarchies mapped on the Attribute Settings page are available in the Financial and Scorecard Reporting Area. Attributes mapped to properties are not available.
Types of Substitution Variables
Standard Substitution Variables:Standard Substitution Variables point to a value, which can be updated by a Reporting Administrator using the Substitution Variable page located under the Maintenance menu. Substitution Variables can be established for any of the dimensions or attributes available in any of the reporting areas.
For example, variable @CURYR@ contains the year value 2018, which internally points to the appropriate Time dimension member such as [Time].&[5045]. The value is used on column headers and the dimension member is used in MDX expressions.
- Derived Variables:Derived Variables contain a formula which references a Substitution Variable and derives an appropriate value by evaluating the formula.
For example, A Derived Variable named ‘@CURMTH -1@’ can:
Reference the following Substitution Variable: @CURMTH@.
Contains a formula, such as: @CURMTH.Lag(1).
Will result in the month preceding the Current Month based on setup.
At run time @CURMTH.Lag(1) is evaluated based on the value of @CURMTH@.
Generally, the value is used for column headers and the dimension member is used in MDX expressions.
How to Set Up Substitution Variables
- Navigate to Maintenance > Reports > Cube Settings and click the Substitution Variables tab.
- Review the list of substitution variables delivered with the application.
- Click the Add button to setup a new substitution variable on the Add Substitution Variable page.
- Complete the fields on the Add Substitution Variable page. Note that substitution variables are defined for a reporting area and dimension.
- Select the newly added substitution variable on the list page and click the Derived Variables button to view the corresponding derived variables.
- Add new derived variables by clicking the Add button on the Derived Variables list page.
- The Add Derived Variable page is opened. Complete the fields on this page.
- Click Save.
Substitution variables are used in the creation of Dynamic Reports. A substitution variable replaces a complex multi-dimensional expression (Rule) with a specified value. Substitution variables must be added to Report Sets as lines to be reflected in reports. Planful provides over 40 system-defined substitution variables.
Here is a list of places where you can use substitution variables:
In Rules and on Row or Column Labels and Headers
To Dynamically Display Report Set Lines
As an Efficient Way to Replace Formula Exceptions
In Combination with Static Text
To Improve Report performance by Avoiding the Use of Calculated or Measured Dimensions when Building Column Sets
To Improve Report Performance Instead of Reporting Scenario Functionality
To Improve Efficiency in Building Report Sets
To Overcome Rule Limitations
As an Efficient Way to Replace Formula Exceptions
Example: To display the current period in the column header of a report, replace the column set’s line name with a substitution variable, such as @CURMTH@. When the report is run, @CURMTH@ will be replaced with the actual month name Mar-10.
In Combination with Static Text
Examples:
YTD~ @CURMTH@ will display YTD~ Jan-18
@CURYR@Actual will display 2018 Actual
To Improve Report Performance by Avoiding the Use of Calculated or Measured Dimensions when Building Column Sets
The following Report Set is commonly used:
| YTD | MTD | ||||
| Actual | Budget | Variance | Actual | Budget | Variance |
Setting up this Report Set requires the usage of complex Rules that typically require a column set on a Calculated or Measured dimension and utilizes the Reporting scenario for the Budget column. The following table displays commonly used formulas to deliver report columns.
Line Name | Formula Without Substitution Variables |
|---|---|
YTD~Actual | ([Measures].[YTD],[Scenario].&[1],[Calculated].&[1]) |
YTD~Budget | ([Measures].[YTD],StrToMember ("Scenario.&["+Time.Currentmember.properties("Budget_Id")+"]")),[Calculated].&[1]) |
YTD~Variance | Custom Formula |
MTD~Actual | ([Measures].[MTD],[Scenario].&[1] ,[Calculated].&[1]) |
MTD~Budget | ([Measures].[MTD],StrToMember ("Scenario.&["+Time.Currentmember.properties("Budget_Id")+"]")),[Calculated].&[1]) |
MTD~Variance | Custom Formula |
While the rules above deliver the expected result, they are complex. This complexity adversely impacts report performance. The same report can be set up more efficiently using Substitution Variables. The table below displays how Substitution Variables compare to the formulas in the table above.
Line Name | Formula with Substitution Variables |
|---|---|
YTD~Actual | ([Scenario].&[1] ,[Measures].[YTD]) |
YTD~Budget | (@CURBGT@,[Measures].[YTD]) |
YTD~Variance | Custom Formula |
MTD~Actual | ([Scenario].&[1],[Measures].[MTD]) |
MTD~Budget | (@CURBGT@,[Measures].[MTD]) |
MTD~Variance | Custom Formula |
Performance for the Report Set depicted in the table above can be improved by moving the repeated member on the Page axis. The Report Set above uses [Measures].[MTD] and [Measures].[YTD] frequently. Move one of these members to the page level. For example, use the member [Measures].[YTD] on the Page axis rather than repeating [Measures].[YTD] on the first and second lines as shown in the table below.
Line Name | Formula with Substitution Variables |
|---|---|
YTD~Actual | [Scenario].&[1] |
YTD~Budget | @CURBGT@ |
YTD~Variance | Custom Formula |
MTD~Actual | ([Scenario].&[1],[Measures].[MTD]) |
MTD~Budget | (@CURBGT@,[Measures].[MTD]) |
MTD~Variance | Custom Formula |
To improve report performance instead of reporting scenario functionality
When using reporting scenario functionality to retrieve the budget and forecast for a selected year, you might use the following rule.
StrToMember ("Scenario.&["+Time.Currentmember.properties("Budget_Id")+"]"))
While the rule above delivers the expected result, it slows report performance. A performance improvement is to use Substitution Variables as described below.
Line Name | Previous Approach to Formula | Formula with Substitution Variables |
|---|---|---|
Line Name | Previous Approach to Formula | Formula with Substitution Variables |
Current Budget | StrToMember ("Scenario.&["+Time.Currentmember.properties("Budget_Id")+"]")) | @CURBGT@ |
Current Forecast | StrToMember ("Scenario.&["+Time.Currentmember.properties("forecast_Id")+"]")) | @CURFCST@ |
Current Month Budget | (Time.Currentmember,StrToMember ("Scenario.&["+Time.Currentmember.properties("Budget_Id")+"]")),[CalculatedDim].&[1]) | (@CURMTH,@CURBGT) |
Prior Year YTD | (Parallelperiod(Year,1,Time.currentmember),[Measures].[YTD]) | (@PREVYEAR@,[Measures].[YTD]) |
To improve efficiency in building report sets
Substitution Variables aide in the setup and maintenance of time-based Report Sets, such as Trailing 12 months, along with Budget and Forecast columns. The following example displays a Trailing 12-month Report Set:
Line Name | Previous Approach to Rule | Rule with Substitution Variables |
|---|---|---|
Line Name | Previous Approach to Rule | Rule with Substitution Variables |
Current Month | (Time.Currentmember,[CalculatedDim].&[1]) | @CURMTH@ |
Current Month - 1 | (Time.Currentmember.Lag(1),[CalculatedDim].&[1]) | @CURMTH-1@ |
Current Month - 2 | (Time.Currentmember.Lag(2),[CalculatedDim].&[1]) | @CURMTH-2@ |
Current Month - 3 | (Time.Currentmember.Lag(3),[CalculatedDim].&[1]) | @CURMTH-3@ |
Current Month - 4 | (Time.Currentmember.Lag(4),[CalculatedDim].&[1]) | @CURMTH-4@ |
Current Month - 5 | (Time.Currentmember.Lag(5),[CalculatedDim].&[1]) | @CURMTH-5@ |
Current Month - 6 | (Time.Currentmember.Lag(6),[CalculatedDim].&[1]) | @CURMTH-6@ |
Current Month - 7 | (Time.Currentmember.Lag(7),[CalculatedDim].&[1]) | @CURMTH-7@ |
Current Month - 8 | (Time.Currentmember.Lag(8),[CalculatedDim].&[1]) | @CURMTH-8@ |
Current Month - 9 | (Time.Currentmember.Lag(9),[CalculatedDim].&[1]) | @CURMTH-9@ |
Current Month - 10 | (Time.Currentmember.Lag(10),[CalculatedDim].&[1]) | @CURMTH-10@ |
Current Month - 11 | (Time.Currentmember.Lag(11),[CalculatedDim].&[1]) | @CURMTH-11@ |
Current Month - 12 | (Time.Currentmember.Lag(12),[CalculatedDim].&[1]) | @CURMTH-12@ |
Current Budget | (Ancestor(Time.Currentmember,1,Year), StrToMember ("Scenario.&["+Time.Currentmember.properties("Budget_Id")+"]")),[CalculatedDim].&[1]) | (@CURYR@,@CURBGT) |
Current Forecast | (Ancestor(Time.Currentmember,1,Year), StrToMember ("Scenario.&["+Time.Currentmember.properties("forecast_Id")+"]")),[CalculatedDim].&[1]) | (@CURYR@,@CURFCST) |
To overcome Rule Limitations
You cannot use the same dimension on two axes simultaneously. For example, a report that requires a Report Set on the Time dimension, will not allow selection of Time dimension members at the Page level. To set up a trailing 12-month report, define the column set on either the Calculated or Measure dimension. Time should be on the Page axis. This setup does not use substitution variables so performance will not be optimal. With Substitution Variables, the report column set can be set up on the Time dimension directly and the required selections can be made using Substitution Variables, which will result in improved performance.
How to Transition Existing Reports to Use Substitution Variables
Transition an existing report to utilize Substitution Variables to take advantage of the following benefits:
Improve Financial report performance.
Improve the ease and maintenance of Report Sets.
Display the report column/row headers dynamically.
Provide you with additional flexibility in changing report parameters.
Substitution Variables and their derivatives may be found by navigating to Maintenance > Reports > Cube Settings, Substitution Variables. This list displays system-defined variables, as well as any custom variables you create.
Complete the following steps to transition your existing reports to Substitution Variables:
- Review the report and corresponding row and column set(s) in order to determine how you want to proceed. For example, if the column set is built on the measures dimension or calculated dimensions, consider how the report may be modified to use time or scenario on the column. Also consider using Substitution Variables in column headers and row titles.
- Make a copy of the existing report prior to beginning the transition. This copy will be modified during the transition, but you can compare the end result with the original report/report set(s) to validate data.
- If you plan to change the dimension upon which the report set is built, you must create a new report set as it is not possible to change an existing report set to run on a different dimension. If you plan to use the same dimension for your new report set, you may copy the original report set. This copy will be modified during the transition and you can then compare the end result with the original report/report sets to validate data.
- Modify the formulas on the Advanced Rule page from the current string to include the appropriate Substitution Variables. For example; In a rolling twelve month column set, you can remove the expression “Time.CurrentMember.lag(1)” and replace it with “@CURMTH-1@” for the column pulling the last month’s data.
- Modify the column headers/row titles as necessary. A column previously titled using Formula Exceptions to display the appropriate month or hardcoded to fixed text can be replaced with a Substitution Variable in the column header within the column set. This header may include the Substitution Variable alone, or included with static text. For example; If the month is May, the column header within the column set may be “@CURMTH-2@” to display “March.” Or, it may be “YTD @CURMTH-2@” to display “YTD March.”
- Save the copied and modified report set. Adjust the dimensions on the copied report if you created new report sets to accommodate the Substitution Variables. When you have the report highlighted within the Reports file cabinet, select “Setup” to view the Report Details and Report Settings. For example, you may need to move one dimension to the Page (such as Measures) and another to the Column (such as time) to use the new column set.
- Run the newly transitioned report. Compare the results to the original report/report set(s) and make adjustments if necessary. You may change the values of the Substitution Variables at run time, however, these changes will not be saved with the report.
- In addition, moving highly repeated members of Rules to the page level will improve report performance. If “*Measures+.*MTD+” is used in many of the Rule within a report set, you may move Measures to the page and include the measures dimension in the Rule only in fields where you do not want MTD.
- Delete or rename the original report, which is no longer in use. Rename the transitioned report accordingly.
Use of Substitution Variables in Dynamic Reports
Substitution variables displayed are filtered based on Reporting Area. For example, @CURBDGT@ may be defined under the Financial Reporting Area and therefore can only be used if you select Financial as the Reporting Area while creating a Dynamic Report.
System-Defined Substitution Variables
The following Substitution Variables are available in your application by default.
Variable Name | Variable Type | Purpose | |
|---|---|---|---|
1 | @CURMTH@ | Substitution Variable | Current Month |
2 | @CURMTH+1@ | Derived Variable | Next Month |
3 | @CURMTH+2@ | Derived Variable | 2 Months after Current Month |
4 | @CURMTH+3@ | Derived Variable | 3 Months after Current Month |
5 | @CURMTH+4@ | Derived Variable | 4 Months after Current Month |
6 | @CURMTH+5@ | Derived Variable | 5 Months after Current Month |
7 | @CURMTH+6@ | Derived Variable | 6 Months after Current Month |
8 | @CURMTH+7@ | Derived Variable | 7 Months after Current Month |
9 | @CURMTH+8@ | Derived Variable | 8 Months after Current Month |
10 | @CURMTH+9@ | Derived Variable | 9 Months after Current Month |
11 | @CURMTH+10@ | Derived Variable | 10 Months after Current Month |
12 | @CURMTH+11@ | Derived Variable | 11 Months after Current Month |
13 | @CURMTH+12@ | Derived Variable | 12 Months after Current Month |
14 | @CURMTH-1@ | Derived Variable | Previous Month |
15 | @CURMTH-2@ | Derived Variable | 2 Months prior to Current Month |
16 | @CURMTH-3@ | Derived Variable | 3 Months prior to Current Month |
17 | @CURMTH-4@ | Derived Variable | 4 Months prior to Current Month |
18 | @CURMTH-5@ | Derived Variable | 5 Months prior to Current Month |
19 | @CURMTH-6@ | Derived Variable | 6 Months prior to Current Month |
20 | @CURMTH-7@ | Derived Variable | 7 Months prior to Current Month |
21 | @CURMTH-8@ | Derived Variable | 8 Months prior to Current Month |
22 | @CURMTH-9@ | Derived Variable | 9 Months prior to Current Month |
23 | @CURMTH-10@ | Derived Variable | 10 Months prior to Current Month |
24 | @CURMTH-11@ | Derived Variable | 11 Months prior to Current Month |
25 | @CURMTH-12@ | Derived Variable | 12 Months prior to Current Month |
26 | @CURBDGT@ | Substitution Variable | Current Budget |
27 | @CURFCST@ | Substitution Variable | Current Forecast |
28 | @CURQTR@ | Substitution Variable | Current Quarter |
29 | @CURQTR+1@ | Derived Variable | Next Quarter |
30 | @CURQTR+2@ | Derived Variable | 2 Quarters after Current Quarter |
31 | @CURQTR+3@ | Derived Variable | 3 Quarters after Current Quarter |
32 | @CURQTR+4@ | Derived Variable | 4 Quarters after Current Quarter |
33 | @CURQTR-1@ | Derived Variable | Prior Quarter |
34 | @CURQTR-2@ | Derived Variable | 2 Quarters prior to Current Month |
35 | @CURQTR-3@ | Derived Variable | 3 Quarters prior to Current Month |
36 | @CURQTR-4@ | Derived Variable | 4 Quarters prior to Current Month |
37 | @CURYR@ | Substitution Variable | Current Year |
38 | @CURYR+1@ | Derived Variable | Next Year |
39 | @CURYR+2@ | Derived Variable | 2 years after Current Year |
40 | @CURYR-1@ | Derived Variable | Previous Year |
41 | @CURYR-2@ | Derived Variable | 2 Years prior to Current Year |
Derived Variables
What are Derived Variables
Derived variables contain a formula that references a Substitution Variable and derives an appropriate value by evaluating the formula.
For example, you need to set up a derived variable which will result in the month preceding the Current Month.
Use a Derived Variable named @CURMTH -1@, which references a Substitution Variable @CURMTH@ and contains the formula; such as @CURMTH.Lag(1).
Another example may be that you need to set up a derived variable off of substitution variable @CURMTH@ (current month) to list all the days in the month. Your hierarchy is set up where Jan 2017 has 1/1/2017 through 1/31/2017.
Use the following options:
@CurMth@ = Jan-17
@CurMth.Day01@ = @CurMth@.FirstChild
@CurMth.Day02@ = @CurMth@.FirstChild.lead(1)
@CurMth.Day03@ = @CurMth@.FirstChild.lead(2)
Because the Time dimension is not symmetrical, meaning every month does not have the same # of days, you could change @CurMth@ to Feb-17, but since Feb only has 28 days, the last 3 derived variables would get the 1st 3 days in March.
Description of Fields on Derived Variable Page
Code - The identifier of the variable.
Reporting Area/Dimension - Derived Variables utilize the same Reporting Area and Dimension as the Substitution Variable. Each Derived Variable requires the selected Substitution Variable to be part of the formula.
Derived Formula - The value associated with the derived variable.
System-Defined Derived Variables
There are 49 derived variables for the @CURYR@ substitution variable on the Time dimension. These derived variables are available for Financial and Workforce reporting areas.
You can access the derived variables by navigating to Maintenance > Reports > Cube Settings > Substitution Variables > @CURYR@> Derived Variables.
Note:
The derived variables of @CURYR@ are not displayed if the value of @CURYR@ is not set to a valid year.
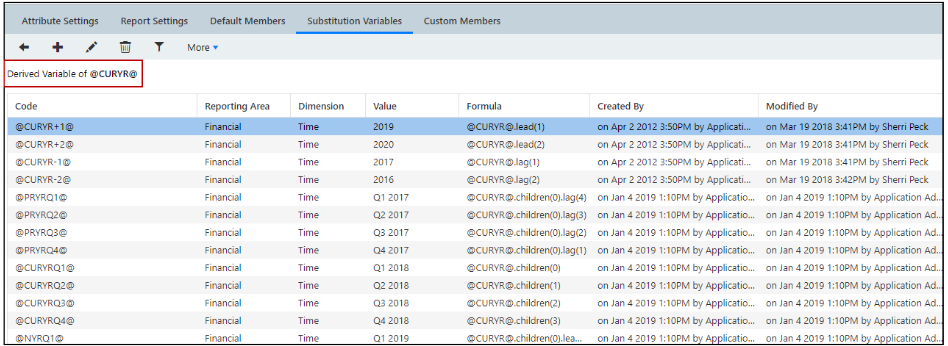
The followings derived variables are available.
Variable Name | Variable Type | Purpose | |
|---|---|---|---|
1 | @CURYRQ1@ | Derived Variable | Quarter 1 |
2 | @CURYRQ2@ | Derived Variable | Quarter 2 |
3 | @CURYRQ3@ | Derived Variable | Quarter 3 |
4 | @CURYRQ4@ | Derived Variable | Quarter 4 |
5 | @NYRQ1@ | Derived Variable | Next year Quarter 1 |
6 | @NYRQ2@ | Derived Variable | Next year Quarter 2 |
7 | @NYRQ3@ | Derived Variable | Next year Quarter 3 |
8 | @NYRQ4@ | Derived Variable | Next year Quarter 4 |
9 | @PRYRQ1@ | Derived Variable | Previous year Quarter 1 |
10 | @PRYRQ2@ | Derived Variable | Previous year Quarter 2 |
11 | @PRYRQ3@ | Derived Variable | Previous year Quarter 3 |
12 | @PRYRQ4@ | Derived Variable | Previous year Quarter 4 |
13 | @CURM01@ | Derived Variable | 1st month of the year |
14 | @CURM02@ | Derived Variable | 2nd month of the year |
15 | @CURM03@ | Derived Variable | 3rd month of the year |
16 | @CURM04@ | Derived Variable | 4th month of the year |
17 | @CURM05@ | Derived Variable | 5th month of the year |
18 | @CURM06@ | Derived Variable | 6th month of the year |
19 | @CURM07@ | Derived Variable | 7th month of the year |
20 | @CURM08@ | Derived Variable | 8th month of the year |
21 | @CURM09@ | Derived Variable | 9th month of the year |
22 | @CURM10@ | Derived Variable | 10th month of the year |
23 | @CURM11@ | Derived Variable | 11th month of the year |
24 | @CURM12@ | Derived Variable | 12th month of the year |
25 | @NYRM01@ | Derived Variable | 1st month of the next year |
26 | @NYRM02@ | Derived Variable | 2nd month of the next year |
27 | @NYRM03@ | Derived Variable | 3rd month of the next year |
28 | @NYRM04@ | Derived Variable | 4th month of the next year |
29 | @NYRM05@ | Derived Variable | 5th month of the next year |
30 | @NYRM06@ | Derived Variable | 6th month of the next year |
31 | @NYRM07@ | Derived Variable | 7th month of the next year |
32 | @NYRM08@ | Derived Variable | 8th month of the next year |
33 | @NYRM09@ | Derived Variable | 9th month of the next year |
34 | @NYRM10@ | Derived Variable | 10th month of the next year |
35 | @NYRM11@ | Derived Variable | 11th month of the next year |
36 | @NYRM12@ | Derived Variable | 12th month of the next year |
37 | @PRYRM01@ | Derived Variable | 1st month of the previous year |
38 | @PRYRM02@ | Derived Variable | 2nd month of the previous year |
39 | @PRYRM03@ | Derived Variable | 3rd month of the previous year |
40 | @PRYRM04@ | Derived Variable | 4th month of the previous year |
41 | @PRYRM05@ | Derived Variable | 5th month of the previous year |
42 | @PRYRM06@ | Derived Variable | 6th month of the previous year |
43 | @PRYRM07@ | Derived Variable | 7th month of the previous year |
44 | @PRYRM08@ | Derived Variable | 8th month of the previous year |
45 | @PRYRM09@ | Derived Variable | 9th month of the previous year |
46 | @PRYRM10@ | Derived Variable | 10th month of the previous year |
47 | @PRYRM11@ | Derived Variable | 11th month of the previous year |
48 | @PRYRM12@ | Derived Variable | 12th month of the previous year |
49 | @2YRPriorM12@ | Derived Variable | 12th month of 2nd year prior to the current year |
Custom Members
What are Custom Members and How are They Used
Define custom MDX formula members (calculations) for use in Dashboards in one central location. For example, let’s say you define a custom formula for the Account dimension. The formula includes a specific company, department, and account combination. You can access Dashboards and build charts for several Dashboards with the Account dimension for which the formula was built.
The benefit of this feature is that formulas can be reused allowing for rapid chart production and more flexible and complex display of data.
Custom Members can be used on the horizontal or vertical axis within the chart. A few examples of the formulas that you can define and use in Dashboards follows.
To sort products in descending order and returns the top 5 products with the highest values:
TopCount({Order({{{Descendants({[Product].&[1]},,LEAVES)}}},([Time].&[5080],[Measures].[MTD]),desc)},5)
To calculate variance between budget and forecast for the given period using substitution variables:
((@CURBDGT@,@CURMTH@)-(@CURFCST@,@CURMTH@))/(@CURFCST@,@CURMTH@)
To get data for a specific combination of dimension members.
([Account].&[174],[Company].&[109],[Department].&[1])
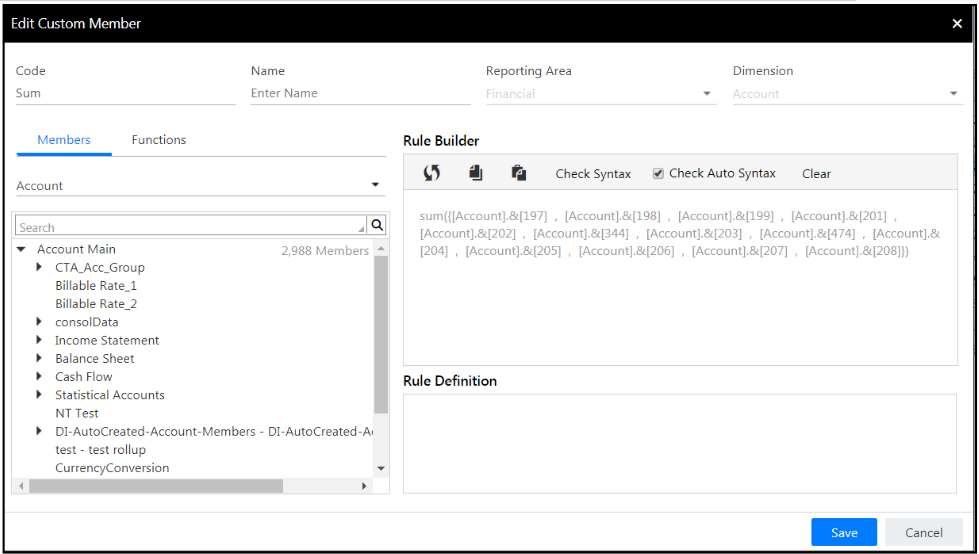
To get the sum of values for accounts.
sum({[Account].&[197] , [Account].&[198] , [Account].&[199] , [Account].&[201] , [Account].&[202] , [Account].&[344] , [Account].&[203] , [Account].&[474] , [Account].&[204] , [Account].&[205] , [Account].&[206] , [Account].&[207] , [Account].&[208]})
For the descendants of a member in the hierarchy and to order them within a hierarchy.
Hierarchize({{Descendants({[Account].&[194]},,LEAVES)}})
To calculate variance between actual and budget using substitution variables.
@ACTUAL@-@CURBDGT@
To calculate variance between the previous month actual and current month budget using substitution variables.
([Scenario].&[1],@CURMTH-1@)-(@CURBDGT@,@CURMTH@)
How to Set Up Custom Members
Create a formula by navigating to Maintenance > Reports > Cube Settings.
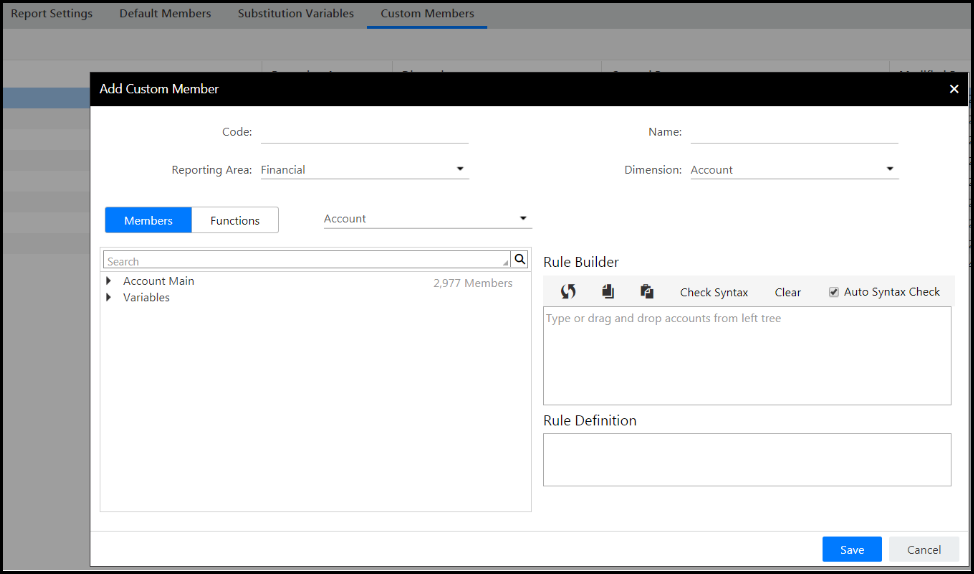
Click the Custom Members tab.

Click Add. The Add Custom Member page displays as shown below.
Enter a code and name.
Select the Reporting Area for which you want to build the formula.
Select Account for Dimension to build the formula on the Account dimension. Or, select any dimension for which you want to build a formula.
Select the Account dimension from the list-box next to the Members / Functions buttons.
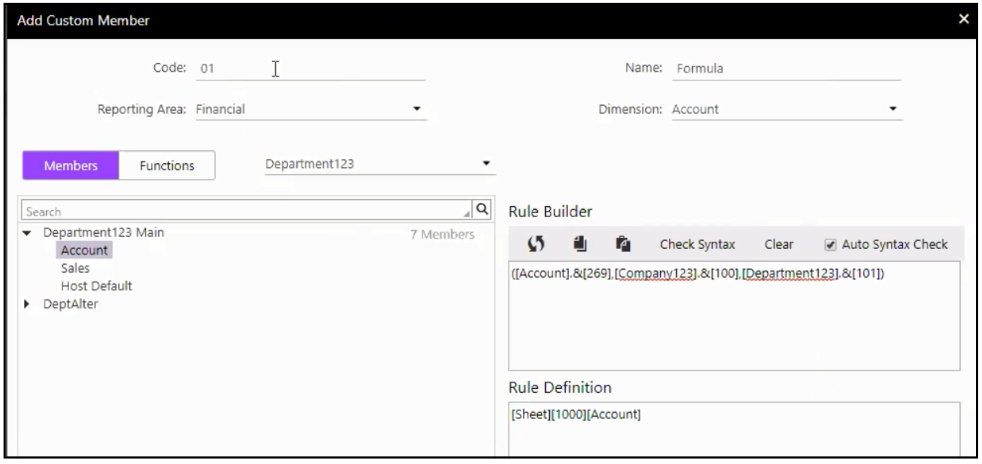
Drag and drop the account dimension member to the Rule Builder pane. In the example below step 13, Balance Sheet (Account 269) is selected.
Select the Company dimension from the list-box next to the Members / Functions buttons.
Drag and drop the company dimension member to the Rule Builder pane. Make sure you add a comma after the account dimension.
Select the Department dimension from the list-box next to the Members / Functions buttons.
Drag and drop the department dimension member to the Rule Builder pane. Make sure you add a comma after the company dimension.
Enclose the rule in parenthesis. The rule is shown below.
Click Save. You just created an MDX formula on the account dimension that pulls data from a combination of account, company, and department. Now, use the formula in a chart in Dashboards.
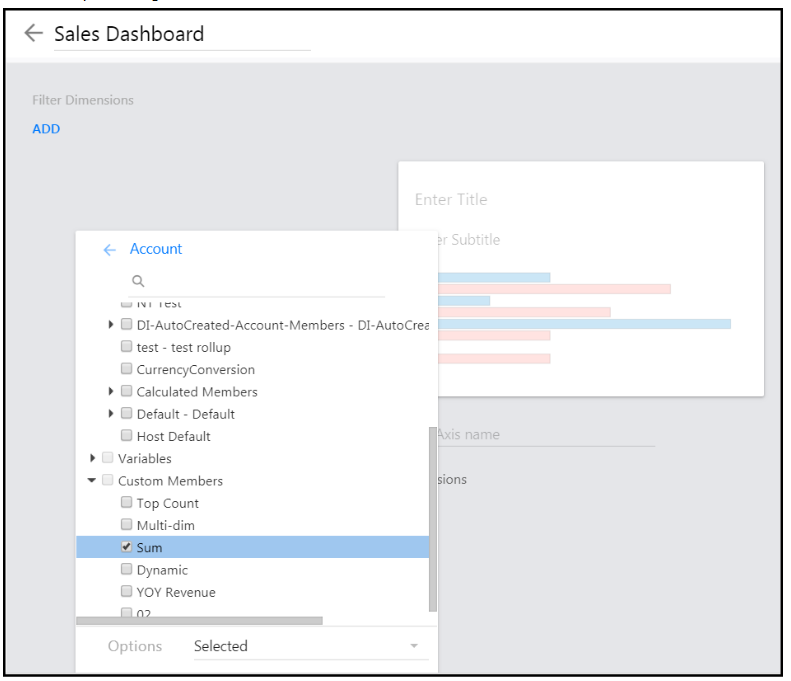
How to Use a Custom Member on a Chart in a Dashboard
Now, you can use this custom member when designing a chart. In this example, a custom member named Sum was created on the Account dimension. It totals several accounts shown in the image below. Use the Sum custom member when the Account dimension is selected for a chart(s).
Access Dashboards.
Drag and drop a chart to the dashboard.
For the x or y axis, select Account for dimension.
Under Custom Members, select the Sum customer member as shown below. Continue to build the chart by selecting additional dimensions and members.
Was this article helpful?