- 17 Minutes to read
- Print
- DarkLight
- PDF
September 18 Release
- 17 Minutes to read
- Print
- DarkLight
- PDF
Planning: Update to Budget Review Column Behavior
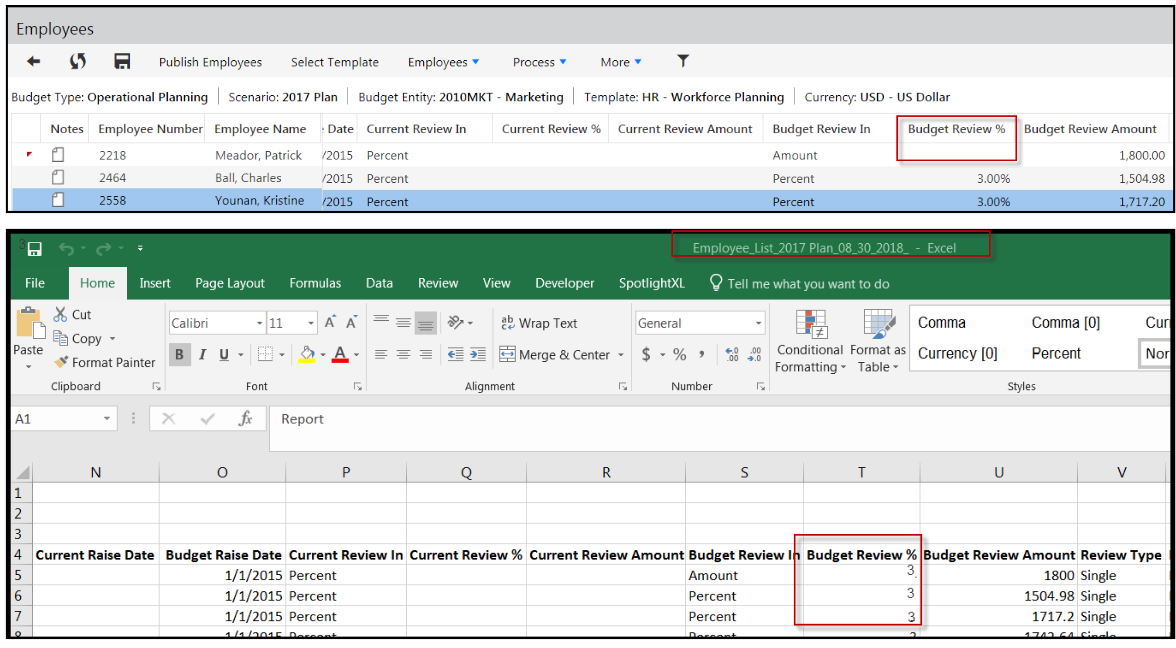
The current behavior is when you select Amount for the Budget Review In field from the Employee list screen for a single employee and enter an amount in the Budget Review Amount field, the Budget Review % does not recalculate, but the % is still shown. For example (using the image below), if you select Amount for Budget Review In and change the Budget Review Amount for Employee named Patrick Meader to 1800.00, the Budget Review % field will still show 3.00%.

With this release, the Budget Review % will be blank when Amount is selected for Budget Review In and the Budget Review Amount is changed. This is because Budget Review % does not recalculate to reflect the percent. For example (using the image above), if you select Amount for Budget Review In for Employee 162 and you change the Budget Review Amount to 5000.00, the Budget Review % field will be blank. It will not show 3.00%. However, when you export this grid (under the More list box) to Excel, the Budget Review % will be displayed in the exported spreadsheet data.
Reporting: Pay Plans Exception Standard Report
The Pay Plans Exception standard report shows the employees that are not mapped to a selected Pay Plan for a selected Scenario and Home Budget Entity. It provides a quick and easy way to examine employee pay plan information.
In Practice:
Navigate to Maintenance > Reports > Standard Reports.
Select the Pay Plans Exception report.
Click More and select Deploy.
Select a folder in the File Cabinet to deploy the report to.
Run the report from the File Cabinet or within the Standard Reports screen.
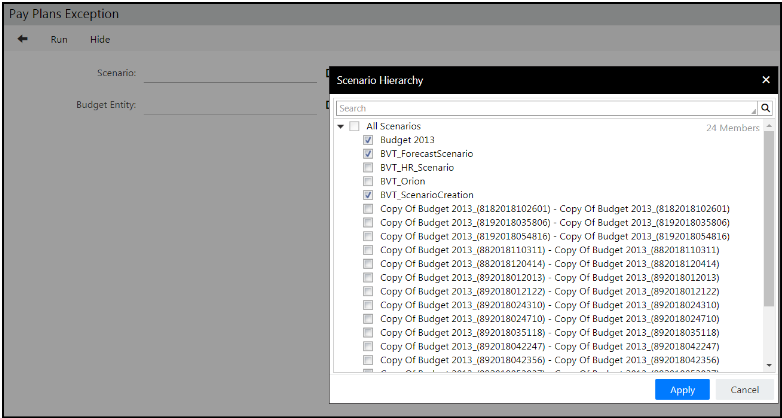
After you click Run, select filters. You can select up to 3 scenarios on the Scenario Hierarchy popup (shown below).
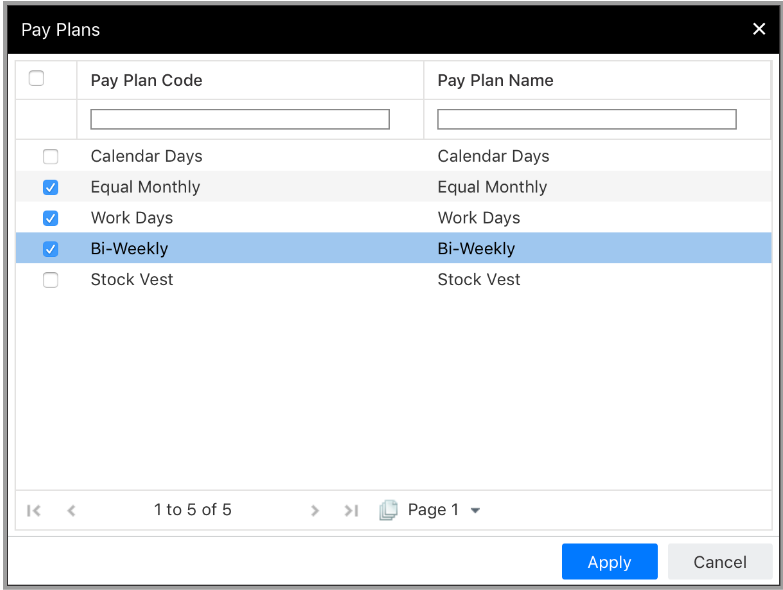
For Budget Entity (home budget entity), select as many entities as needed. For Pay Plan, select as many pay plans exceptions as needed.
For Show Employees, select to include (mapped to selected pay plans) or exclude (not mapped to selected pay plans) the selected Pay Plans (the default is to Exclude) for the selected scenarios and home budget entities.

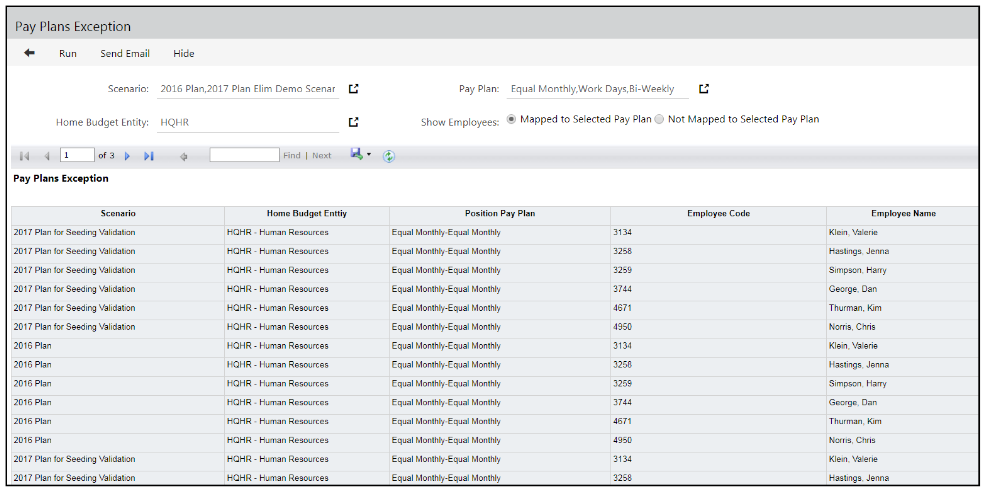
Click Run to execute the report. The report output shown below displays employees mapped to the Equal Monthly, Work Days, and Bi-Weekly pay plan for the HQHR Home Budget Entity and the 2016 Plan and 2017 Plan Elim Demo scenarios.
Reporting: Additional Filters Available for the Subline Data Standard Report
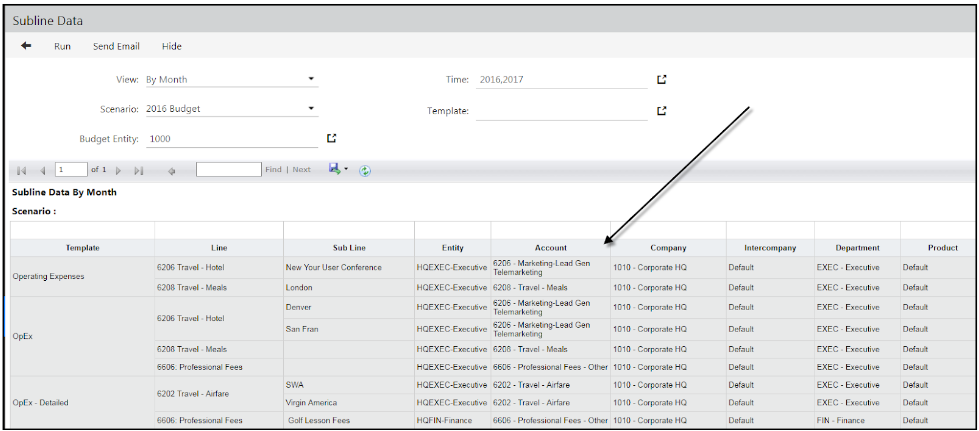
In June 18 we released the Subline Data standard report. With this report, you can report on sublines for templates for a selected scenario and budget entity. With this release, we are enhancing the report by adding Additional Filters for Template and Line Name.
There are two additional filters available for selection prior to running the report. These filters allow for more granular reporting/report output.
On the filter page, shown below select the Template filter. Once selected, the Line Name field is enabled (also shown below). Line Name displays the lines with sublines for the selected template.

View only those sublines for a selected template. The output below is a result of filtering on Template and Line Name.

In comparison, the output below is less granular as Template and Line Name is not filtered.
Reporting: Enhancements and Name Change to Capital Budget by Scenario Standard Report
A quick heads up to everyone, going forward, the Capital Budget by Scenario standard report will be called Capital Budget Analysis to better reflect the output this report offers. This report provides a comprehensive look at your budgeted data for all Capex items in all templates for a specified scenario and entity.

The following enhancements are available:
View by Month or by Scenario
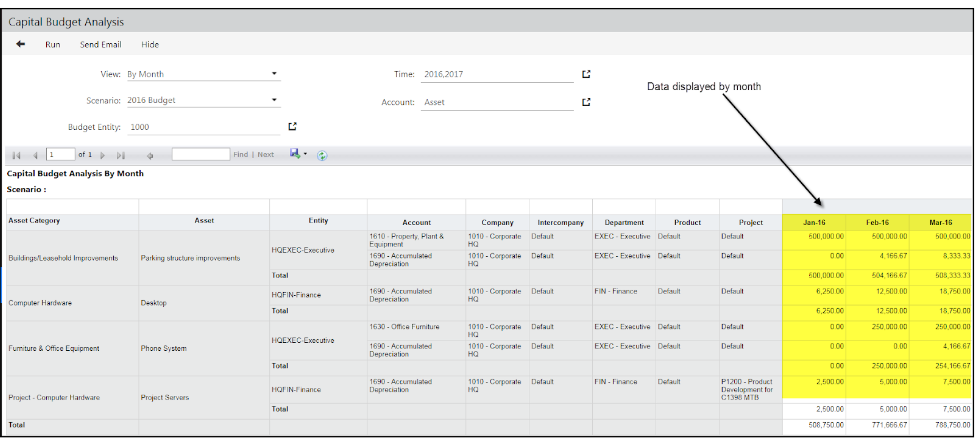
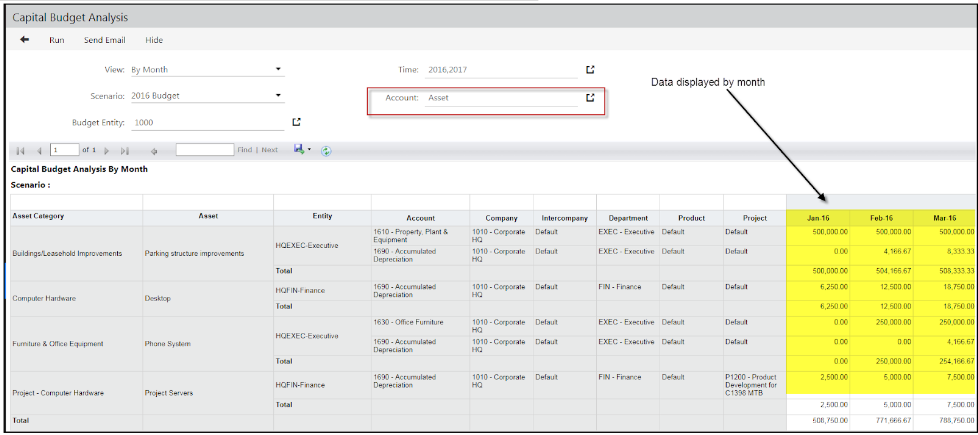
We’ve added two options by which you can filter and view report output, providing the enhanced flexibility to view the report based on month or scenario. In the example below, the filter is set to By Month.

In the example below, data in the report is displayed by month.
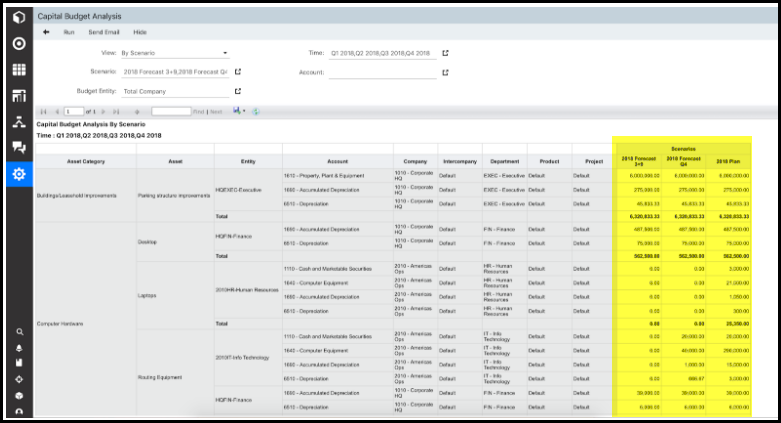
In this example, data is displayed by scenario.
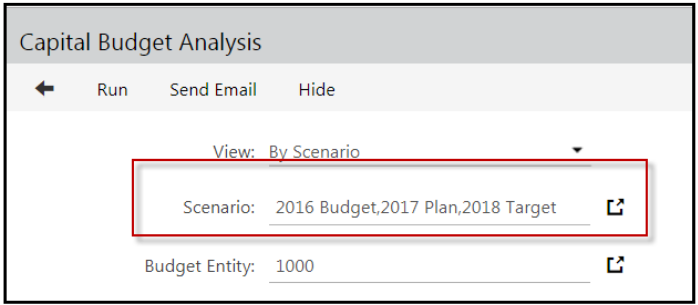
Select up to 3 scenarios when you select View By Scenario. In the example below, 2016 Budget, 2017 Plan, and 2018 Target scenarios are selected.
Filter by Time Dimension
We’ve added a Time filter so that you can display report output based on Time. In the example below, 2016 and 2017 is selected.

Filter by Account Dimension
Filter report output based on the Account dimension filter. In the example below, report data is displayed for the Asset account, for 2016 and 2017, the 1000 budget entity, the 2016 Budget scenario, and the data is displayed by month.
Reporting: Staffing Summary Standard Report
We have fixed an issue related to the Staffing Summary Standard Report. Please re-deploy this report in the File Cabinet (if you have deployed it) so that the fix can be applied to your current environment.
Data Integration: Dimension Security API Update
We updated the Get_Dimension_Security_By_Segment API. Now, if dimension security is enabled at the Parent level, all the children under the selected rollup are provided in the API response. This behavior is consistent with the hierarchy display in reporting when dimension security is applied to a rollup.
Sample request and response calls for the Get_Dimension_Security_By_Segment API is provided below. In the request, dimension security is applied at the Account parent level. In the response, all members of the Account rollup are provided starting with member code 1010.
Request :
<soapenv:Envelope xmlns:soapenv="http://schemas.xmlsoap.org/soap/envelope/" xmlns:ns="http://www.HostAnalytics.com/API/SOAP/StateFree/Common/2009/03/19">

<soapenv:Header/>

<soapenv:Body>

<ns:Get_Dimension_Security_By_Segment>

<!--Optional:-->

<ns:DimensionCode>Account</ns:DimensionCode>

<ns:Model>Financial</ns:Model>

<ns:hasMore>true</ns:hasMore>

<ns:startIndex>200</ns:startIndex>

<!--Optional:-->

<ns:LoginName>skogara@hostanalytics.com</ns:LoginName>

<!--Optional:-->

<ns:Password>Subbu123!</ns:Password>

<!--Optional:-->

<ns:TenantCode>POV</ns:TenantCode>

</ns:Get_Dimension_Security_By_Segment>

</soapenv:Body>

</soapenv:Envelope>
Response:
<soap:Envelope xmlns:soap="http://schemas.xmlsoap.org/soap/envelope/" xmlns:xsi="http://www.w3.org/2001/XMLSchema-instance" xmlns:xsd="http://www.w3.org/2001/XMLSchema">

<soap:Body>

<Get_Dimension_Security_By_SegmentResponse xmlns="http://www.HostAnalytics.com/API/SOAP/StateFree/Common/2009/03/19">

<Get_Dimension_Security_By_SegmentResult>

<SegmentMemberSecurityInfo>

<UserLogin>skogara@hostanalytics.com</UserLogin>

<SegmentMemberCode>1010</SegmentMemberCode>

</SegmentMemberSecurityInfo>

<SegmentMemberSecurityInfo>

<UserLogin>skogara@hostanalytics.com</UserLogin>

<SegmentMemberCode>1020</SegmentMemberCode>

</SegmentMemberSecurityInfo>

<SegmentMemberSecurityInfo>

<UserLogin>skogara@hostanalytics.com</UserLogin>

<SegmentMemberCode>1030</SegmentMemberCode>

</SegmentMemberSecurityInfo>

<SegmentMemberSecurityInfo>

<UserLogin>skogara@hostanalytics.com</UserLogin>

<SegmentMemberCode>1040</SegmentMemberCode>

</SegmentMemberSecurityInfo>

<SegmentMemberSecurityInfo>

<UserLogin>skogara@hostanalytics.com</UserLogin>

<SegmentMemberCode>1050</SegmentMemberCode>

</SegmentMemberSecurityInfo>

<SegmentMemberSecurityInfo>

<UserLogin>skogara@hostanalytics.com</UserLogin>

<SegmentMemberCode>1053</SegmentMemberCode>

</SegmentMemberSecurityInfo>

<SegmentMemberSecurityInfo>

<UserLogin>skogara@hostanalytics.com</UserLogin>

<SegmentMemberCode>1210</SegmentMemberCode>

</SegmentMemberSecurityInfo>

<SegmentMemberSecurityInfo>

</Get_Dimension_Security_By_SegmentResult>

<hasMore>false</hasMore>

</Get_Dimension_Security_By_SegmentResponse>

</soap:Body>

</soap:Envelope>
Data Integration: Box Update
When loading files from Box using a Data Load Rule (DLR), you can load up to 50 files. In the past, you were limited to 20.
Best Practices
Set the Automatic Cube Refresh at the Define Overall Rule Settings step in the Data Load Rule to No.
Set up Cloud Scheduler so that the Scenario process is dependent upon the Data Load Rule.
Process the scenario after loading the Box file and have a separate task for each in Cloud Scheduler (shown in the image below).

Dashboards: Thumbnails Improvement
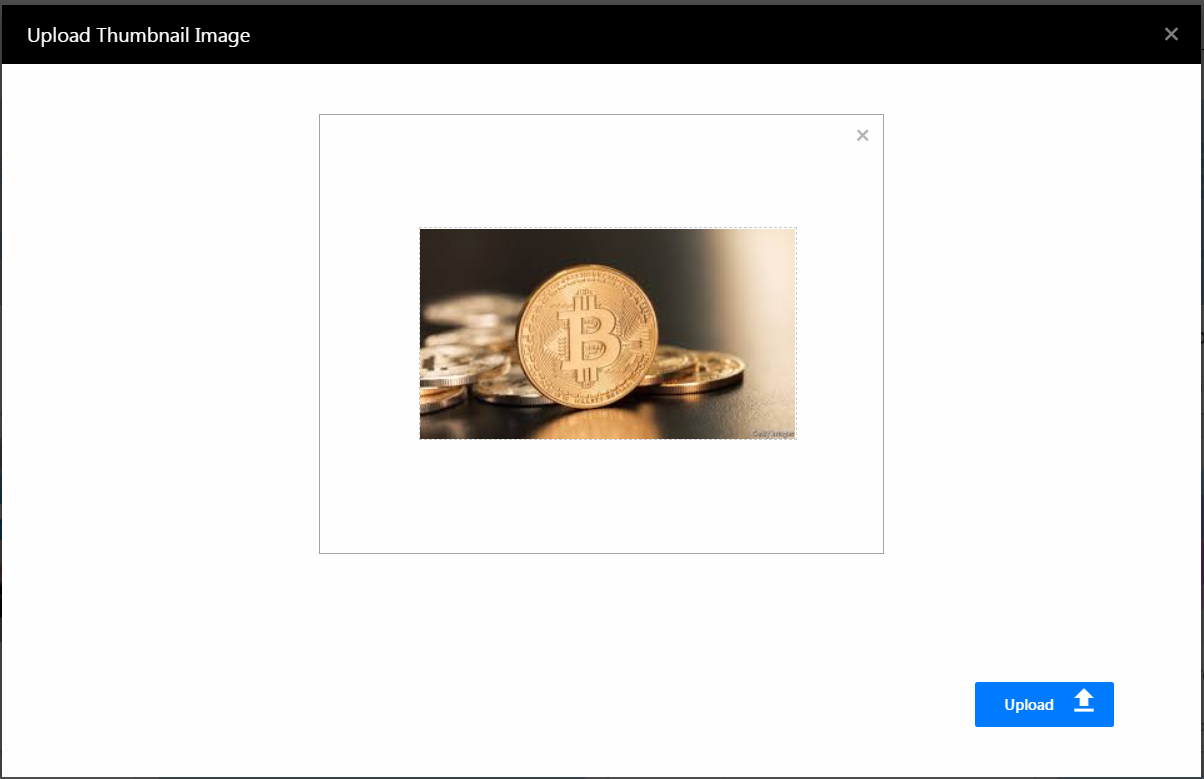
We made improvements to the thumbnail Preview in the Upload window (shown below) so that your logo / image properly reflects how it will be displayed once uploaded. Additionally logos of various shapes and sizes displayed on the tiles are scaled to avoid stretching.
Modeling 2.6.1: Substitution Variables Support in Models with Direct Access to the PCR Finance Cube
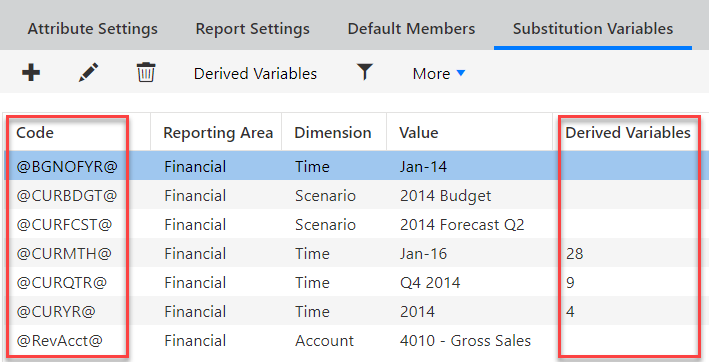
In the Spring release, we introduced Direct Access to PCR Financial Reporting. In the Summer release, we added support for PCR Attributes, Attribute Hierarchies, and Alternate Hierarchies. In this release, we are adding support for PCR Substitution Variables.
To learn how to set up a model with direct access to PCR, see Using Direct Access to PCR Financial Reporting.
Adding Substitution Variables to Existing Direct Access Models
Creating a Direct Access Model with PCR Substitution Variables
Viewing PCR Substitution Variables in SpotlightXL
Adding PCR Substitution Variables and Expressions to Reports
Using PCR Substitution Variables in Reports at Runtime
Adding Substitution Variables to Existing Direct Access Models
A user with Designer or Admin privilege can do the following steps. Find the model you previously created that has direct access to PCR. For example, we have a model named 2015 Products. There are two quick steps to add the PCR Substitution Variables to the model: Clear Model, then Generate Model. You can do those steps manually or another option is to run the default calculation that was created automatically when you created the model.
Here's how:
In SpotlightXL, go to Model, Setup and select the model name from the Model drop-down. The model is generated and locked.
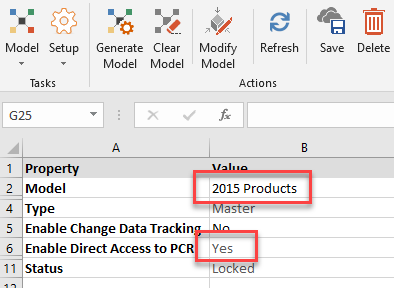
Click Clear Model.
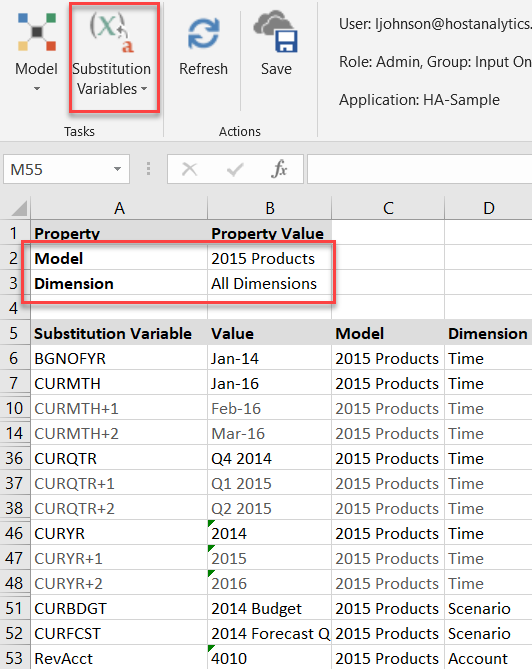
Click Generate Model. The list of substitution variables now appears on the Model, Model Administration, Substitution Variables screen, and they are available for your use.
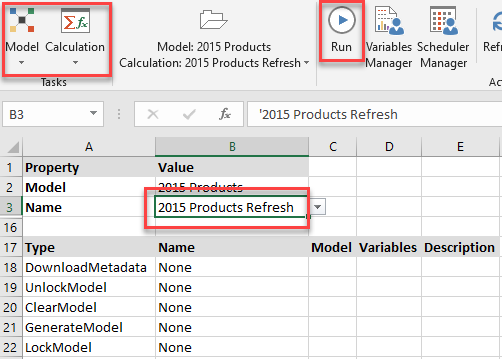
Another way to achieve the same goal is to run the default calculation which was created with your direct access model. The calculation is named <model-name> Refresh and it contains the commands to refresh the model. By refreshing the model, the substitution variables are automatically added to the model. To run the calculation, go to Model, Calculation, locate the calculation, and click Run.
Creating a Direct Access Model with PCR Substitution Variables
A user with Designer or Administrator privilege can do the following steps. When creating and generating a model with direct access to PCR, the Substitution Variables are automatically created with the model.
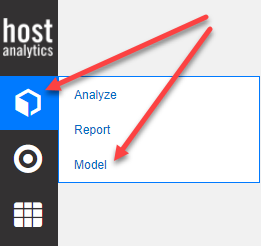
While logged into Host Analytics applications, select Model from the Modeling icon.

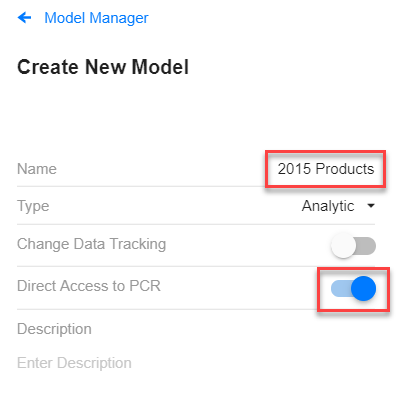
Click the + Circle icon to create a new model. Give the model a name.
Click the option for Direct Access to Planning.
A list of dimensions appears.
Scroll down and click Save.

Now you see the model in the Model Manager window.
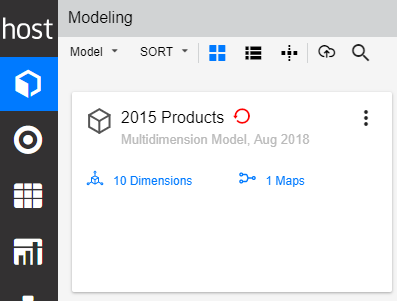
Click the More menu, and select Generate Model, then confirm Yes.
The Substitution Variables are now available for use in reporting and analysis.
Viewing PCR Substitution Variables in SpotlightXL
In SpotlightXL, to see the PCR Substitution Variables, go to Model, Model Administration, Substitution Variables. Select the model from the Model drop-down. Select All Dimensions from the Dimension drop-down.
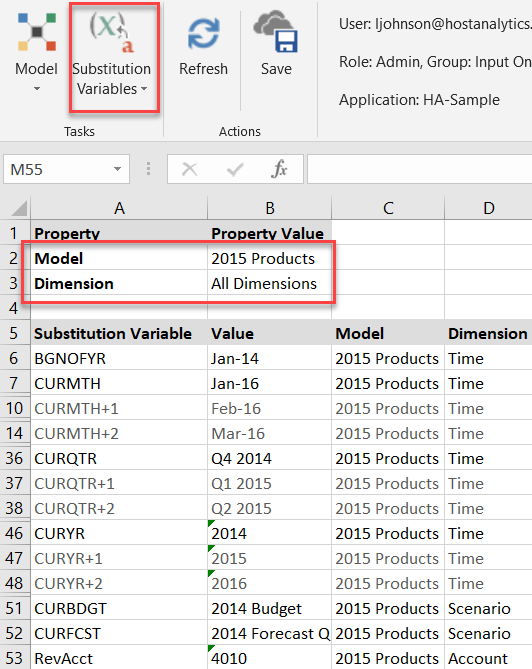
The Substitution Variables and their default values cannot be changed from Modeling. To change them, make the corrections in PCR, then refresh the model.
Adding PCR Substitution Variables and Expressions to Reports
You can add PCR substitution variables to reports, just as you can with substitution variables created in Modeling. You can also create expressions with the PCR substitution variables to simplify report maintenance.
For example, in a report built from a model with direct access to PCR, go to Report, Design.
Select all cells and click Design Manager.
Scroll down to Scenario and click the member selection icon.
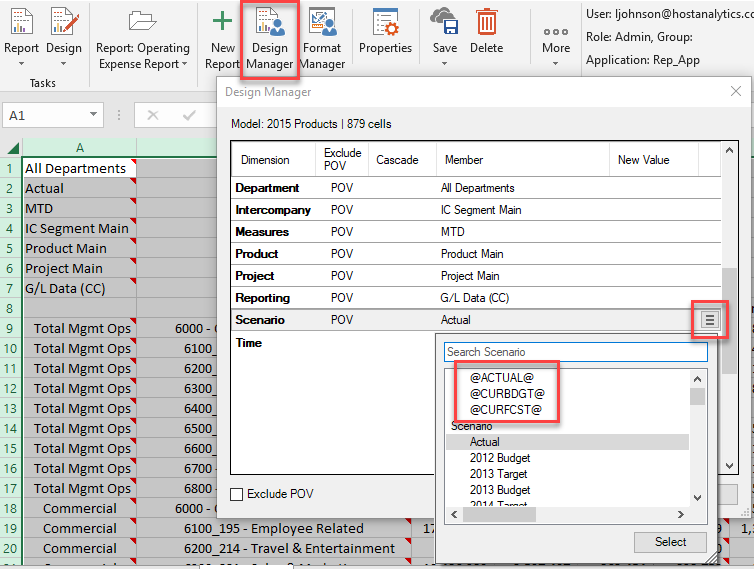
Select a Scenario variable, such as @ACTUAL@.
Scroll to the Time dimension and click the member selection icon.
Select a Time variable for the year you want to view, such as @CURYR@.
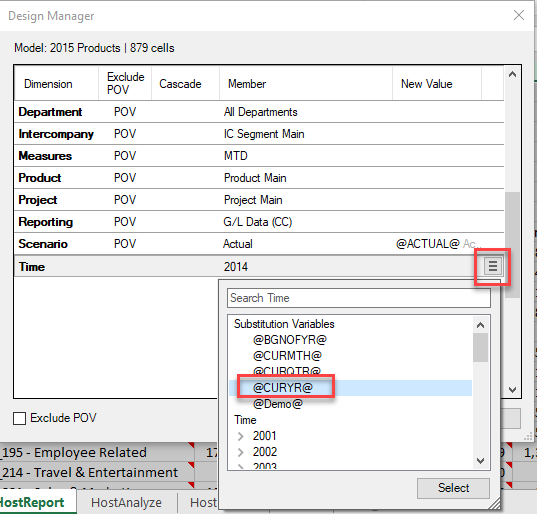
Click Update.
In the spreadsheet, select the column containing Q1 of the year.
Click Design Manager and scroll to the Time dimension. Select the same variable for the year as in step 5.
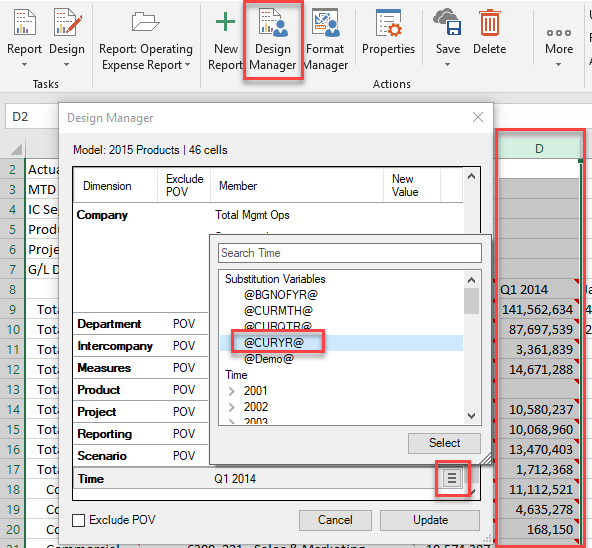
Before clicking Update, on the Time dimension, click the member selection icon again.
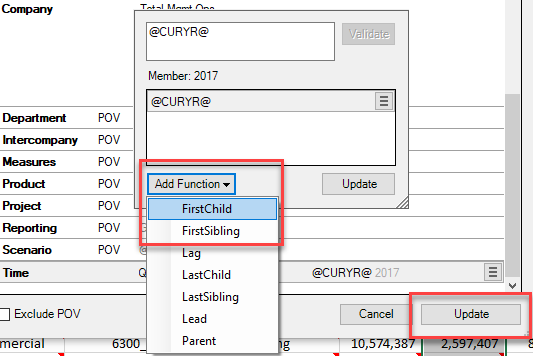
Select Expression.

In the Expression box, click Add Function, then First Child.
Click Update.
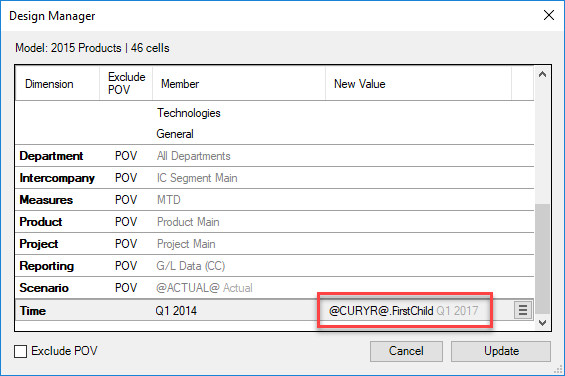
In Design Manager, you see the expression as the new value.
Click Update.
Repeat steps 7-14 for each column in the spreadsheet, modifying the expression as needed for the month and quarter to be represented.
When done, save the report design.
Going forward, only the @CURYR@ variable needs to be set for the report to be updated.
Using PCR Substitution Variables in Reports at Runtime
Once you have added Substitution Variables to the report design, you are ready to use them while running the report.
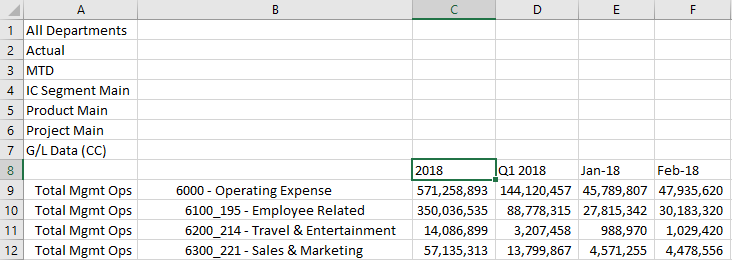
In the report designed in the previous section, go to Report, Run. The current value of @CURYR@ is the basis for the Time columns. In the example below, 2017 is the current year. Click Substitution Variables to change the value.
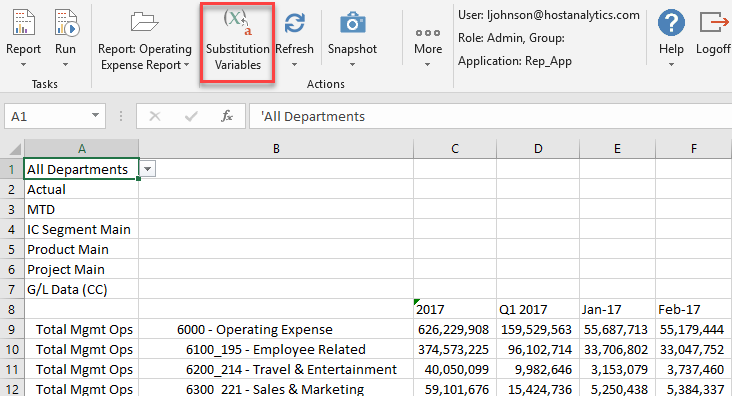
Click the member selection icon, then select a different year.
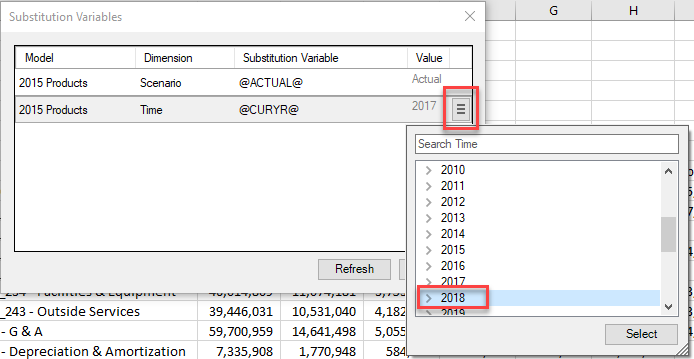
Click Select, then click Refresh. The data is refreshed for the selected year.
Modeling 2.6.1: Using Attributes as Filters for Write-back to PCR
In this release, we have added the ability to use attributes in Maps used for writing back data to PCR. This feature applies to traditional connectivity between PCR and Modeling. It does not apply to Direct Access to PCR. For general information on write-back, see Writing Back Data.
The attributes act as a filter to select the data intersections to be written back. Instead of writing back a whole hierarchy for a particular dimension, you can write back only those members of the hierarchy that have a particular attribute. The match criteria of Common is assumed when attributes are in the map.
Example 1: Write-back without Attributes
The following map shows how data is written back without attributes; this is the traditional method. All members of the Road Bikes hierarchy in 2014 with data for account 4010 are written back. As a reminder, the map is of type Data, the transfer type is Leaf, and the Write Back ID is the name of the data load rules file in PCR.
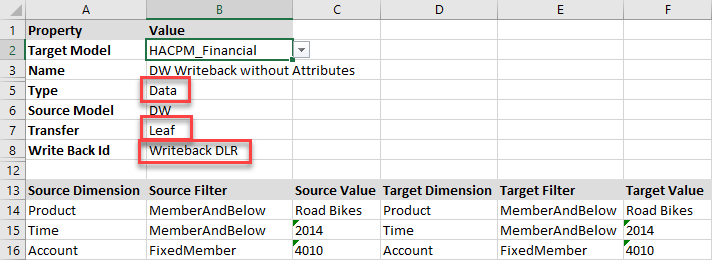
Here is the calculation that runs the map.

Here is the view of the data in Modeling.
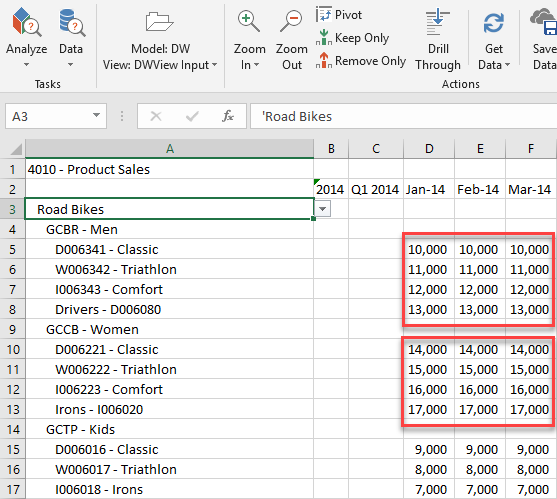
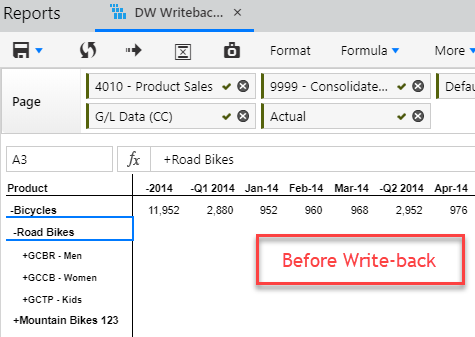
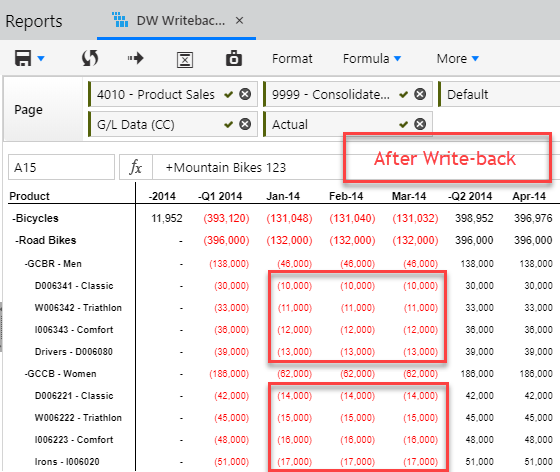
Here is the view of the data in PCR before and after the calculation is run.
Example 2: Write-back without Attributes
Consider the following attributes on the Time and Product dimensions of the model DW.
Time contains an attribute called Seasons. Each month rolls up to a quarter and is mapped to a season.
January | Q1 | Winter |
February | Q1 | Winter |
March | Q1 | Spring |
April | Q2 | Spring |
May | Q2 | Spring |
June | Q2 | Summer |
Product contains an attribute called Material. Each bicycle part rolls up to its parent and is mapped to a type of material.
Handlebars | Frame Assembly | Aluminum |
Grips | Frame Assembly | Rubber |
Saddle | Saddle Assembly | Leather |
Dropper Post | Saddle Assembly | Steel |
Fork | Suspension | Aluminum |
Susp. Remotes | Suspension | Steel |
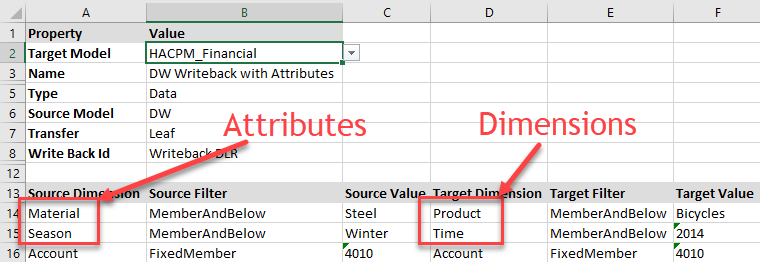
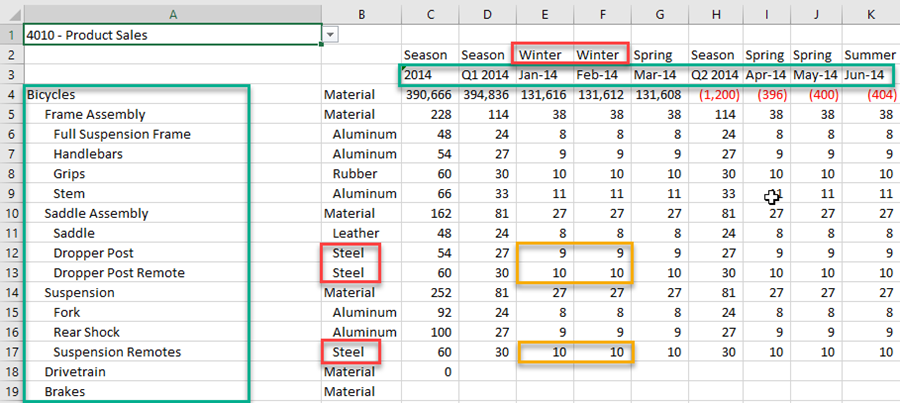
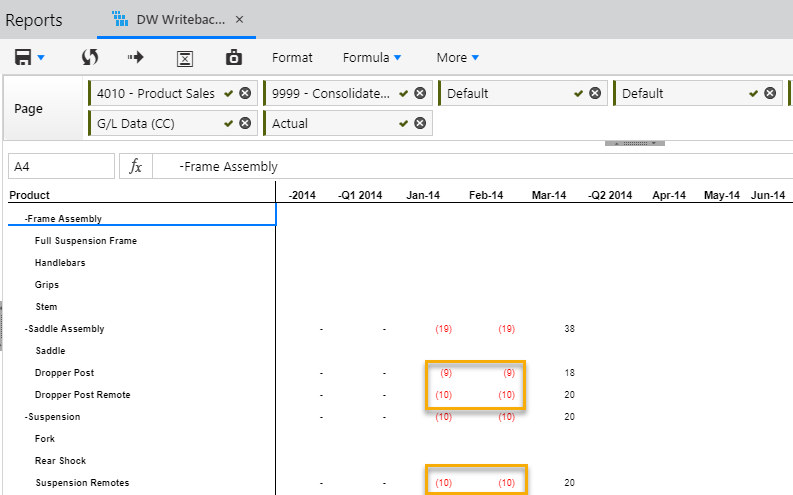
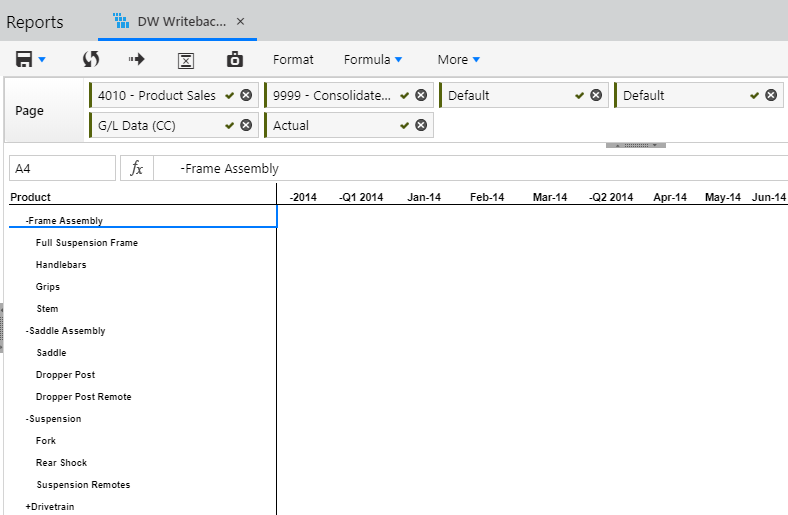
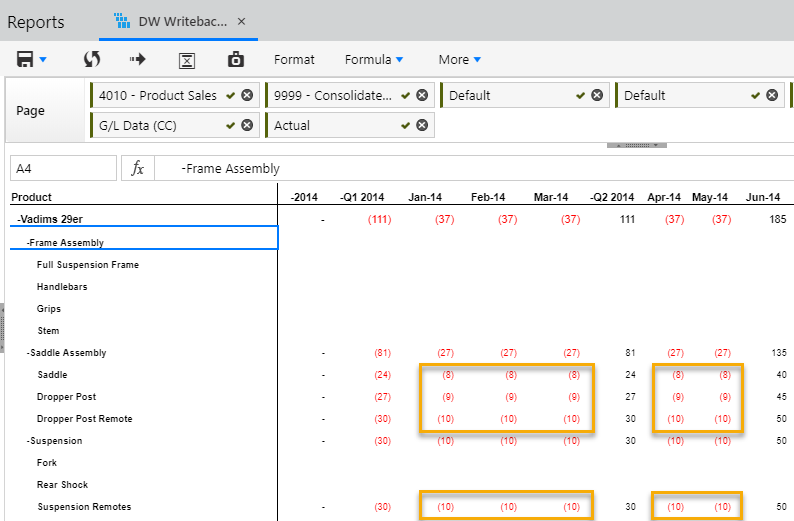
Here is a map with attributes added. Because the attribute is associated with a particular dimension, that dimension does not need to be explicitly identified as a Source Dimension. All members of the Bicycles hierarchy with Material attribute Steel, with data for account 4010 in the months of 2014 with Season attribute Winter, are written back. For data to be written back, it must have both the Steel product attribute AND the Winter time attribute. As a reminder, the map is of type Data, the transfer type is Leaf, and the Write Back ID is the name of the data load rules file in PCR.
Here is the calculation that runs the map.

Here is the view of the data in Modeling. Green boxes show the dimension filters selected in the map. Red boxes show the attribute filters selected in the map. Yellow boxes show the data that should be written back to PCR.
Here is the view of the data in PCR before and after the calculation is run.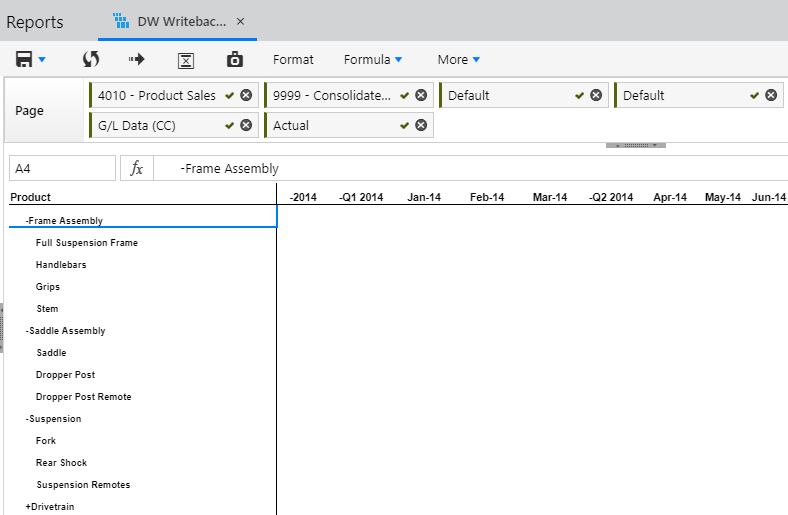
Example 3: Write-back with Multiple Attributes
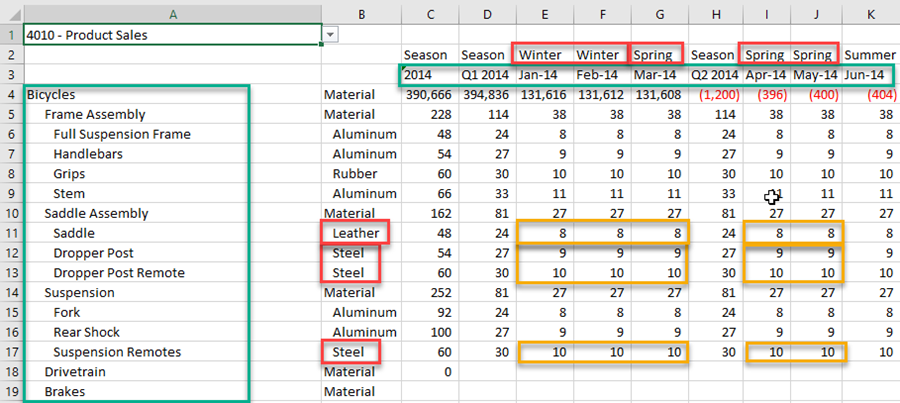
Using the same attributes on the Time and Product dimensions as in Example 2, here is a map with multiple attributes per dimension added. Because the attribute is associated with a particular dimension, that dimension does not need to be explicitly identified as a Source Dimension. All members of the Bicycles hierarchy with Materials attribute Steel OR Leather, with data for account 4010 in the months of 2014 with Season attribute Winter OR Spring, are written back. For data to be written back, it must have the Steel or Leather product attribute AND the Winter or Spring time attribute. As a reminder, the map is of type Data, the transfer type is Leaf, and the Write Back ID is the name of the data load rules file in PCR.
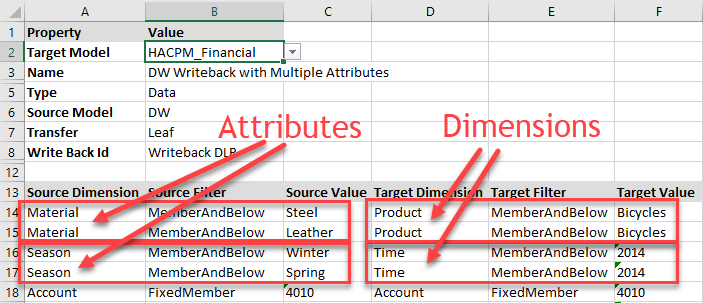
Here is the calculation that runs the map.

Here is the view of the data in Modeling. Green boxes show the dimension filters selected in the map. Red boxes show the attribute filters selected in the map. Yellow boxes show the data that should be written back to PCR.
Here is the view of the data in PCR before and after the calculation is run.
Modeling 2.6.1: Publish As Option Added to Excel-based Reporting
In this release, we have added an option to Publish an Excel-based Report under different names. This is useful in cases where a POV, such as Department name, changes and you want different users to access different reports.
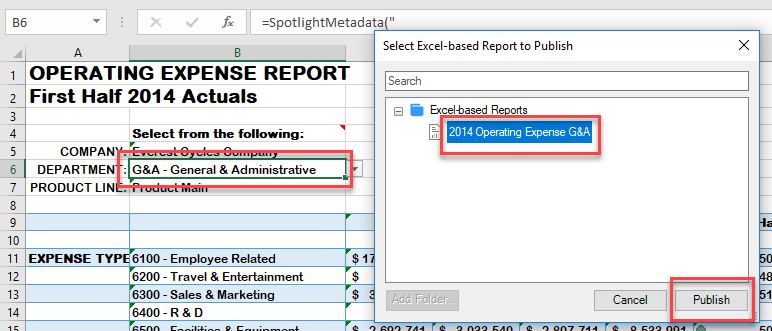
The admin must first create templates for each report to be published. Each template reserves a spot for the report in the Modeling cloud.
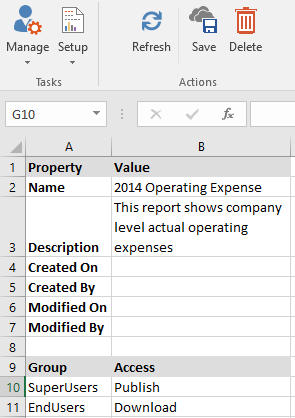
- Select Manage task and the Excel-based Report, Setup subtask.
- Enter the report name.
- Enter the report description.
- Click Save.
- In the Group field, specify user groups that should have access to this report.
- For Access, specify whether user groups should be able to publish or download the report.
- Click Save.
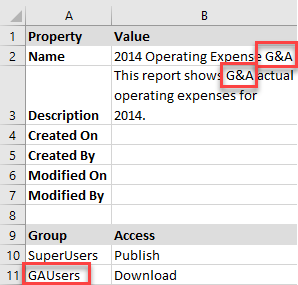
Repeat steps 2-7 for each template to be created. For example, create a template for the G&A department to see its operating expenses.
To use Publish As, first create an Excel-based Report, or open a previously published Excel-based Report.
Click Refresh.
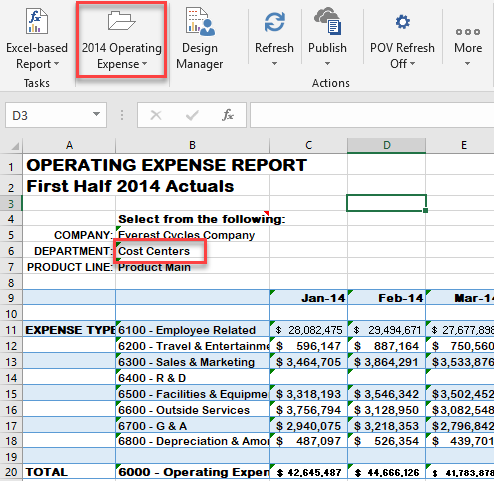
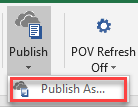
Now change the department POV and click Refresh. Then click Publish As and select the appropriate template. Click Publish.
Modeling 2.6.1: POV Refresh Options Added to Excel-based Reporting
In this release, we have added options to POV Refresh in Excel-based Reporting. POV Refresh controls whether or not the data is refreshed automatically when you select a different POV from the page axis. Previously, you could toggle POV Refresh on or off. Now you have the option to turn it off, turn it on for the current worksheet, or turn it on for the whole document (workbook).
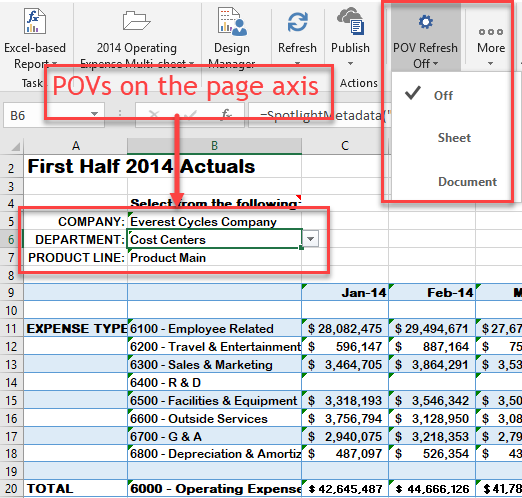
When you set POV Refresh to Off, any change to a POV on the page axis will have no effect on the data in the current tab. You must click Refresh to see the corresponding change.
When you set POV Refresh to Sheet, any change to a POV on the page axis will automatically refresh the data in the current tab.
When you set POV refresh to Document, any change to a POV that is referenced by any other tab in the document (workbook) will automatically refresh all the data in those tabs.
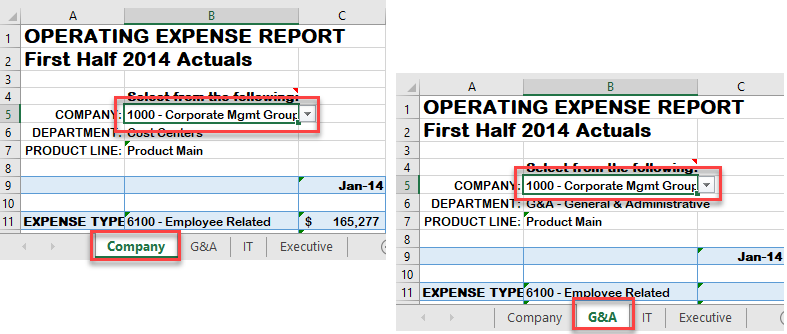
For example, in the following workbook, each tab shows a different department's operating expense.
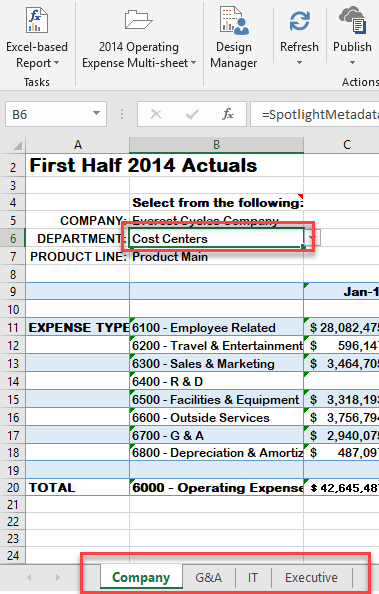
You can point the POV on each sub-department sheet to one master POV on the main sheet so that any changes to the POV on the main sheet also affect the sub-department sheets.
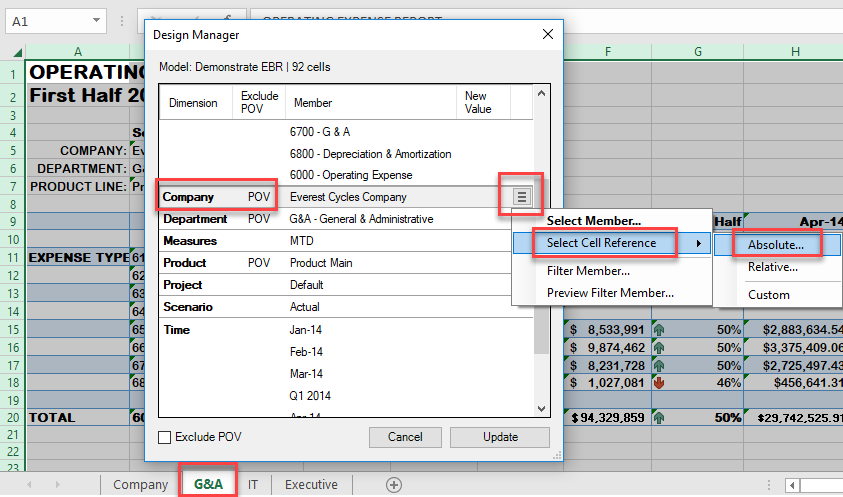
For example, on a sub-department sheet, select all cells then click Design Manager. For the Company, set the POV to point to the Company tab and COMPANY cell. Click OK.
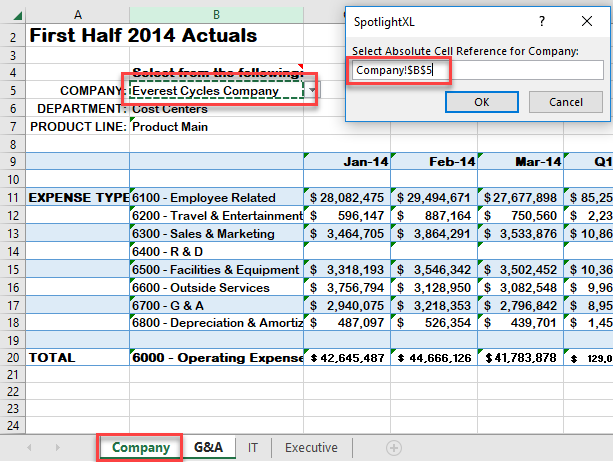
After you have selected the absolute cell reference, you see the change in Design Manager. Click Update to complete the change on this tab. Repeat these steps for the other tabs.
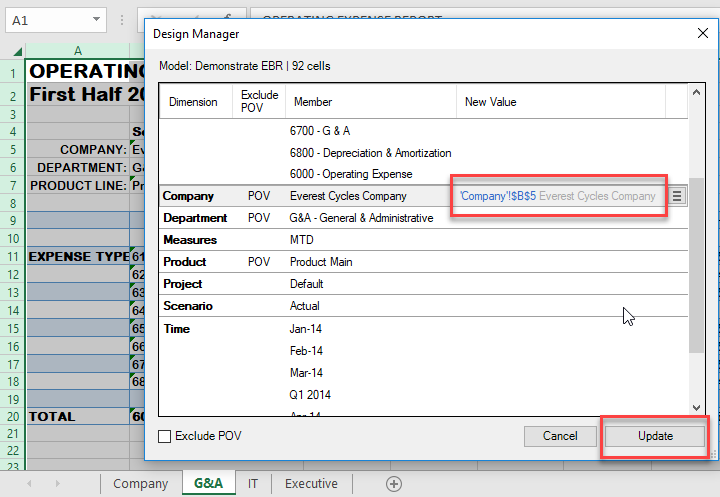
Now when you change the company on the main tab, the data is automatically refreshed in the other tabs that refer to the same company POV.
Modeling 2.6.1: Client Upgrade to TLS 1.2 Required Before October 2018
We are providing an early notification of the need to upgrade to .NET Framework 4.7.2. Transport Layer Security (TLS) protocol is an industry standard designed to protect the privacy of information communicated over the Internet. With the October 2018 release (2.6.2), Host Analytics will support only TLS 1.2. We ask all customers who are using either Spotlight or Modeling to upgrade to the .NET Framework 4.7.2 as early as possible in order to get TLS 1.2.
MS Office Users
If you are using Spotlight for Office (SpotlightXL, PPT, Word) or just SpotlightXL and you do not have .NET Framework 4.7.2 installed, then you will be affected by this change. We recommend to update the .NET Framework to 4.7.2 as early as possible. With the October 2018 release, all users who do not have .NET Framework 4.7.2 installed will not be able to access the Spotlight Add-Ins.
Browser Users
If you use any of the modern browsers to log in to Host Analytics (Firefox, Chrome, Safari, IE 10 and above), you will NOT be affected by this change. All the modern browsers already support TLS1.2. If you are using lower versions of IE and use TLS 1.0 or TLS 1.1, please upgrade to TLS 1.2.
Upgrading to .NET Framework 4.7.2
Once the September 2018 release (2.6.1) is available, please download the latest Add-In and navigate to the SpotlightXL tab. Or if you used ClickOnce for automatic upgrades, you can just navigate to the SpotlightXL tab.
If you do not have .NET Framework 4.7.2, then you will see a message at the top ribbon.

If you see the message that .NET Framework needs to upgraded, then you need to upgrade the .NET Framework to 4.7.2. To upgrade the .NET Framework to 4.7.2, you need to have Admin rights on your PC, otherwise you can reach out to your IT team to upgrade it.
If .NET Framework 4.7.2 is already installed, then you do not need to do anything and there will not be any impact for you to access the application.
Where to Download .NET Framework 4.7.2
https://www.microsoft.com/net/download/dotnet-framework-runtime
How to Determine Which .NET Framework is Installed
For Additional Information, Refer to the Links Below
https://en.wikipedia.org/wiki/Transport_Layer_Security
https://docs.microsoft.com/en-us/windows/desktop/secauthn/transport-layer-security-protocol

