- 8 Minutes to read
- Print
- DarkLight
- PDF
Step-by-Step Use Case for Forecasting Revenue Spread Over Time
- 8 Minutes to read
- Print
- DarkLight
- PDF
The following use case demonstrates the flexibility and complex capabilities of the External Source Model functionality.
This example shows how ESM can spread a sales opportunity for Annual Recurring Revenue (ARR) over a period defined by a Service State Date and a Term. The Sales Segment then copies the resulting summary data into a Master model.
Inputs:
- From the source data: Opportunity Name, Sales Segment, Opportunity Owner, Lead Source, Term, ARR, Service Start
Calculations:
- Calculate the Service End based on the Term and Service Start
- Calculate the monthly revenue based on ARR, Service Start, Service End, and Term
Viewing the Source Data
Here is the source data, an Excel spreadsheet of sales opportunities. Opportunity Name would represent the prospective customers. Opportunity Owner would represent the Sales Rep's name. ARR is the revenue potential over a Term of months beginning on Service Start.
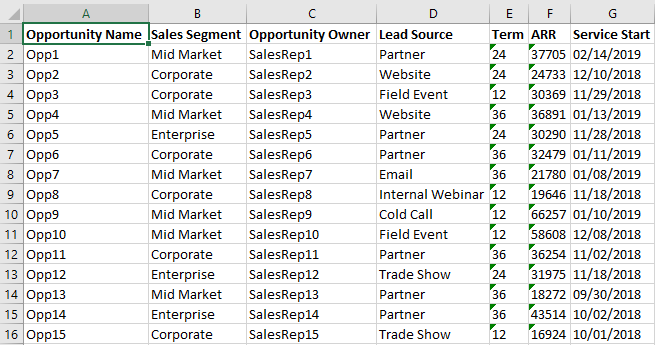
We will calculate the Service End, and spread the revenue for all opportunities across months beginning from a Planning Start Month of January 2018 to a Planning End Month of December 2019.
Defining the External Source Model
- To define the source model, go to Model > External Source Model > Source Model.
- Give the Source Model a name, such as Opportunity Data.
- Fill in the fields and formulas as listed below.
- Click Save.
Here are all the fields to create in the External Source Model. The first 7 fields match the 7 columns in the source data.
Property | Value |
|
|
|
Source Model | Opportunity Data |
|
|
|
|
|
|
|
|
Field | Type | Format | Expression | Include in Data Load |
Opportunity Name | Text |
|
| Yes |
Sales Segment | Text |
|
| Yes |
Opportunity Owner | Text |
|
| Yes |
Lead Source | Text |
|
| Yes |
Term | Numeric |
|
| Yes |
ARR | Numeric |
|
| Yes |
Service Start | Date | MM/DD/YYYY |
| Yes |
All remaining fields are calculated or preset with constants. In all these fields, Included in Data Load is No. Explanation of the Lookup and Round, If, and DaysFactor functions are provided below.
Field | Type | Format | Expression | Include in Data Load |
Service End | Formula | MM/DD/YYYY | LOOKUP("Opportunity - Daily Calendar" , "Service End" , {Service Start},{Term}) | No |
PlanningStart | ConstantDate | MM/DD/YYYY | 01/01/2018 | No |
PlanningEnd | ConstantDate | MM/DD/YYYY | 12/31/2019 | No |
Jan-18 | Formula |
| ROUND(IF(DAYSFACTOR([PlanningStart],[PlanningEnd],[Service Start],[Service End],"Jan-2018")>0.5,[ARR]/12,0),0) | No |
Feb-18 | Formula |
| ROUND(IF(DAYSFACTOR([PlanningStart],[PlanningEnd],[Service Start],[Service End],"Feb-2018")>0.5,[ARR]/12,0),0) | No |
Mar-18 | Formula |
| ROUND(IF(DAYSFACTOR([PlanningStart],[PlanningEnd],[Service Start],[Service End],"Mar-2018")>0.5,[ARR]/12,0),0) | No |
Apr-18 | Formula |
| ROUND(IF(DAYSFACTOR([PlanningStart],[PlanningEnd],[Service Start],[Service End],"Apr-2018")>0.5,[ARR]/12,0),0) | No |
May-18 | Formula |
| ROUND(IF(DAYSFACTOR([PlanningStart],[PlanningEnd],[Service Start],[Service End],"May-2018")>0.5,[ARR]/12,0),0) | No |
Jun-18 | Formula |
| ROUND(IF(DAYSFACTOR([PlanningStart],[PlanningEnd],[Service Start],[Service End],"Jun-2018")>0.5,[ARR]/12,0),0) | No |
Jul-18 | Formula |
| ROUND(IF(DAYSFACTOR([PlanningStart],[PlanningEnd],[Service Start],[Service End],"Jul-2018")>0.5,[ARR]/12,0),0) | No |
Aug-18 | Formula |
| ROUND(IF(DAYSFACTOR([PlanningStart],[PlanningEnd],[Service Start],[Service End],"Aug-2018")>0.5,[ARR]/12,0),0) | No |
Sep-18 | Formula |
| ROUND(IF(DAYSFACTOR([PlanningStart],[PlanningEnd],[Service Start],[Service End],"Sep-2018")>0.5,[ARR]/12,0),0) | No |
Oct-18 | Formula |
| ROUND(IF(DAYSFACTOR([PlanningStart],[PlanningEnd],[Service Start],[Service End],"Oct-2018")>0.5,[ARR]/12,0),0) | No |
Nov-18 | Formula |
| ROUND(IF(DAYSFACTOR([PlanningStart],[PlanningEnd],[Service Start],[Service End],"Nov-2018")>0.5,[ARR]/12,0),0) | No |
Dec-18 | Formula |
| ROUND(IF(DAYSFACTOR([PlanningStart],[PlanningEnd],[Service Start],[Service End],"Dec-2018")>0.5,[ARR]/12,0),0) | No |
Jan-19 | Formula |
| ROUND(IF(DAYSFACTOR([PlanningStart],[PlanningEnd],[Service Start],[Service End],"Jan-2019")>0.5,[ARR]/12,0),0) | No |
Feb-19 | Formula |
| ROUND(IF(DAYSFACTOR([PlanningStart],[PlanningEnd],[Service Start],[Service End],"Feb-2019")>0.5,[ARR]/12,0),0) | No |
Mar-19 | Formula |
| ROUND(IF(DAYSFACTOR([PlanningStart],[PlanningEnd],[Service Start],[Service End],"Mar-2019")>0.5,[ARR]/12,0),0) | No |
Apr-19 | Formula |
| ROUND(IF(DAYSFACTOR([PlanningStart],[PlanningEnd],[Service Start],[Service End],"Apr-2019")>0.5,[ARR]/12,0),0) | No |
May-19 | Formula |
| ROUND(IF(DAYSFACTOR([PlanningStart],[PlanningEnd],[Service Start],[Service End],"May-2019")>0.5,[ARR]/12,0),0) | No |
Jun-19 | Formula |
| ROUND(IF(DAYSFACTOR([PlanningStart],[PlanningEnd],[Service Start],[Service End],"Jun-2019")>0.5,[ARR]/12,0),0) | No |
Jul-19 | Formula |
| ROUND(IF(DAYSFACTOR([PlanningStart],[PlanningEnd],[Service Start],[Service End],"Jul-2019")>0.5,[ARR]/12,0),0) | No |
Aug-19 | Formula |
| ROUND(IF(DAYSFACTOR([PlanningStart],[PlanningEnd],[Service Start],[Service End],"Aug-2019")>0.5,[ARR]/12,0),0) | No |
Sep-19 | Formula |
| ROUND(IF(DAYSFACTOR([PlanningStart],[PlanningEnd],[Service Start],[Service End],"Sep-2019")>0.5,[ARR]/12,0),0) | No |
Oct-19 | Formula |
| ROUND(IF(DAYSFACTOR([PlanningStart],[PlanningEnd],[Service Start],[Service End],"Oct-2019")>0.5,[ARR]/12,0),0) | No |
Nov-19 | Formula |
| ROUND(IF(DAYSFACTOR([PlanningStart],[PlanningEnd],[Service Start],[Service End],"Nov-2019")>0.5,[ARR]/12,0),0) | No |
Dec-19 | Formula |
| ROUND(IF(DAYSFACTOR([PlanningStart],[PlanningEnd],[Service Start],[Service End],"Dec-2019")>0.5,[ARR]/12,0),0) | No |
Scenario | ConstantText |
| Forecast | No |
Account - Sub Revenue | ConstantText |
| Subscription Revenue | No |
The resulting Source Model appears as follows: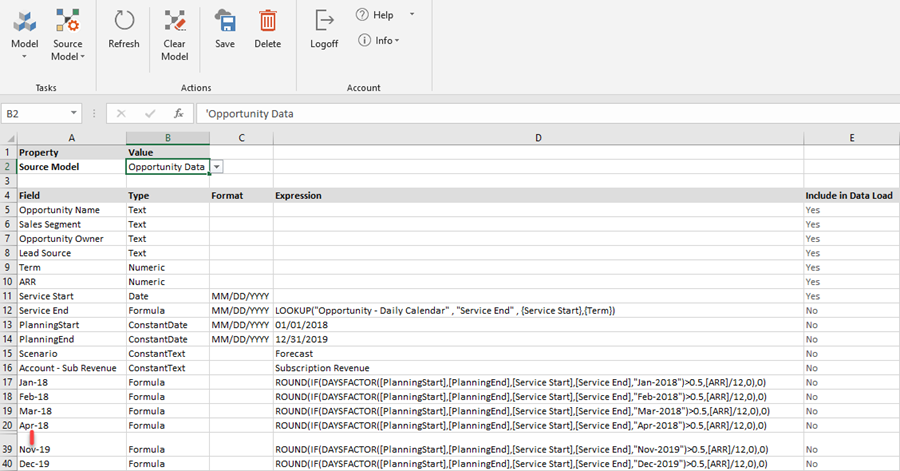
Explanation of the Lookup Function
| Field | Type | Format | Expression | Include in Data Load |
Service End | Formula | MM/DD/YYYY | LOOKUP("Opportunity - Daily Calendar" , "Service End" , {Service Start},{Term}) | No |
To derive the value for Service End, a Lookup function is used. Although the calculation of the Service Start Date plus a Term of n months is a simple formula in Excel, we are demonstrating how to use the Lookup function to accomplish the same goal.
Lookup uses Key fields, Service Start and Term in this case. It looks for the value of the Key fields in another ESM model, which is Opportunity - Daily Calendar in this case. When Service Start and Term are found in the same transaction in Opportunity - Daily Calendar, the value of Service End is returned to ESM model Opportunity Data and fills the Service End field (the field with the Lookup function).
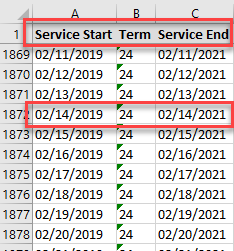
Here is the definition of Opportunity - Daily Calendar and its data.
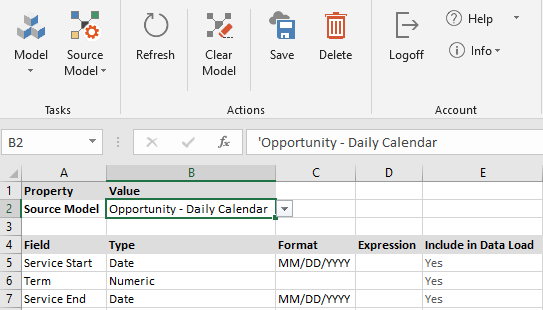

The rows of data continue all the way down to 12/31/2021 with a term of 36 months ending 12/31/2024.
For example, the first row in our opportunity data has a Service Start of 02/14/2019 and a Term of 24. Looking up these Key fields in the Opportunity - Daily Calendar returns a Service End date of 02/14/2021.
For more information about the Lookup function and other functions, see External Source Model Field Types, Expressions, and Formulas.
Explanation of the DaysFactor Function
Field | Type | Format | Expression | Include in Data Load |
Jan-18 |
|
| ROUND(IF(DAYSFACTOR([PlanningStart],[PlanningEnd],[Service Start],[Service End],"Jan-2018")>0.5,[ARR]/12,0),0) | No |
. . . |
|
|
|
|
Feb-19 |
|
| ROUND(IF(DAYSFACTOR([PlanningStart],[PlanningEnd],[Service Start],[Service End],"Feb-2019")>0.5,[ARR]/12,0),0) | No |
To derive the value for each month's revenue forecast, a DaysFactor function is used. DaysFactor is a function with 5 arguments:
[Start Date Field]
[End Date Field]
[Sub-Start Date Field]
[Sub-End Date Field]
"MMM-YYYY"
DaysFactor counts the days Sub-Start Date to the specified "MMM-YYYY" (assuming month end), and divides that count by the number of days in the MMM-YYYY month.
For example, the first row in our opportunity data has a Service Start of 02/14/2019.
The first formula using DaysFactor in the Source Model, Jan-18, is this:
DAYSFACTOR([PlanningStart],[PlanningEnd],[Service Start],[Service End],"Jan-2018")
With the values filled in, the formula is DAYSFACTOR(01/01/2018, 12/31/2019, 02/14/2019, 02/14/2021, "Jan-2018").
DaysFactor counts the days from 02/14/2019 to the month end of Jan-2018, inclusive of the first day, and divides that count by 31 (the number of days in Jan 2018). In this case, Jan-2018 is before 02/14/2019, so the value is 0/31 = 0. The IF function regulates what to do with the resulting value of DaysFactor.
IF DAYSFACTOR()>0.5, then return a value of [ARR]/12 otherwise return 0. Since DaysFactor for Jan-2018 is 0, then IF returns 0.
Skipping ahead in the Source Model to the field for Feb-19, the formula is:
ROUND(IF(DAYSFACTOR([PlanningStart],[PlanningEnd],[Service Start],[Service End],"Feb-2019")>0.5,[ARR]/12,0),0)
To evaluate this function:
DAYSFACTOR(01/01/2018, 12/31/2019, 02/14/2019, 02/14/2021, "Feb-2019") returns 15 days divided by 28 = .5357.
IF DAYSFACTOR()>0.5, then return a value of [ARR]/12. Since DaysFactor for Feb-2019 is .53, then IF returns ARR/12, or 37,705/12 = 3142.083.
ROUND makes the result of the IF function an integer by rounding off the decimal places. This results in a final number of 3142.
When the Source Model is loaded with data and the formulas are calculated, you can see that the ARR is spread across the different months, beginning in the month of the Service Start (so long as the Service Start was in the first half of the month).

For more information about the DaysFactor function and other functions, see External Source Model Functions.
Loading Data into the Opportunity Data External Source Model
After creating the Source Model and defining all the fields that are derived from formulas, it is time to load data.
Select Model > External Source Model > Source Data.
Select the name of the Source Model from the drop-down.
Open the source data workbook.
Copy and paste the source data into the first 7 columns.
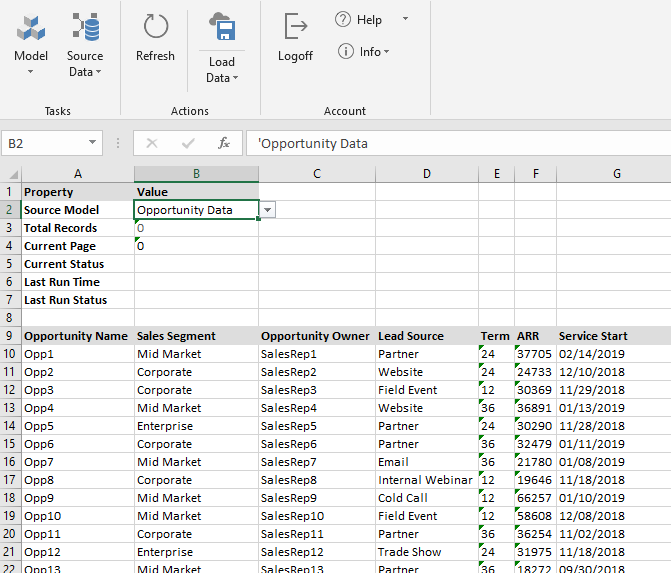
Click Load Data.
Click Refresh. You will then see the derived fields filled in.

Creating a Master Model
You can create a Master model and then copy the data from the ESM Source Model to the Master model. The Source Model is a 2-dimensional table of data whereas the Master model is a multidimensional model, so you will need to map the fields from the Source Model to the dimensions and members in the Master model.
Go to Model > Setup.
Create a new model, such as Forecast Model, of type Master.
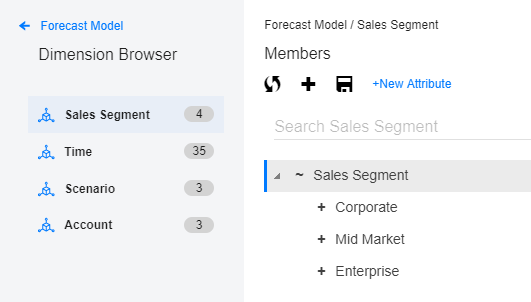
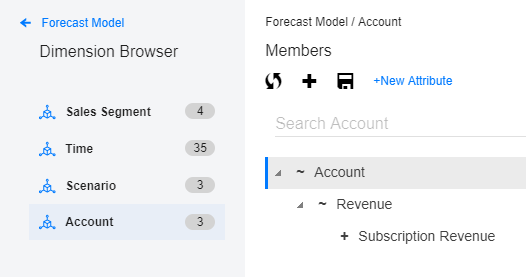
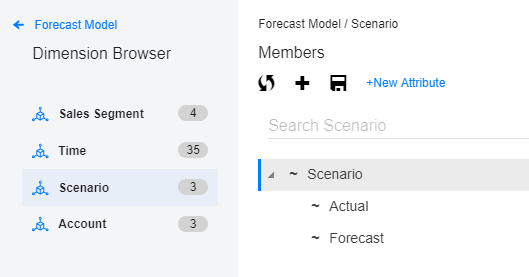
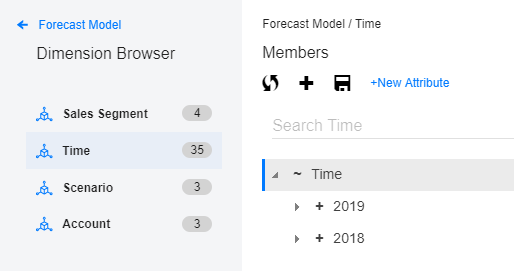
Define dimensions, such as Sales Segment, Time, Scenario, and Account.
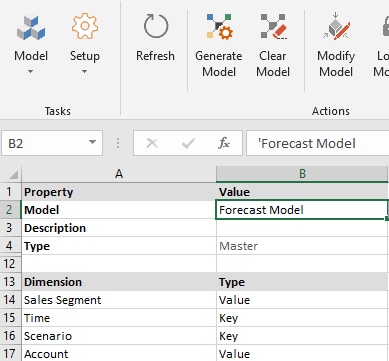
Save the model.
Add members to the dimensions to match up to the Source Model you will be loading.
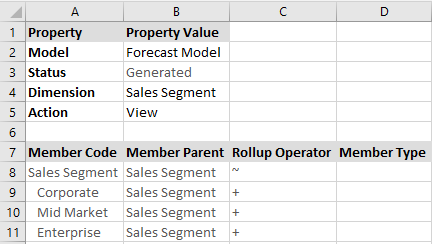
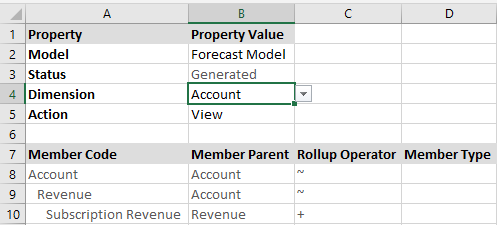
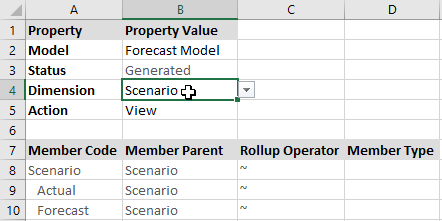
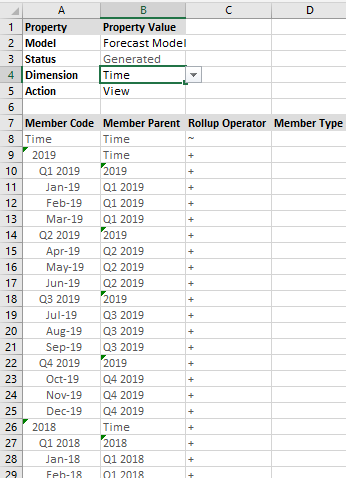
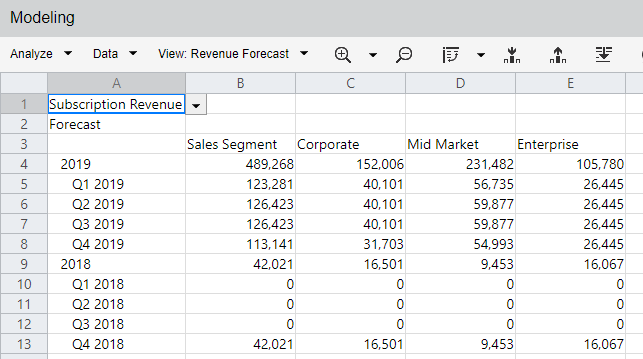
- Return to Model Setup and click Generate Model.Note:here is a look at the same Master model from the Web interface, Model Manager.
Defining a Map from Source Model to Master Model
The Source Model is a 2-dimensional table of data whereas the Master model is a multidimensional model, so you will need to map the fields from the Source Model to the dimensions and members in the Master model.
Go to Model > External Source Model > Source Map.
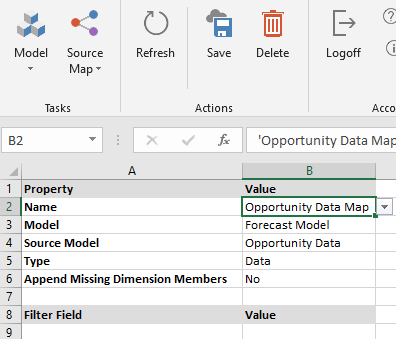
Enter a name for the map.
Select the Master model from the Model drop-down.
Select the Source Model from the Source Model drop-down.
Select Data for Type.
Optionally set Append Missing Dimension Members to Yes. This option detects if there are leaf members detected in the Source Model that are not in the Master model and adds them dynamically at runtime.
Now specify the fields from the Source Model that map to a member in the dimension hierarchy of the Master model. Generally, fields that are text are mapped to dimension members. Fields that are numeric are mapped to values. Not all fields must be mapped.
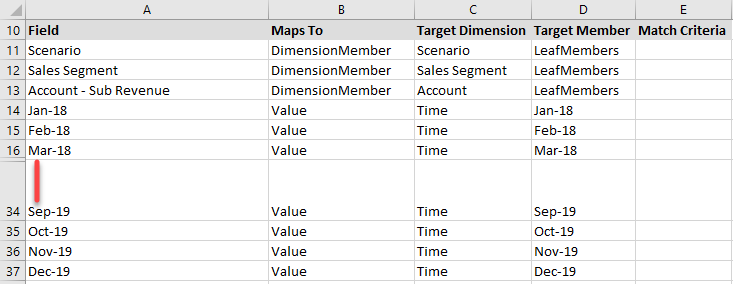
Save the map.
Using a Calculation to Load Data into the Master Model
To copy data from the Source Model to the Master model, you must use a calculation to run the External Source Map.
Go to Model > Calculation.
Select the Master model name from the Model drop-down.
Give the calculation a name.
Create the first step of the calculation by selecting ExternalSourceMap from the Type drop-down.
Select the name of the map you created in the previous task from the name drop-down.
Optionally add an Aggregation step to the calculation.
Save the calculation.
Run the calculation.
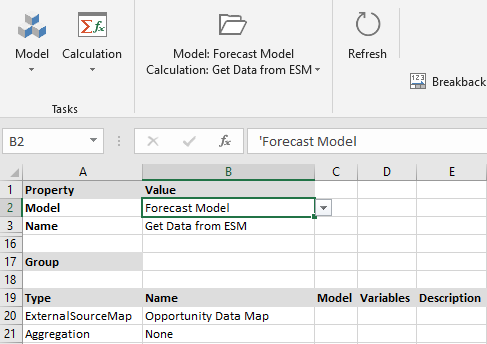
When using a calculation to execute an ExternalSourceMap, records from an external source model are copied to a Master Model. While the map is running, if the copy operation fails due to invalid dimension members, a listing of up to 100 invalid members will be added to the calculation notification, emailed to the user running the calculation, and the map execution will stop. After reviewing the email, the user has the opportunity to review the map, data, and master model and take necessary actions to correct the errors. The calculation can then be run again until no invalid members are found.
Viewing the Data in the Master Model
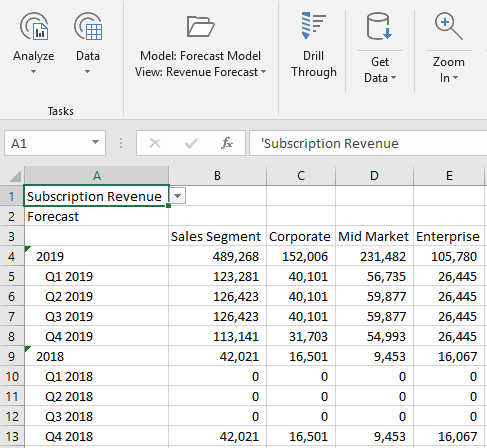
To view the data in the Master model, create a view.
Using Views to Input Future Opportunities into the Source Model
You can directly edit data in the Source Model using a view. A Power user must create the view, then all other users can use the view.
We have a series of sales opportunities already loaded into the Source Model from an external data source, and now you can create a view to allow the user to add more opportunities directly.
Start Spotlight (Web).
Under Analyze, Data, select the name of the Source Model, Opportunity Data.
Select the Default view. Here is a snapshot of the existing data.
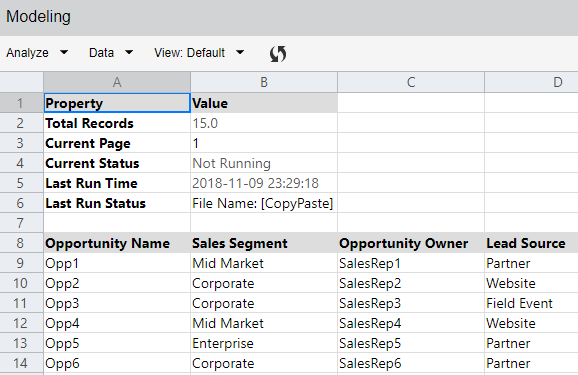
Decide on a field that will be listed as a Point of View lookup on the page axis, such as Sales Segment.
Select Design View.
Optionally, remove excess columns by right-clicking the column and selecting Delete Column. Remember, to calculate all the fields with formulas in this model, the user need only input 7 fields. Leave the fields in row 1.
Save the view.
Select the Properties icon.
To be able to save the view, you must set the Master Model Map property and a POV Dimension.
Select the Master Model Map from the drop-down.
Below POV dimension, add a blank row by right-clicking on a blank row and selecting Insert Row. Under POV Dimensions, type the name of the field you decided on in step 4.
Set Enable Save to Yes.
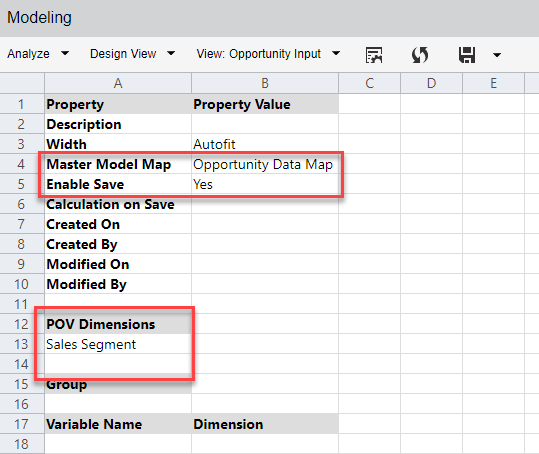
Click Save.
Select Analyze > Data to run the view. Now you have a data entry form you can fill in. Or you can select a Sales Segment from the POV drop-down and view existing data.
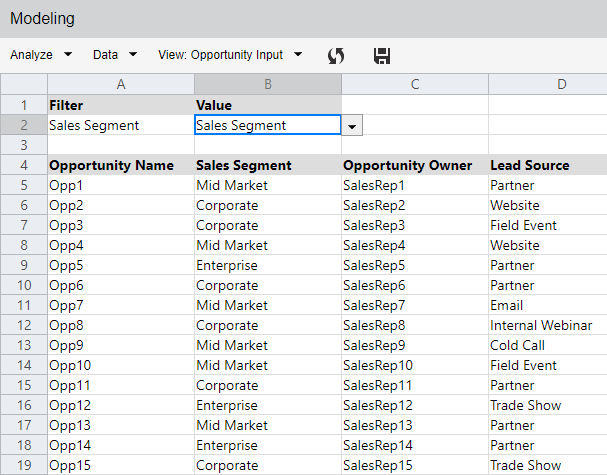
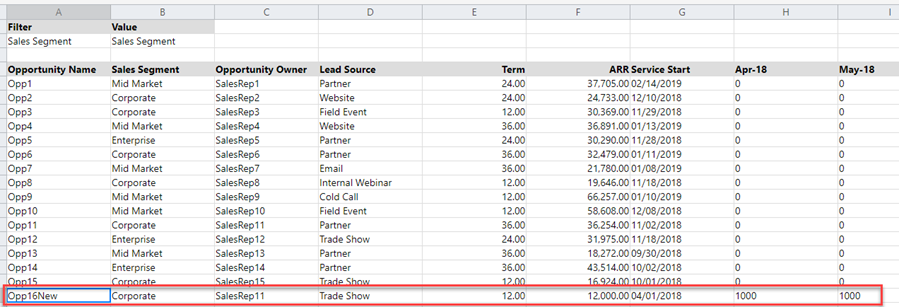
To enter a new opportunity, go to the first blank row below the list of opportunities and add another. Fill in the first 7 columns.

Save the data. The screen refreshes to show the values and results of the formulas.
