- 33 Minutes to read
- Print
- DarkLight
- PDF
Summer19 Release Notes
- 33 Minutes to read
- Print
- DarkLight
- PDF
Enhancements to Application Behavior
This section provides you with a quick overview of features and functionality delivered with this release that may affect the way you use the Host Analytics application. It is not a comprehensive list of all the new features delivered with this release; but rather those features that impact the way in which the application behaves.
Planning
The ability to Input data from higher level privileges without having to send the entity back to the person who sent it for approval. The Approver can now makes changes to the template and then approve it.
Automated the Deletion of Failed Scenarios without having to delete them manually.
Reporting
Report Collection:
Table of Contents check box is removed and replaced with new Table of Contents Settings section.
Save to File Cabinet now honors the run by user security (for a regular user).
Date and time stamp to Exclude by default in newly created Report Collection.
Default Font and Size in TOC are updated in existing Report Collection.
Order Report collection name, type display in TOC updated in existing Report Collection.
PDF output displays page number instead of sheet number in the existing Report Collection.
In all synchronous exports like Verify Data, time offset is removed from the file name.
Font and Size field is removed from the Print Setup window in Dynamic Report.
Scorecard and Sales Reporting Areas (cube) are turned OFF in the application.
Factlessfact is turned off for Financial Reporting Area.
The range-based formula auto-adjusts the input data in Dynamic Report.
Planning: Enhanced Workflow and Automated Task Creation
We had introduced a preview of the new Enhanced Workflow and Automated Task Creation functionality as part of the Spring19 release. With the Summer 19 release, more updates have been added to this feature. With this release, this feature is now available for release to your production environment. Admin users can configure this feature directly from the Host application (refer to the Enable Enhanced Workflow section).
Planning: Personalize the Employees list page
With this release, you can now personalize the Employees list page for the Detailed HR template by using the new Settings option. Columns can be rearranged or hidden as per your requirement and then saved as your default view. You can also view two columns side-by-side and hide all the columns between these two columns. In addition, this customized list can be exported. Admin users can initially set the order, which can be further personalized by users.
In Practice: How to Personalize the Employee list page (End users)
End users can personalize the Employee list page by following these steps:
From the Planning Control Panel, open an HR template.
On the Employees list page, click the Settings icon. All the column check boxes are selected by default.

Unselect the column that you want to hide, and the changes are auto-saved.
To arrange the columns in a certain order, click the drag indicator and drag the column next to the required column.
You can also move the columns on the Employee list page in the required order.
 The changes are auto-saved, and this is your default view for the scenario. To export the data in the order that is visible on the screen, click More and then select Export as Excel.
To reset the columns to the default arrangement of your Administrator, click Reset.
Note:You can uniquely personalize the Employees list page for each scenario to which you have access.
In Practice: How to Personalize the Employee list page (Admin users)
Access the Employee list page by navigating to Maintenance > Admin > Detailed HR.
In the Employees section, click the Settings icon. All the column check boxes are selected by default.

Unselect the column that you want to hide, and the changes are auto-saved.
To arrange the columns in a certain order, click the drag indicator and drag the column next to the required column.
You can also move the columns on the Employee list page in the required order.
 The changes are auto-saved, and this is your default view for the scenario. To export the data in the order that is visible on the screen, click More and then select Export as Excel.
To reset the columns to the default arrangement available in the application, click Reset.
Planning: Time Consistency: Date and Time Display
All fields and columns that display date and time, such as Modified Date, Created Date, and Due Date, have been enhanced to display these details according to a user’s time zone.
The exceptions for date and time display are as follows:
Template Setup page
Subline Template page
Template Input page
Finance Mode Setup page
Offline Planning
Task Manager: Due Date displayed in the activity tab
Task Manager: Due Date change notification
Planning: Ability to Perform Input after Forwarding or Approval of Templates / Budget Entities
This functionality is now enabled by default for all new and existing customers.
Prior to this release, once a template or budget entity was forwarded or approved, template input could not be performed. You would have had to return the template to an In Progress state by sending it back, make the revisions, then forward and approve once again. To eliminate clicks, we’ve changed this functionality so that you can perform template input on templates and entities in a forwarded and/or approved state. It is important to note that this does not apply to templates and entities in a Final Approval state.
The image below shows you the template actions available prior to this release. Notice that the BVT_GTSC template is in a forwarded state and therefore there is no ability to perform template input (only to view the template).
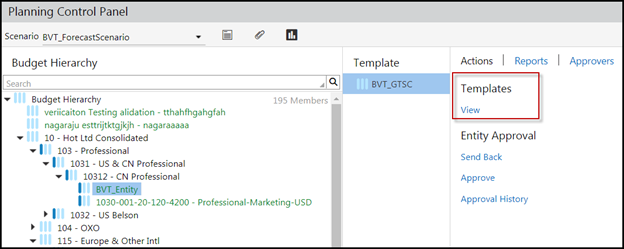
Earlier, if a template was forwarded, the approver could not view the Input option and had to send back the template to input data. Now, the approver or final approver can input data to a template without having to send it back.
With this release, you can perform template input against a forwarded (or approved) template as shown in the image below.
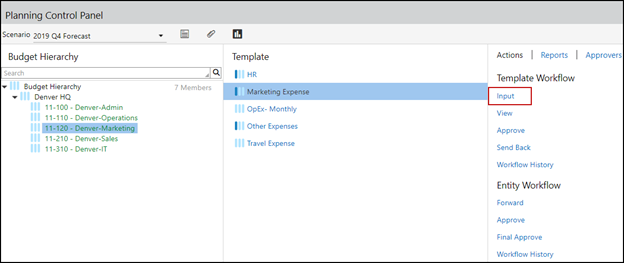
Planning: Enhanced Workflow Actions for Entities and Templates
Earlier, you could perform an Approve action to approve all leaf members and the parent member roll up only after they had been forwarded.
With this release, you can perform an Approve or Final Approve action without having to perform a Forward action first. You can skip the initial workflow actions, and perform the end action directly. Essentially, you can now skip ahead workflow actions.
This functionality is beneficial because it eliminates the need to forward a budget entity before sending the entity for approval. If you have higher level user access, you can directly final approve an entity and its artifacts.
You can view the Forward, Approve, and Final Approve actions for entities at any time based on the approval role access.
Prior to this release, certain entity actions were available only after an entity had been forwarded (as shown in the following image). Note that the 2020-Host Spain entity is in a forwarded state, and Approve action is displayed.
With this release, you can approve or final approve an entity without forwarding it (as shown in the following image). The Forward, Approve, and Final Approve actions are displayed for entities by default.

Planning: Automated Synchronization for Workflow Process
To improve user experience, we have introduced an automated synchronization between the workflow process of a scenario and the workflow tasks created for it.
Automated synchronization is available when you edit the existing Workflow Definition for a scenario and perform a save on the Edit Scenario page and make any changes to the scenario that might impact the workflow tasks for that scenario.
Automated synchronization updates workflow tasks when you perform any of the following actions:
Map or unmap a template/entity to a scenario
Edit or change approval role for a template/entity
Map or unmap a user to a scenario
Delete an entity
Example: Consider a scenario where you have started a workflow process and you are in the middle of a forecast cycle. The tasks have already been generated for your users, but you then realize that you need to either add a template to the forecast scenario, or add a user to help finish the forecast, or change any privileges related to approval roles.
You should simply perform the necessary actions related to these tasks, and then click Save. The application will either automatically generate the task or it will simply synchronize the adjustments mentioned earlier to the current forecast workflow process.
It is a best practice to perform these actions in a sequence to avoid user confusion, even though the application understands how to synchronize your actions properly.
Now that we have added auto synchronization of tasks based on foundational adjustments, you do not need to manually synchronize the information for an existing scenario from the Scenario List page. After you click Save, the application automatically synchronizes the scenarios that have been modified. Ensure that you refresh the Task Manager page to view the updated information. As a safety net, the manual synchronization option will still be available.
Planning: Enhanced Control of Workflow Tasks Generated for a Scenario
This goal of releasing this enhancement is to generate limited tasks for users with roll up level access. This functionality prevents the creation of excess or granular-level tasks.
Earlier, when you enabled the workflow for a scenario, workflow tasks were generated for all the artifacts (templates and entities) associated with that scenario. This was applicable for users with entity roll up level access.
With this release, when you select the Enable Workflow for this Scenario check box and specify the workflow definition, and then click Save, one workflow task is generated only for the roll up not for all the artifacts associated with the roll up.
The approval role set up for users with entity roll up level access is displayed in the following image.
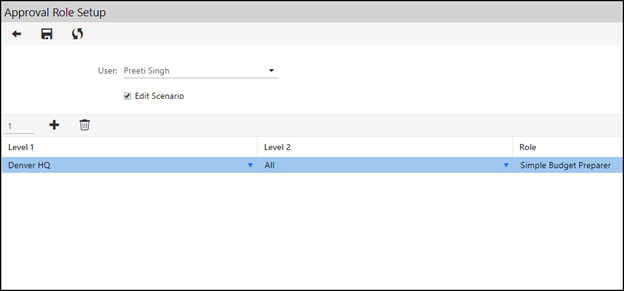
Initially, a forward task associated with the entity roll up is generated. After you complete this task, an Approve task or a task for the next stage is generated.
For example, if Joe has access to the Budget Hierarchy and Denver HQ roll ups, the workflow task is generated only for Budget Hierarchy.

If Joe has access to Denver HQ only, Denver HQ becomes the roll up for him and the workflow task is generated only for Denver HQ.
To generate tasks for all the artifacts associated with a roll up, select the Generate Tasks for all Artifacts check box on the General tab of the My Settings page. By default, this check box is not selected.

Planning: Automated the Deletion of Failed Scenarios
Prior to this release, if a scenario failed or if the status of a scenario was Failed, you had to select the scenario and delete it on the Scenario List page.
With this release, all the scenarios that are in a failed state will be automatically deleted by the application. You no longer need to delete such scenarios manually.
The failed scenarios are deleted once every week on Sunday at 8 AM UTC.
Reporting: Report Collection Enhancements
With this release, we have enhanced the Report Collection functionality to provide you with flexibility and control over the output generated from Report Collection. The following enhancements have been added to Report Collection:
Enhancements in the Settings tab
The following enhancements have been made to the Settings tab:
- A new None option has been added to the following drop-down lists under the Output File Name (Report Collection)section:
Report Collection
Report Bursting
Member
You can select the None option to exclude the report collection name in the Output File Name from the generated output.
Note:The None option is retained when you Save, Save as, or Copy a Report Collection.Note:You must select at least one value from the Report Collection or Report Bursting or Member drop-down lists. You cannot select None in all the drop-down lists.
- A new Date and Time field has been added under the Output File Name (Report Collection) section. This field allows you to Exclude or Includethe date and time stamp in the Report Collection output file name.Note:The date and time stamp is retained when you Save, Save as, or Copy a Report Collection.

A new None option has been added to the following drop-down lists under the Sheet Name (Report + Member)section:
Report
Member
You can select the None option to exclude the report collection name in the sheet name from the generated output.
Note:You must select at least one value from the Report or Member drop-down lists. You cannot select None in all the drop-down lists.
New Settings for Table of Contents
A new Table of Contents Settings section has been introduced in the Settings tab of Report Collection. This functionality provides you with the ability to customize the table of contents of the output generated from Report Collection.
Prior to this release, there was no option to customize the table of contents.
The following fields are available under the Table of Contents Settings section:
Table of Contents: Allows you to Show or Hide the table of contents from the Report Collection output.
Prior to this release, the Include table of contents check box was used to include or exclude the table of contents.
Page Orientation: Allows you to select Portrait or Landscape orientation.
Sheet Number: Allows you to Show or Hide the sheet number from the output. You can show or hide the sheet number when you generate Excel or Google Sheet output and page number in the PDF output.
Company Logo: Allows you to align the logo based on your requirement. You can select one of the following options:
None
Top Left
Top Right
- Style: Allows you to customize the table of contents format. The following fields are available:
Font - Select the required font from the drop-down list.
Size - Select the required font size from the drop-down list.
Bold the text for the Report Collection name.
Italicize the text for the Report Collection name.
Underline the text for the Report Collection name.
Reset: Click Reset, if you want to return to the default formatting.
Preview: Click Preview to view the table of contents.
Add Logo: Click this to add a logo to the table of contents. You can upload an image from your system or select an image from the File Cabinet folders. The logo is visible when you generate a PDF, Excel, and Google Sheet output files
Add or remove the following fields from the table of contents based on your requirement:
Report Collection name
Report Collection title
Generated By
Generated On
The table of content settings is retained when you generate a PDF, Excel, and Google Sheet output files. The output files generated from Process flow also display the table of contents.
Replace existing reports in the Distribution tab
A new Replace existing reports check box has been introduced in the Distribution tab of Report Collection. You can select this check box to replace all reports that are saved after the Summer 19 release in the same folder.

By default, the Replace existing reports check box is:
Not enabled in all existing and new Report Collections.
Enabled if the Date and Time field is excluded in the Output File Name (Report Collection) section.
The Replace existing reports settings are retained when you Save, Save as, or Copy a Report Collection.
Reporting: Dynamic Reports Enhancements
The following enhancements have been made to Dynamic Reports in this release:
Code, Name, and Label Display, Enhanced Drill Through, and Report Security Enabled for all Customers
The following functionalities are enabled by default for all new and existing customers:
Code, Name, and Label display
Enhanced Drill Through
New Report Security
Prior to this release, the above functionalities were enabled in the application by the Support team. For more information, refer to Reporting & Analytics End-User Guide.
Removed Font and Size field from the Dynamic Report Print Setup
With this release, we have removed the Font and Size field from the Print Setup window. The cell-level formatting options in Dynamic Reports was enabled in the Spring 19 release. The font and size of text applied in the report are retained when you export, print, email or generate a Report Collection or Financial Package or linked reports and so on.
The font and size, when applied from the Print Setup window is ignored so the fields have been removed. This is applicable to all existing and new Dynamic Reports across all Reporting Areas, environments, and browsers.
The image below displays the Print Setup window with the Font and Size field.
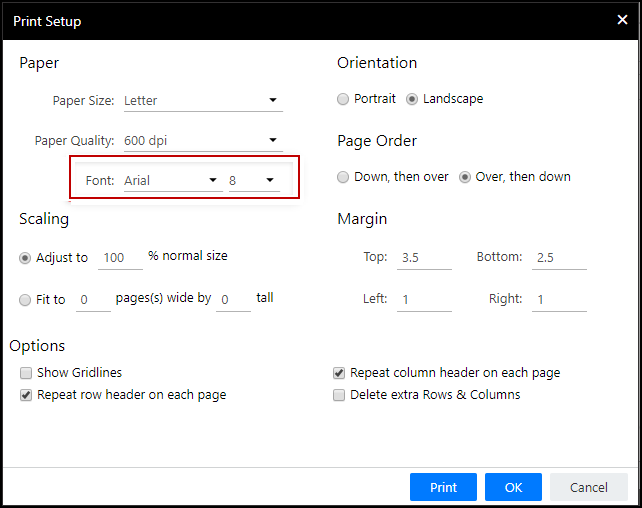
The image below displays the Print Setup window without the Font and Size field.

Reporting: Adjust Column Widths in Verify Data Report
You now have the ability to adjust the column width in a Verify Data Report. You can select a column or multiple columns and drag and resize the column width using the mouse.
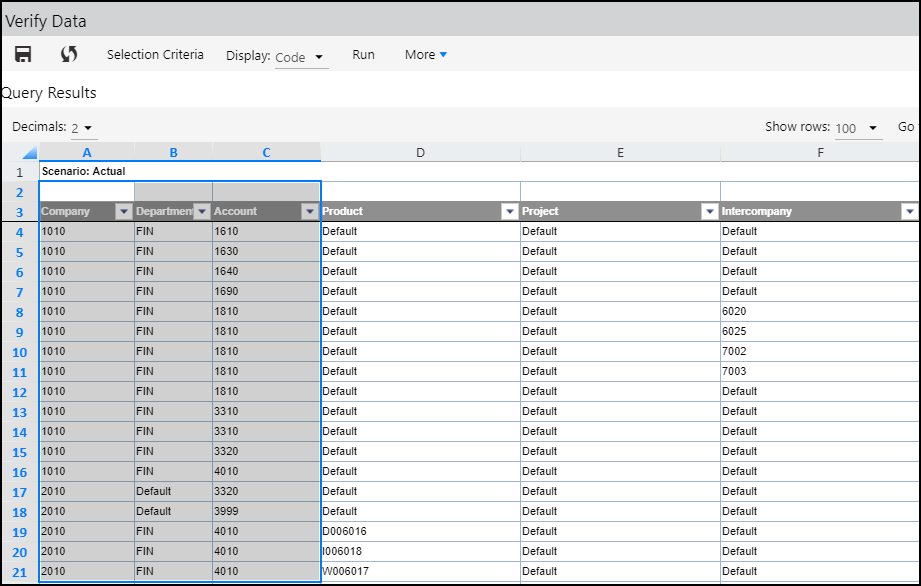
Once you Save the column width, the updated column width is visible when you export a report to Excel or print the report.
Reporting: Range-Based Insert Formula Adjustments in Dynamic Report
With this release, we have enhanced the Range-Based formula to auto-adjust the input data. For example, you want to calculate the total Balance for 12 months using Sum formula and if you remove the January month column from the report, the Sum formula still displays the total value as shown in the image below.

Prior to this release, if you remove the January month column from the report, then an error was displayed while calculating Sum as shown in the image below.

Reporting: Spotlight (Web Interface) Enhancements to Views
Several enhancements have been done to the Spotlight (Web) interface for an improved user experience and consistency between Spotlight and SpotlightXL. The following enhancements to Spotlight (Web interface) are available upon request with this release:
Ability to Have multiple Views Opened at Once
Zoom in/out Options Simplified and Made Consistent with SpotlightXL
Upgraded Toolbar & Grid Technology
Ability to Have Multiple Views Opened at Once
In Spotlight, you can now have multiple tabs opened with different views in each tab (just like SpotlightXL). Each tab will have the view name preceded by the model name. In the example shown below, 3 views are opened each displayed on a different tab.
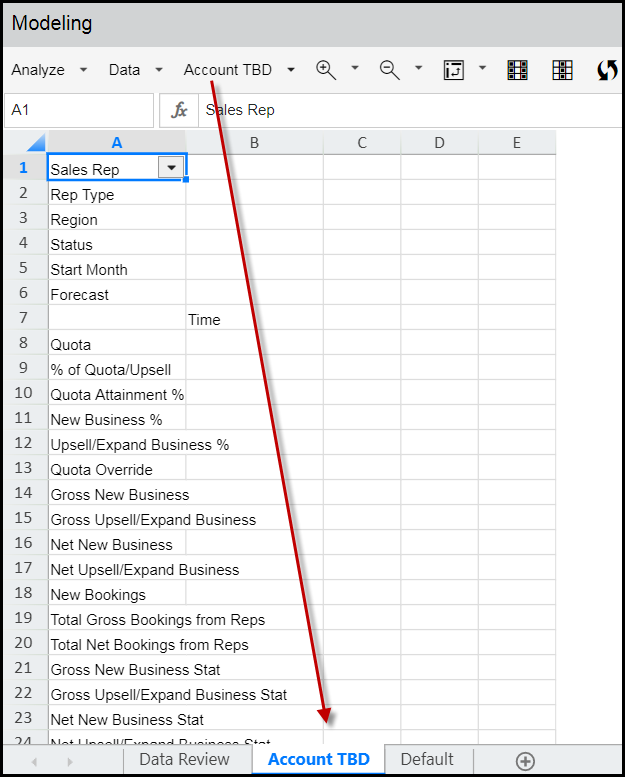
In Practice:
Open a view by navigating to Analyze > Data and selecting the view from the Open View list box.

Open another tab to display a second view by clicking the Add button (shown below).

In the new tab, select a view for display.
Zoom in/out Options Simplified and Made Consistent with SpotlightXL
Zoom in to Children, Leaves, All Children and Data Leaves in Spotlight as you would in SpotlightXL. The images below show the consistency of Zoom In options available in SpotlightXL (first image) and Spotlight (second image).
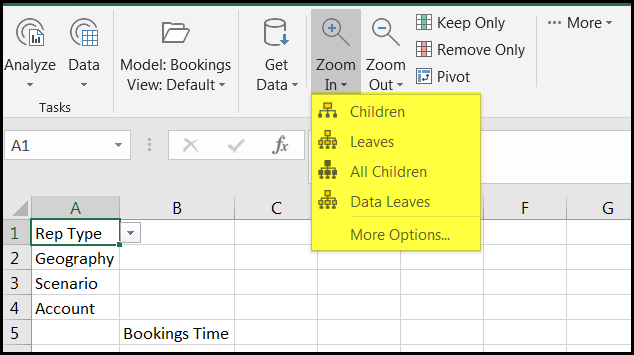
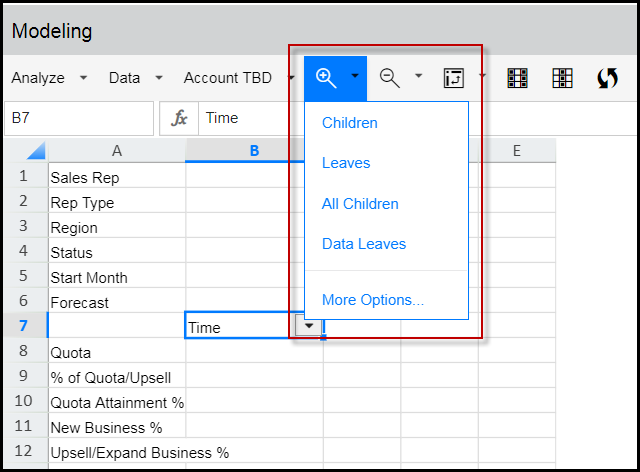
Similarly, you can now zoom out to the parent or top level in Spotlight.
For information on each of the zoom in and out options, access the Spotlight Analyze Data topic.
Toolbar & Grid Technology Upgraded
As shown in the image below, quick functions are now available and the Formula bar is enabled. Additionally, the default font is set to Arial size 9 to ensure consistency with reports and users with a Mac computer.

Dashboards: Overlay Years Option in Dashboard
A new Overlay Years check box has been added to the Dashboard for the Time dimension. You can select this check box to hide year in the plotted graph. This option enhances the data presentation and makes analysis easier.
The check box is enabled for the Bar, Column, Stacked Column, Line, Area, Stacked Area, and Combination (where Column/Line/Area is used) chart types. By default, this check box is not enabled in all existing and new chart types.
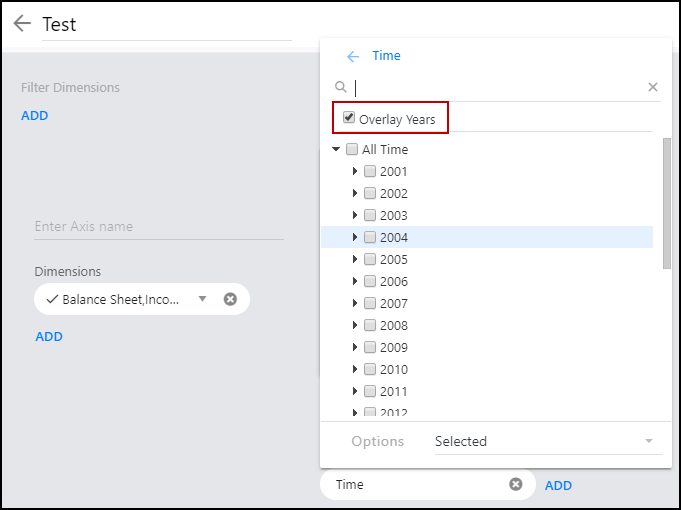
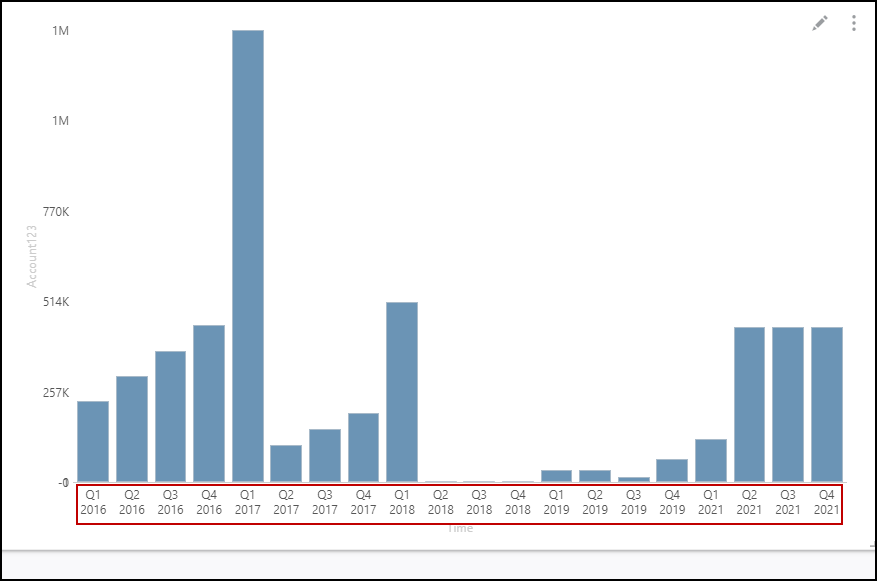
For example, if you select the Account dimension in the Y axis and Time dimension in the X axis and you want to compare data for multiple quarters. The year is displayed as shown in the image below.
When you select the Overlay Years check box, the data for a year is grouped and the year is not represented in the graph.
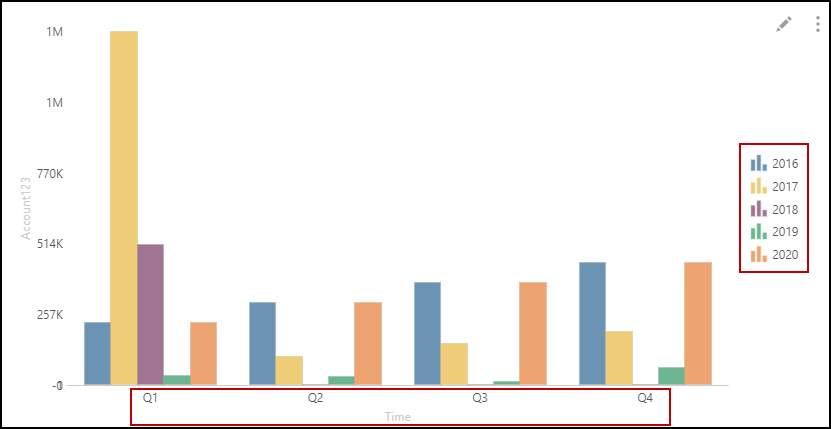
You can use the Overlay Years check box along with the Option field, Substitution Variables, and Custom Members on the Time dimension.
Dashboards: Two Variances in a KPI Chart
Now you have the ability to calculate two variances in a KPI chart. This additional option provides more flexibility to extrapolate the data you want to display. With this release, we have added the following fields in the KPI chart:
VARIANCE 2 section: In the Settings tab, you can enable Variance 2 to calculate variance for the selected dimensions.
Compare Dimensions for Variance 2 drop-down list: You can select the required dimension from the drop-down list to compare it with the primary dimension selected from the Dimensions drop-down list.
The image below displays the new fields added to the KPI chart in this release.
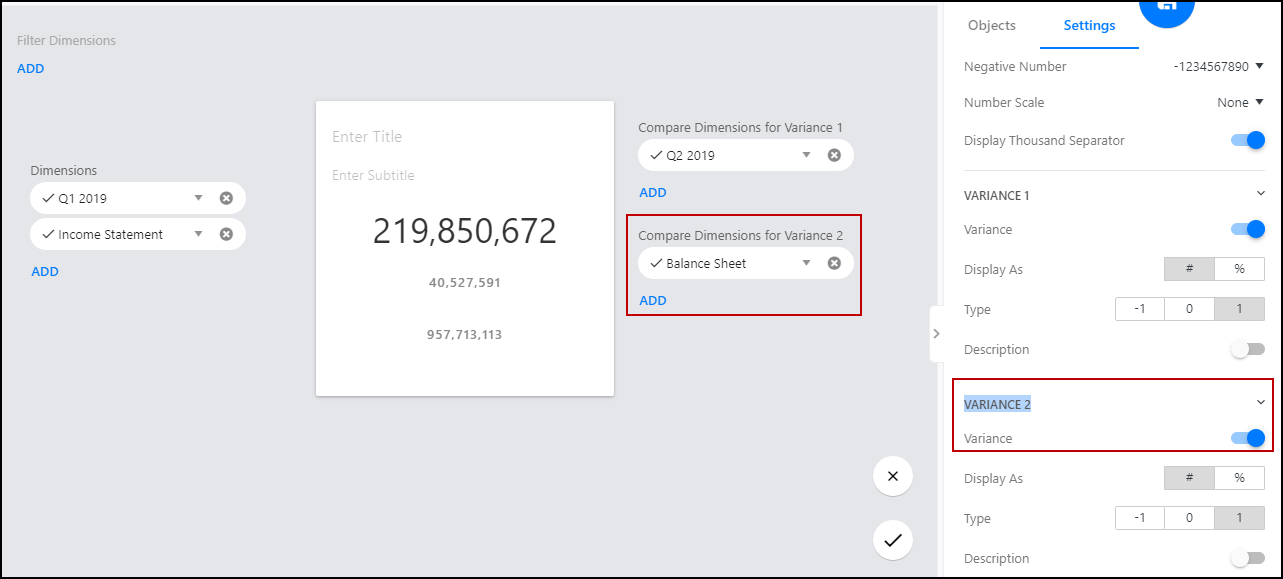
Prior to this release, only one variance field was available in the KPI chart.
Dashboards: Enhanced Data Formatting Settings in Bubble and Scatter Charts
With this release, we have enhanced the data formatting settings in the Bubble and Scatter charts. Now you can apply the following data formatting options independently on the horizontal and vertical axis:
Display As
Decimals
Format Number Scale
The above fields are now available under the HORIZONTAL and VERTICAL AXIS section in the Settings tab. By default, the existing formatting settings are applied on both the axis. The formatting is retained when you drill through in the report.
The image below displays the data formatting options added under the VERTICAL AXIS section.

Prior to this release, all the data formatting options were available under the NUMBER FORMAT section.
Consolidation: Status Legend Display by Default
Prior to this release, to display the status legend in the Consolidation Control Panel, you would have had to click and opt to display it. Now, it is displayed by default. The status legend and the More option is shown in the screenshot below.

If you don’t want the legend displayed, click Hide. If you then want to display the legend, click More.
Consolidation: Ability to Delete Many Standard Journal Lines at Once
Now, you can select many Standard Journal lines at once and delete, which adds convenience and saves time.
In Practice
In the Consolidation Control Panel, select the Standard Journals process. All Standard Journal rows are displayed in the center pane.
Open a standard journal row to display the associated lines.
Click the checkbox in the column header to select all Standard Journal lines.
Click the Delete icon.
In the image below 4 lines are selected because the checkbox in the column header is selected. The delete icon is enabled so that all lines can be deleted.

Modeling: New SpotlightXL Add-In for Summer19
Please upgrade your existing client software for the Summer19 release. See Where to Download SpotlightXL and Version Information for information.
Modeling: Group Access to External Source Models (ESM), Source Data and Source Maps
We’ve enhanced and refined security functionality by providing Group Access for specific ESMs versus navigation access to all ESMs and related maps and data.
You can manage group access to Analytic and Master models and related views, reports, and snapshots via the SpotlightXL Group Access application page. With this release you can also manage group access to External Source Models (ESM) and related artifacts (source maps and source data) from the Group Access application page.
This means that access to Source Maps and Source Data is based on Group Access to ESMs as well as navigation access. Prior to this release, the Source Model, Source Map, and Source Data menu items (shown in the image below) and related functionality were available to Admin users and Designer users with navigate access.
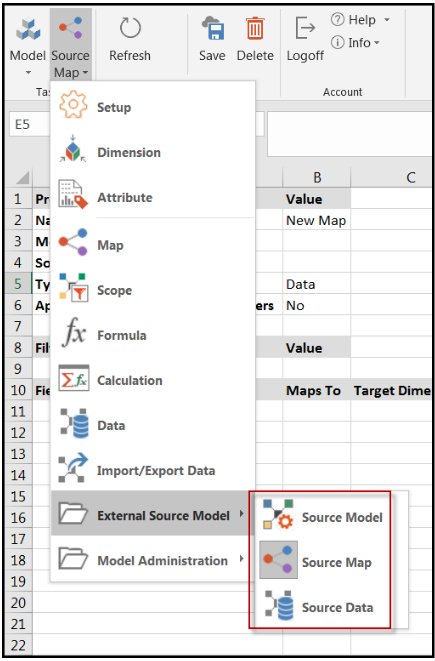
Source Models, Maps, and Data is available to Designer users based on Group Access in addition to navigation access. Admins must provide Designer users with Group Access to specific ESMs in order for them to access related source maps and data.
On the Source Map screen, target models are listed based on Group Access. The Map can be run from an ESM View if the Designer has access to the Map’s Target Model.
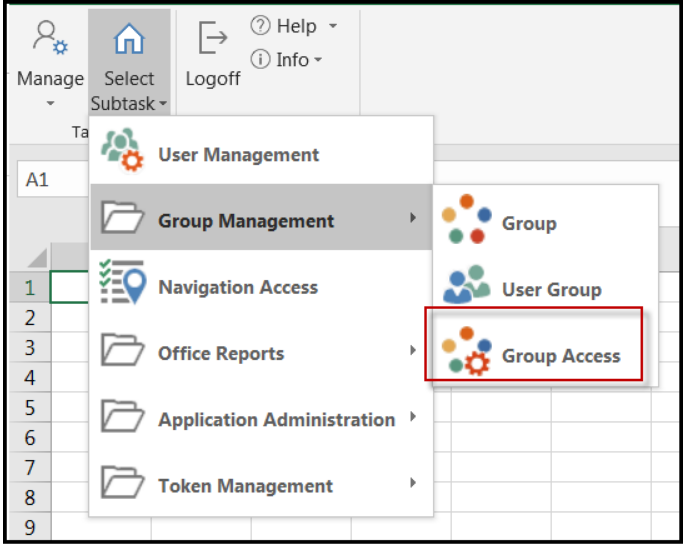
Admin and Designer users with Navigation Access to Source Models, Source Maps and Source Data and Group Access to specific ESMs (and therefore related maps and data) can perform all actions available without any restrictions. This is also the case if the Designer user is the owner of the ESM. When an Admin or Designer creates a new Model the Groups that they belong to automatically get access to the Model. The image below shows that a Designer user has navigation access to ESM Models and related application pages. The Designer user must also be provided with Group Access. The Group Access page is shown in the second image below.


Alternatively, Group Access can also be added/updated from Model Permissions. For information, see the next topic called Model Permissions for ESM Models.
Unlike Source Model, Source Map and Source Data SpotlightXL application pages, ESM Views can be accessed from the web (Spotlight) interface as well as SpotlightXL. In both SpotlightXL and the web interface, views are accessed by navigating to Analyze > Data or Analyze > Design View based on intention.
Modeling: Model Permissions for ESM Models
Prior to this release, ESM Models were not displayed on the Model Permissions application page in SpotlightXL. Only Master and Analytic Model data was displayed. Now that ESM Models are included, you can quickly and easily map user groups to the model to provide access.
In Practice
Log in to SpotlightXL.
Navigate to Manage > Application Administration > Model Permissions.
Select an ESM Model and enter/select groups that you want to provide access to the model.
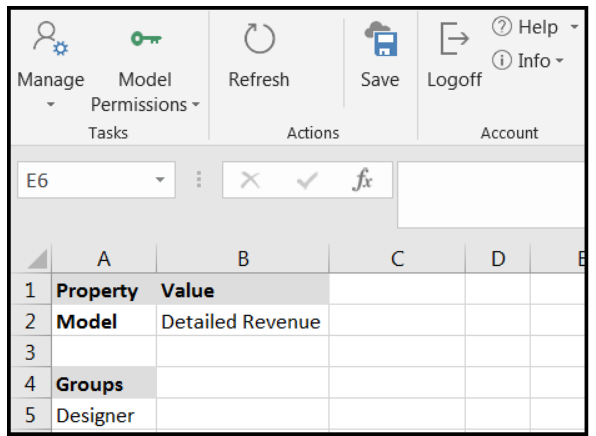
Click Save. In the image below, the Detailed Revenue ESM Model is selected and group access is provided to the Designer group.
Modeling: Group Access to ESM Views
Navigation access must be provided to make the Analyze > Data or Analyze > Design View menu options available for selection. Prior to this release, a user with access to these menu options could potentially add, view, and update the views if access was not explicitly defined. Now, Designer and Reviewer users must be given Group Access to a view in addition to navigation access to access a view. Views available for viewing or updating are listed on the Analyze > Data or Analyze > Design View application pages based on Group Access. For example, if a Designer or Reviewer user has navigation access to the Analyze Data screen and Group Access to the ABC View, but not the XYZ View, the user will only see the ABC View available for selection to view or edit.
If a user creates a view from an ESM Model in SpotlightXL or Spotlight, that user is the owner of the view and has inherent access to perform all actions on the view no matter if the user has Group Access.
In Practice: Providing a Designer User with Group Access to an ESM Model
Log in to SpotlightXL and navigate to Manage > Group Management > Group Access.
Select to view all Artifacts, Groups, and Models. ESMs are now shown in addition to Analytic and Master models under each section (Models, Views, etc). In the image below, an ESM model is shown under the Model section.

Enter or select Yes for each group you want to provide access to the ESM model. In the image above, the Admin group has access to the ESM Revenue model.
Click Save.
Modeling: Calculations in SpotlightXL Honor Group Access for ESMs
Now, Calculations (accessed by navigating to Model > Calculation) created in SpotlightXL honor Group Access defined for External Source Model (ESM) maps and formulas. ESM maps are used in Calculations to define the way data will populate in a Master model with data from an ESM. The Calculation itself executes the map when run. Formulas can be applied to manipulate data in the ESM to produce a specific output; for example the concatenation of two columns of data into one.
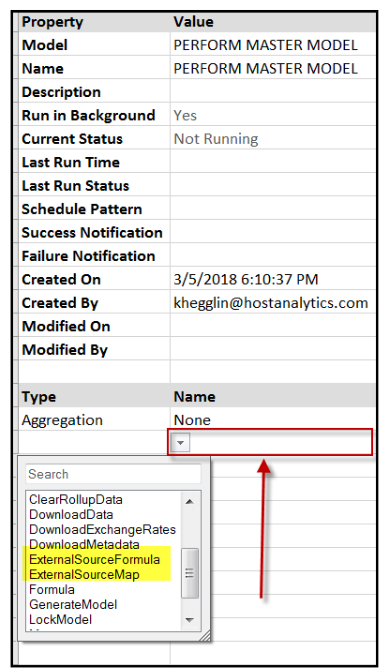
A Designer user must have navigation access and Group Access to be able to select an ESM map or Formula from the Name list-box once either of these selections are made in a Calculation. Using the image below for example purposes, let’s say ESM Map is selected (highlighted in yellow) in the Type column. The next step is to select the map name in the Name column. Only the maps where the Designer user has access to the Target Model selected in the Map will appear in the Name column for selection. If the Designer user has access to no maps, none will appear in the Name column.
Modeling: Drill Through in Views Accessed Via SpotlightXL or Spotlight Honor Group Access for ESMs
If a user has access to an Analytic model view that is populated via an ESM model, but has no access to that ESM, the user will not be able to drill through the data.
Drill-Through provides a way for users to see all the data points that were aggregated to form a particular data cell. When data is loaded via an ESM, transaction data is aggregated into analytic data.
Drill-Through provides visibility into rolled up data in two ways:
From parents whose children are present in the model.
From parents whose children are absent in the model.
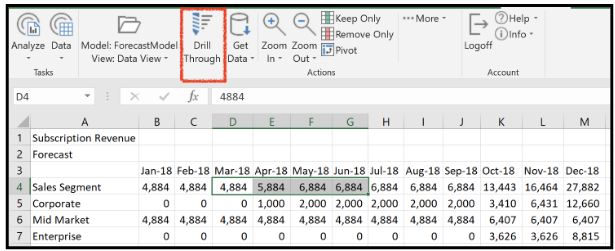
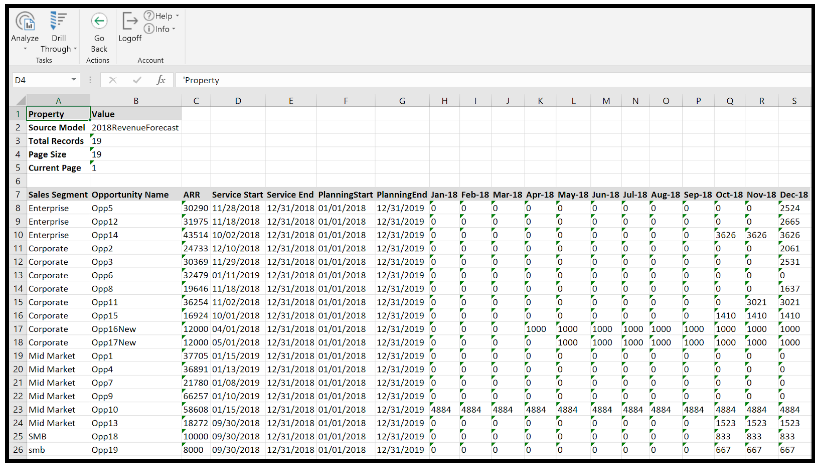
The first image below shows a view and the Drill Through icon in the ribbon. The second image displays the HostDrillThrough tab that appears once you click Drill Through.
Modeling: Model Manager in Spotlight Honor User Group Security for all ESM Artifacts
With this release, Designer user types with access to an ESM Model, can view and manage the model directly from Model Manager. Reviewer user types can be provided with access to Views built on ESM models and access the Views from Model Manager. Designer and Reviewer users must have Group Access (or be the owner in the case of a Designer user) to access artifacts and Views built on an ESM Model from Model Manager.
The following topics discuss access for Designer and Reviewer users in detail.
Designer Users
The following model management options will be available for Designer users with Group Access to an ESM model:
Clear Model
Lock Model
Model Backup
Model Statistics
Model Activity
Model Artifacts

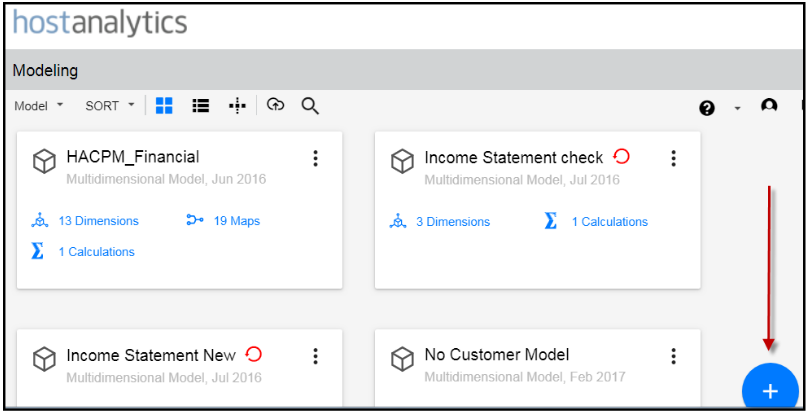
Designer users can add models directly from the Model Manager screen by clicking the Add button.
Reviewer Users
Reviewer users can access the Model Artifacts option for an ESM model the user has access to via Model Manager.
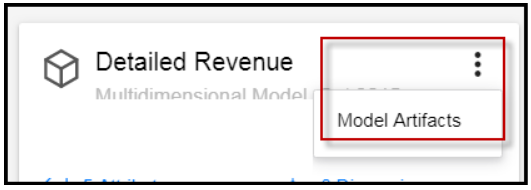
Reviewer users cannot add new models and therefore the Add button is disabled in Model Manager.
Reviewer users may be given group access to open Views from Model Manager.
Modeling: Ability to Lock and Unlock an External Source Model from Model Manager
Now, you have the ability to Lock and Unlock an ESM model directly from Model Manager (available in Spotlight - web interface).
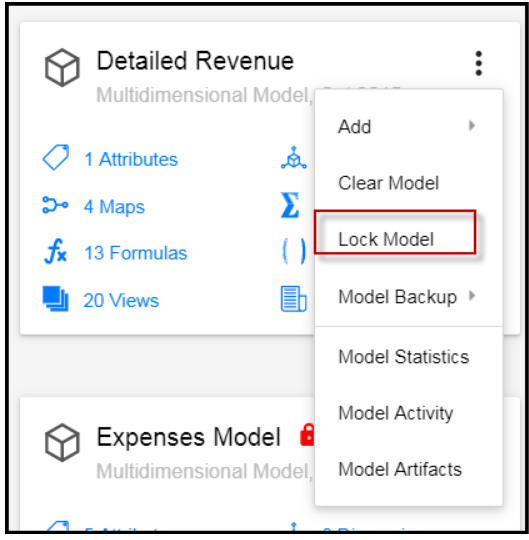
The ability to lock an ESM model comes in handy when you want no changes done to the model. Locking an ESM model makes the entire model and all related artifacts read only. If an ESM model is locked and a data load takes place, for example, the model will be locked after completing DLR processing.
Admin users and Designer users with Group Access to the ESM model can lock and unlock the model. Designer users that own the ESM model have access to unlock and lock that model.
Modeling: ESM Maps Now Support Variables
With this release, External Source Maps now support Variables. You can now use variables in ESM maps for Filter Fields Values and Target Members. Additionally, you can use variables in the following scenarios:
Moving data from one ESM to another (variables can be used on Default and Filter Fields of type text and date)
Moving data (on target members) from ESM to the Master and Analytic models.
Prior to this release, variables were only supported for Master and Analytic models.
Variables in ESM Maps is supported in both Spotlight and SpotlightXL.
In the image below, the @enterprise@ variable value is used for the Filter Field Sales Segment. Using the filter field allows you to move only a subset of data from the Source model. Use the Filter Field section of the Source Map to indicate which rows of data to move. In the following example, the map indicates that only rows of the Sales Segment associated with the enterprise variable should be moved from the ESM to the target model. For example, SalesEnterprise1, SalesEnterprise2, and so on.

In the example below, a variable is used for the month and an expression for the preceding months within the field mapping of an ESM to Analytic Model map. The Target Member in the Target Model will be populated with data from Jan-18 and the 5 months trailing (from the Source Model).

You can select variables from the Variable Manager window if you are moving data from ESM to Analytical or Master model. You have to enter the variable value manually when you are moving data from one ESM to another as shown in the below image.

The Skip functionality is supported when you are using variables in ESM.
Modeling: Performance & Scalability Improvements
In an effort to continue to improve performance, we’ve made significant performance improvements for External Source Model (ESM) maps and maps used to write back data from Modeling to Planning, Consolidation and Reporting (PCR).
Performance improvements would vary from model to model as there are a lot of other factors like data density, key vs. value distribution, and so on. We’ve benchmarked the performance improvements using a sample model and the map used to write ESM data to a sample Analytic Model with 35 columns and 800,00 rows is 46 to 48 seconds. Overall ESM maps performance as well as Lookups and Formula Engine have marked improvement. We’ve also benchmarked the performance improvements using a sample model and a map used to write the data back to Planning, Consolidation and Reporting (PCR) and the overall improvement was around 40% compared to previous versions.
Modeling: Support for Translations in Write Back from Modeling to PCR
With this release, you can create a Model with Source Segments, map them to the Financial Model and write back to PCR (Planning, Consolidation, Reporting) using a Translations Data Load Rule. The write back map now allows you to include Source dimensions as shown in the following example.
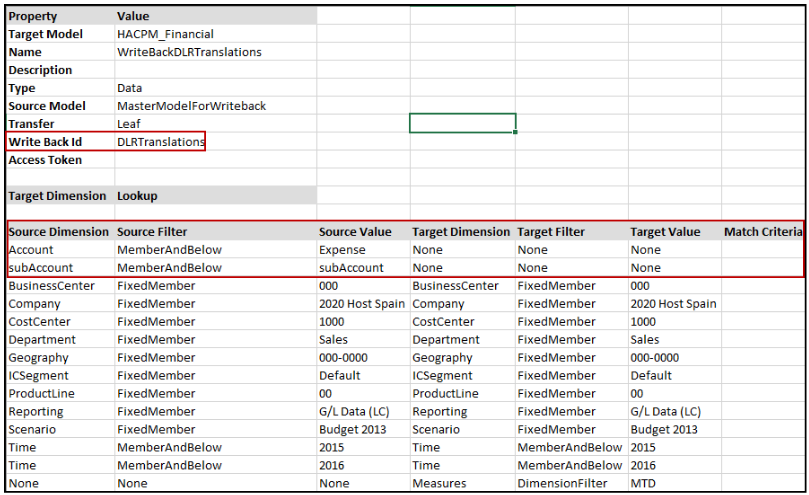
Source Dimension must be a dimension from the source model.
Attributes are not supported.
You must select AllMembers, MemberAndBelow, LeafMembers or FixedMember as the value Source Filter.
The values for Target Dimension, Target Filter, and Target Value must be None.
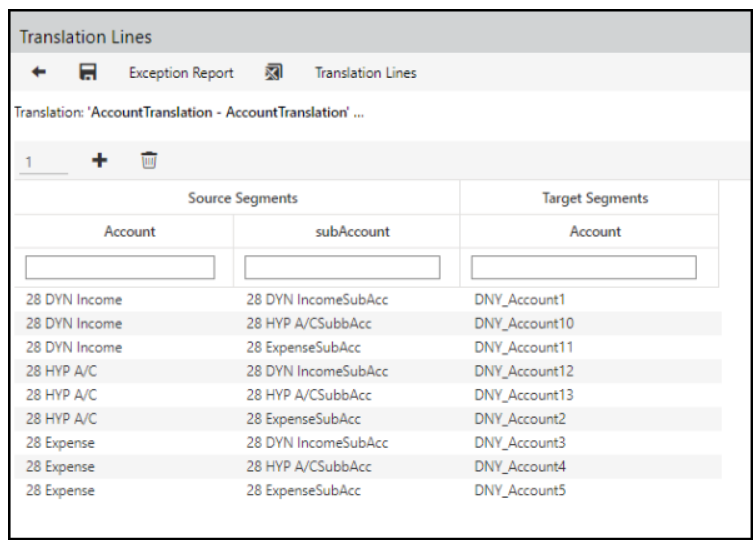
Additionally, it is not required to map all the PCR dimensions in the Target Dimension column. You can skip them by selecting the No Translation for Unmapped Target Segments check box in the Data Load Rule Write Back ID In this example (image above) the Data Load Rule type is Translations and Account and subAccount are the source dimensions in the MasterModelForWriteback for which the Translations are setup within PCR (shown in the image below). You can map Source dimensions using Translation Setup.
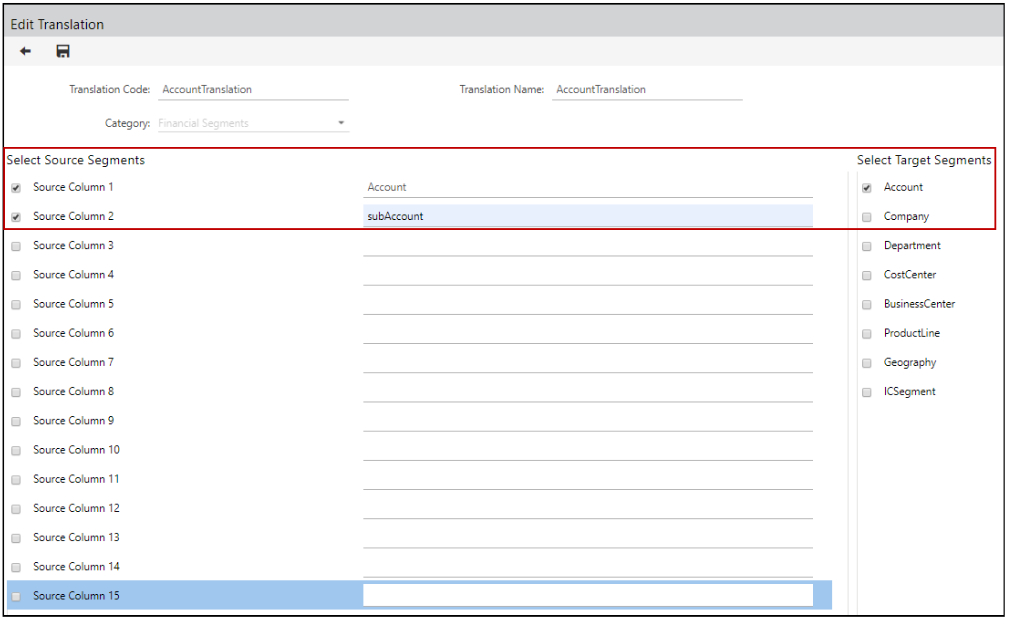
For more information on DLR and Translation Setup, refer to the Data Integration Admin Guide and Translations Setup.
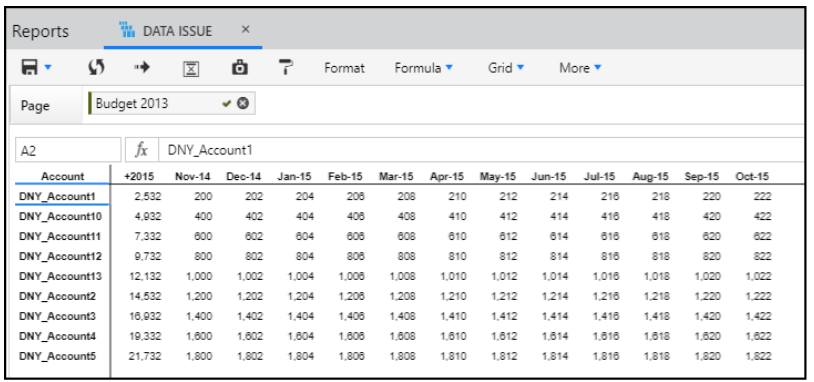
The image below displays the Transaction lines for the segments. In this example, two Source Dimensions are merged and mapped to the target; Account and subAccount Source Dimensions are mapped to Account. When you load data for the 28 DYN Incomeaccount Source dimension and 28 DYNIncomeSubAcc subAccount for the WritebackDLRTranslations model and running write back, the Account DNY_Account1 in PCR gets updated automatically as shown in the second image below.
The following scenarios provide a few examples where you can use Translations:
Mapping two source Segments to one Target Segment - In the above example, the Account and subAccount source segment are mapped to Account.
Mapping one Source Segment to one Target Segment - The subAccount Source segment is mapped to Account as shown in the image below. In the second image, the transaction lines for the segments are shown.


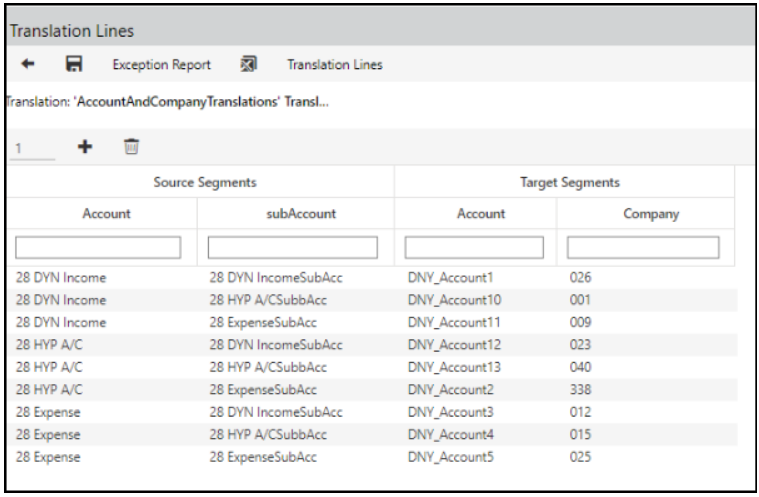
Mapping two Source Segments to two Target Segments - The Account and subAccount source segments are mapped to Account and Company as shown in the image below. In the second image, the transaction lines for the segments are shown.

Mapping one Source Segment to two Target Segment - The subAccount source segment is mapped to two dimensions as shown in the image below. In the second image, the transaction lines for the segments are shown.


Translation Requirements:
Source Segment names must match dimension names in the source Writeback Model.
Source Segment names must be unique across all Translations used by DLR.
“Source Column X” must be unique across all Translations used by DLR.
Consistency between DLR and Write Back Map:
- The Measure in the map must be identical to the DLR Data Type.
Platform: Level-Based Segment Hierarchy Load for NetSuite Connect
With this release, Level-based data load has been enabled for NetSuite Connect DLR in the Define Overall Rule Settings step. To define level-based segment hierarchies while loading data through NetSuite Connect, under the Build section, you can select the Level option.
Prior to this release, the Level option was disabled and only the Parent Child option was available for the Segment Hierarchies loads through NetSuite Connect.

The Allow Property Change functionality for Level-based Segment Hierarchies loads has been enabled with this release. The Allow Property Change check box allows property changes (such as Name, Currency, and so on) while loading segment hierarchies for existing members.
Platform: Year-to-Date and Account-based Data Type for NetSuite Connect GL Data Loads
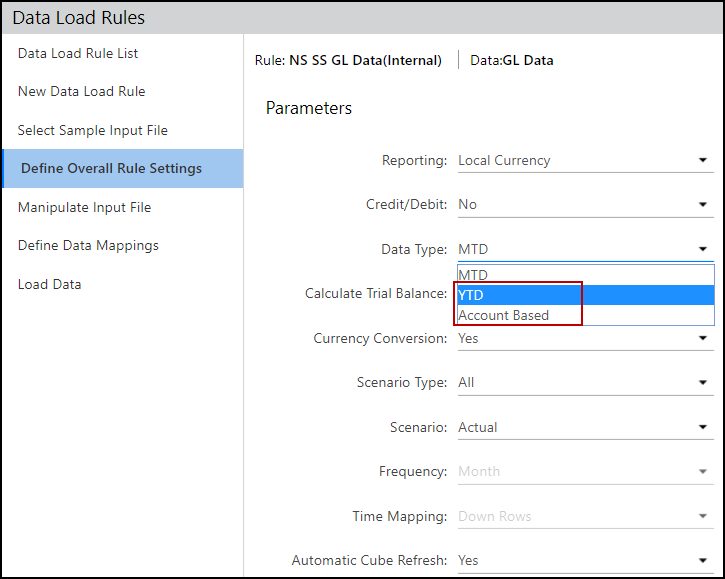
With this release, the YTD (Year-to-Date) and Account Based options have been enabled in the Data Type drop-down list for NetSuite Connect DLR in the Define Overall Rule Settings step. You can select YTD or Account Based as the data type while loading the GL data through NetSuite Connect.
Prior to this release, the YTD or Account Based options were disabled and only MTD was enabled for the NetSuite Connect GL data loads.
Platform: Enabled Copy-Paste DLR for All Customers
With this release, the Copy-Paste DLR option is available by default for all new and existing customers. The image below displays the Copy-Paste DLR option in the Load Type drop-down list.

Prior to this release, if you selected the Convert Copy-Paste to File Load option, all the Copy-Paste DLRs were converted to File Load DLR and the Copy-Paste DLR option was not available in the Load Type drop-down list.
Now you can create a Copy-Paste DLR even if you have selected the Convert Copy-Paste to File Load option.
Common: Added Hybrid User Authentication Mode
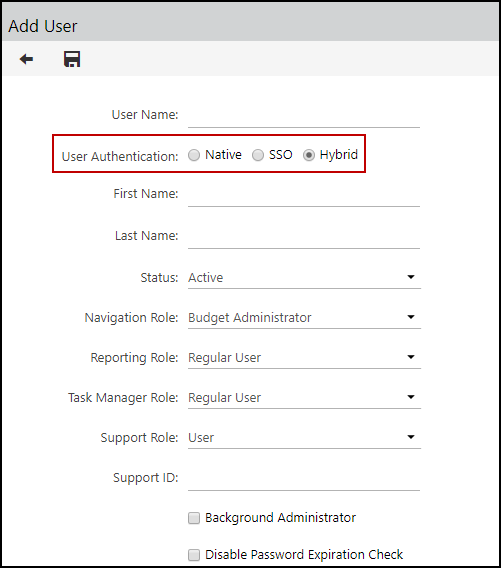
With this release, we have added Hybrid a new user authentication mode in the Add User page. The Hybrid mode provides you the ability to access the Host application using the Native and SSO mode. If a user is created with Hybrid user authentication, they can log in to Host Analytics using the Login page or through Single Sign-On or both. For now, Hybrid mode can be enabled only for new users.
In Practice: How to select the Hybrid mode
To select the Hybrid mode, navigate to Maintenance > Admin > User Management > click Add > select Hybrid.
The image below displays the Hybrid user authentication mode in the Add User page.
