Using Default Members in a Report in Excel
- 1 Minute to read
- Print
- DarkLight
- PDF
Using Default Members in a Report in Excel
- 1 Minute to read
- Print
- DarkLight
- PDF
Article summary
Did you find this summary helpful?
Thank you for your feedback
When creating a formatted report, typically you begin with a view and then convert the view to a report. In this case, all of the dimensions and members are already selected in the view before it is converted into a report. However, built into the Report designer now is the ability to see the default members when you create a new cell, as described below.
In Practice
Login to SpotlightXL.
Select Analyze > Data, and then select a model that has Direct Access to PCR.
Lay out the view as you wish and save it.
Select the Data menu, Design With, Report.
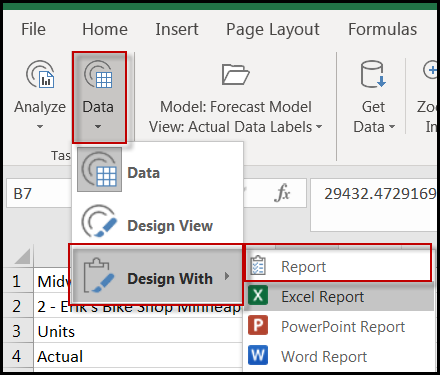
This opens the Report tab and displays the view with comments on each Spotlight cell.
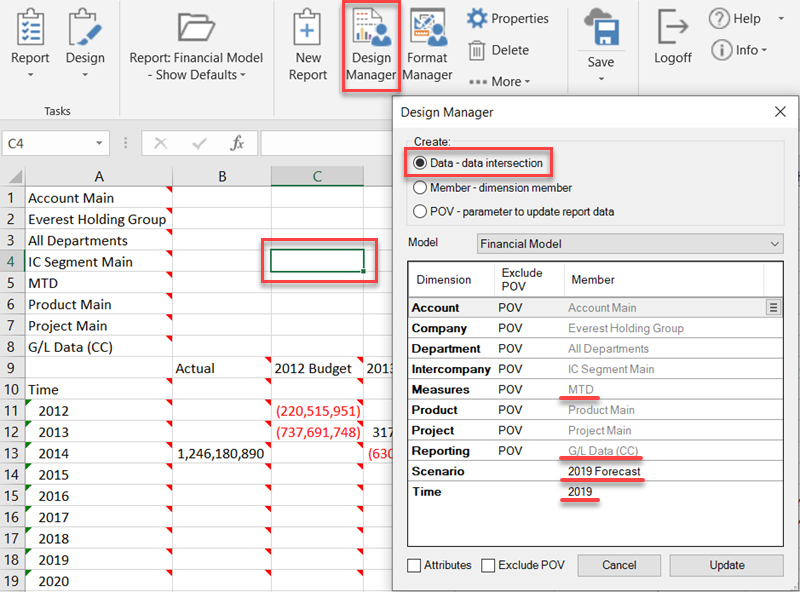
Put your cursor on any blank cell and then click Design Manager. Notice that the four system dimensions have their default member selected by default for a Data cell.
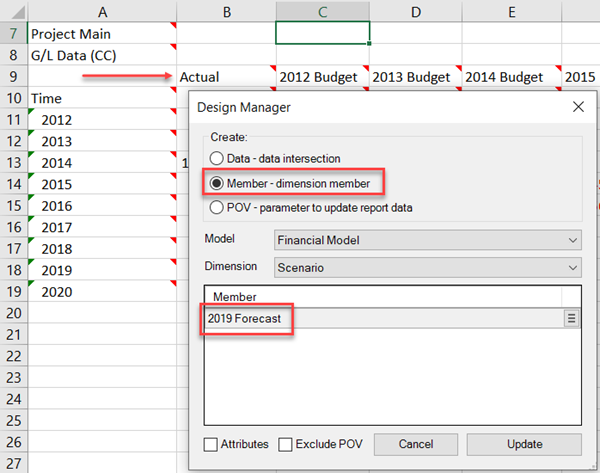
If you select Member, and then select one of the system dimensions on the row or column axis, again you see the default member automatically selected. You can use the member select icon to pick any other member of the dimension that you have access to. In the following example, Scenario is on the column axis and 2019 Forecast is selected by default.
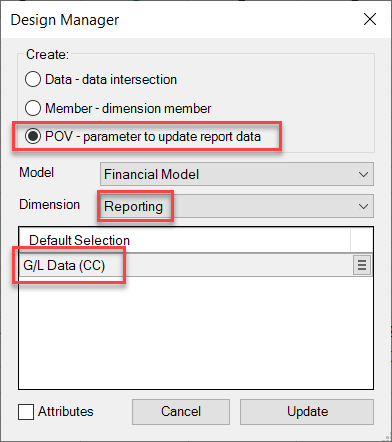
Similarly, if you select POV, and then select one of the system dimensions, you see the default member automatically selected. You can use the member select icon to pick any other member of the dimension that you have access to. In the following example, Reporting is a POV dimension and G/L Data (CC) is selected by default.
Was this article helpful?