Using Spotlight for Office in Word
- 1 Minute to read
- Print
- DarkLight
- PDF
Using Spotlight for Office in Word
- 1 Minute to read
- Print
- DarkLight
- PDF
Article summary
Did you find this summary helpful?
Thank you for your feedback
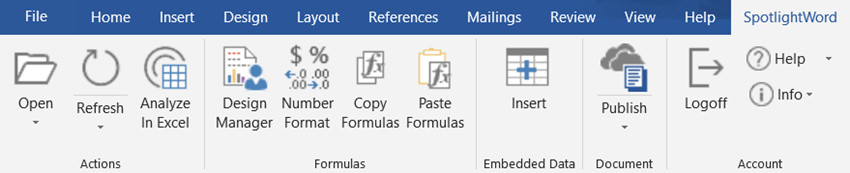
| Menu Ribbon Item | Purpose |
|---|---|
Refresh, Refresh All Open Reports | Connects to the Dynamic Planning data source and retrieves the data value for each cell on the current page. Each cell is defined by a member intersection, which you can view with the Design Manager. You can update all data for all page and open documents by selecting Refresh All Open Reports. |
Analyze in Excel | For the current data cell selected, returns you to Excel and displays the member intersection where the data came from. You can then zoom in on any of the dimensions to learn how the data item was derived. |
Design Manager | Opens the Design Manager box and displays the member intersection or dimension information for the current cell selected. If the current cell is a data item, Design Manager displays the model, and all the dimensions and members that describe the data. If the current cell is a dimension or member name, Design Manager displays the model, dimension, and member name. In the Design Manager, you can change all non-POV dimension members associated with the current cell. Click the Member Select icon next to the current value, select a new member, and click Select. Note: You can also double-click a cell to view the metadata associated with it. |
Number Format | Opens the Format Cells box and lets to you select a formatting style for the selected data cells containing numbers, similar to the options in Excel. To change the format, select the category of number format you want, specify options, and click OK. |
Copy Formulas | Copies the metadata and data formulas associated with the selected cell(s) to the Clipboard. These formulas can then be pasted into another page or document in Word, into SpotlightXL, or into SpotlightPPT. |
Paste Formulas | Pastes the metadata and data formulas from the Clipboard to the current page in SpotlightWord. |
Select Data | Specifies the range of data items to be used in a chart. |
Edit Data in Excel | Allows you to use the Excel interface to paste in the cells from Spotlight that will be used in a chart. |
Was this article helpful?