- 1 Minute to read
- Print
- DarkLight
- PDF
Dynamic Planning Using Substitution Variables and Expressions with Excel Reports
- 1 Minute to read
- Print
- DarkLight
- PDF
Overview
Substitution variables and substitution variable expressions are used in reports in place of dimension member names to make report maintenance easier. Both formatted reports and Excel Reports can use substitution variables and substitution variable expressions. Substitution variables and expressions are defined by a Power or Contributor user with a particular value, however the value can be dynamically modified at runtime by end users.
You can set up the substitution variables and expressions in a formatted report and then Capture it to convert to a Excel Report. Or you can set up the substitution variables and expressions directly in the Excel Report. A Substitution Variable menu item is available on the ribbon to make it possible for users to change the value of the variable while using the report.
Creating Substitution Variables In Excel Reports
The process is the same as for formatted reports.
- Power or Contributor users create one or more substitution variables in the model.
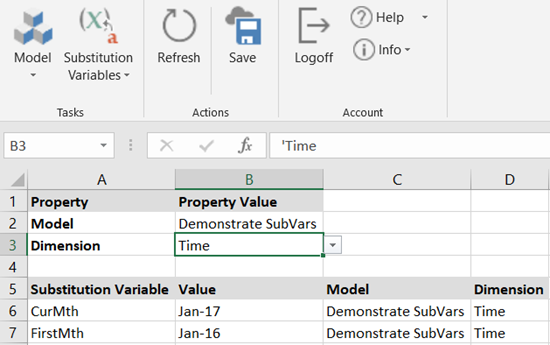
- Power or Contributor users create one or more Excel Reports and insert the substitution variables.
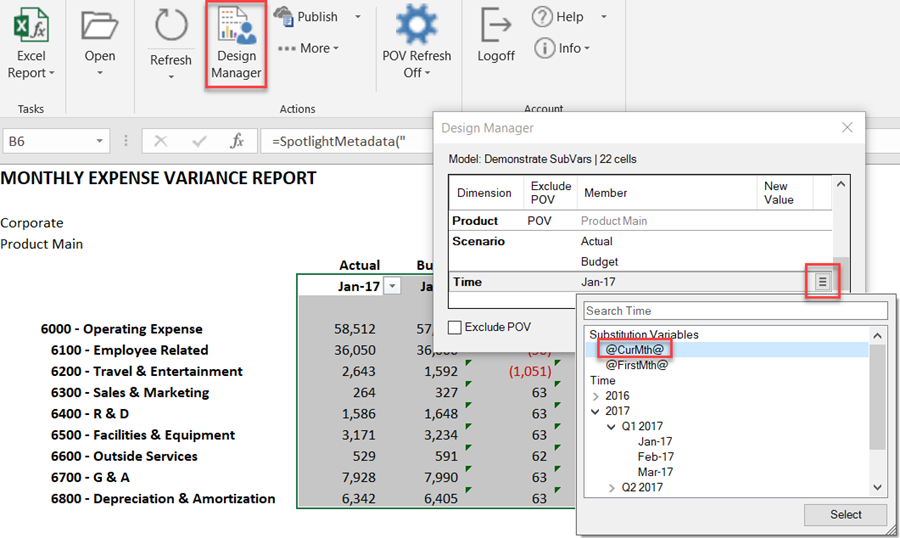
- Power or Contributor users specify substitution variable expressions in the design of the report. See Example Substitution Variable Expressions for details about expressions.
- Users can change the value of the substitution variable using the Substitution Variables menu item from the Excel Report ribbon.
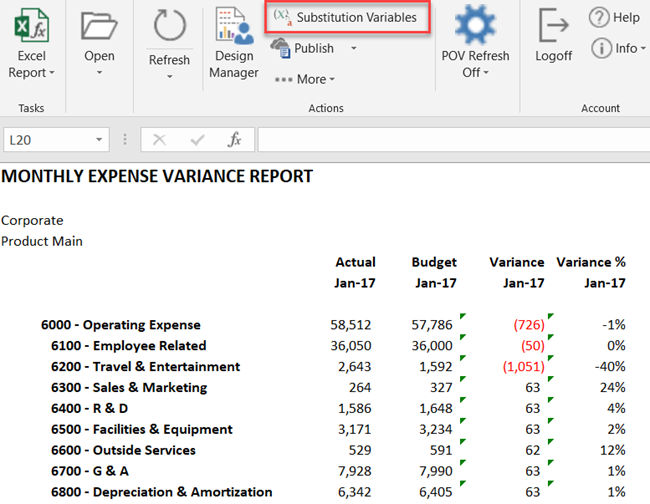
- With the cursor anywhere in the report, click Substitution Variables. The Substitution Variables box appears. It shows the name of the variable and the current value.
- Click the Member Select icon.
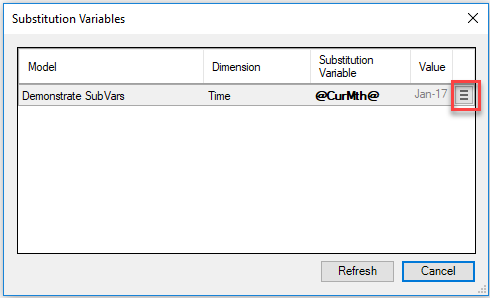
- From the member selection box, select the month that you want to see in the report.
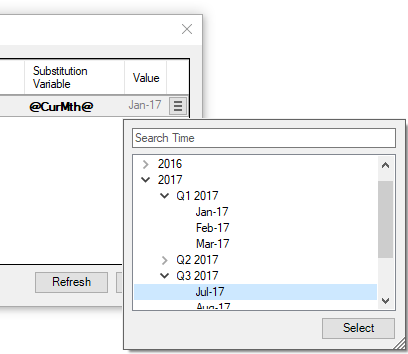
- Click Select.
- Click Refresh to refresh the report.
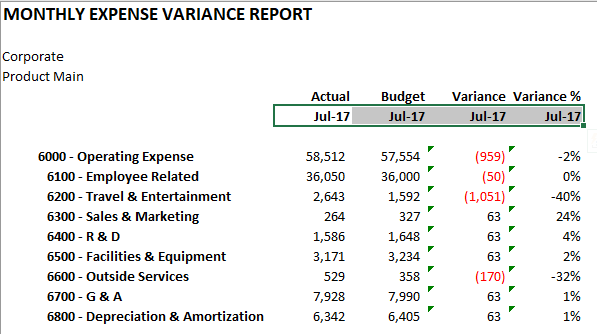
The report now displays data for July 17. Using this method, the user can easily move back and forth between months, quarters, or years, without updating the definition of the report and without the need for the Contributor or Power users to update the substitution variable value permanently.