Winter18 Release Notes
- 48 Minutes to read
- Print
- DarkLight
- PDF
Winter18 Release Notes
- 48 Minutes to read
- Print
- DarkLight
- PDF
Article summary
Did you find this summary helpful?
Thank you for your feedback
Planning
Global Fields Mass Load & Output Options
Global Fields Mass Load & Output Options
Mass Upload
Global Fields are used to drive budget assumptions and calculations. Administrators now have the ability to upload changes and adjustments to existing Global Field values at a mass level. This eliminates to need to interact with Global fields on a manually entity by entity basis.
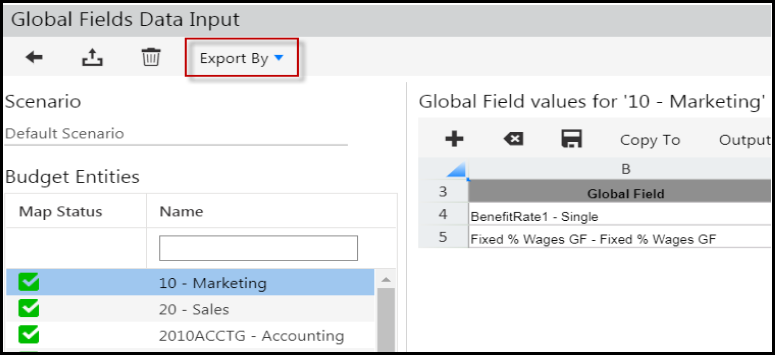
Access the Global Fields Data Input page by navigating to Maintenance >Templates > Global Fields.
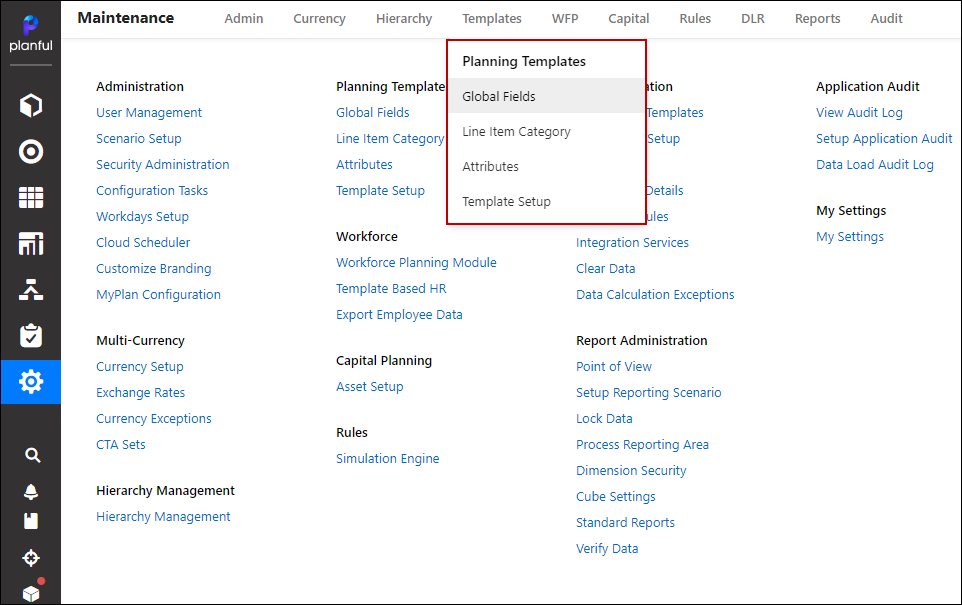
Select a defined Global Field value, then click the Global Fields Data Input option.
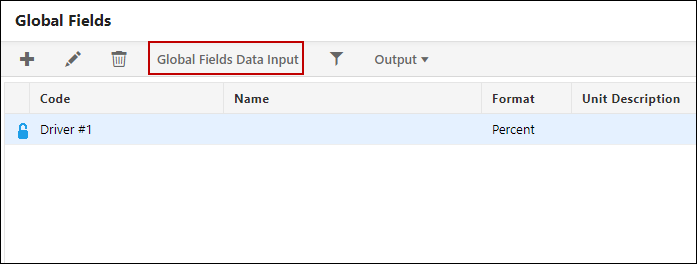
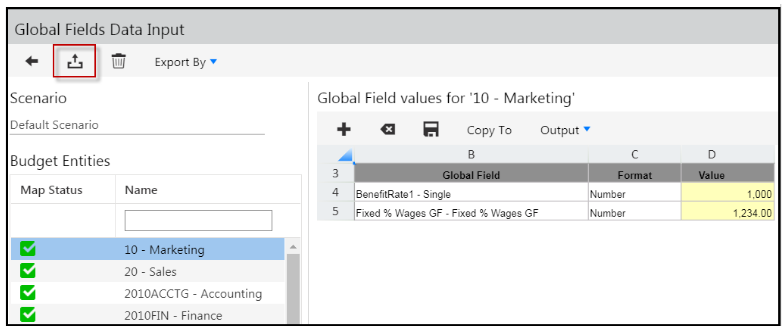
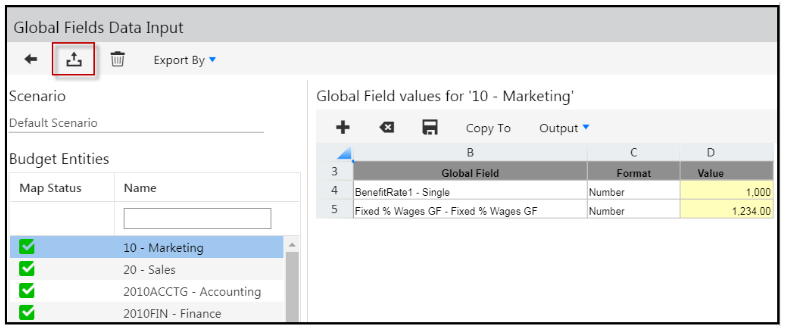
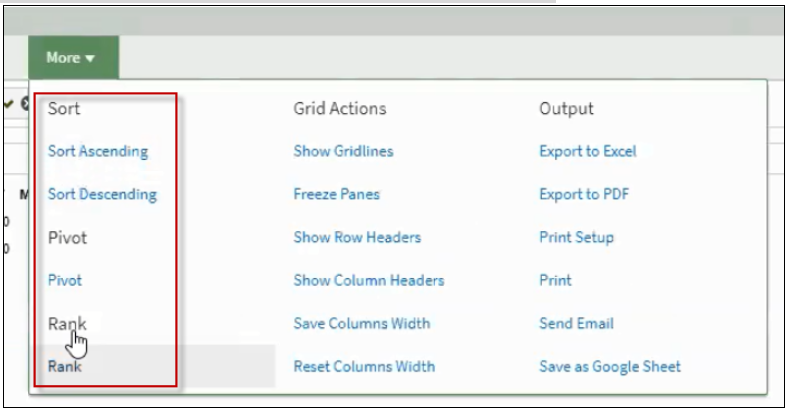
The Global Fields Data Input page is displayed (shown below), the Upload file button is also shown.
Note:
The purpose of the Upload file button is to allow administrators to upload changes and updates to all Global Field values by entity without having to enter values one at a time.
Global Fields Mass Load - Additional information
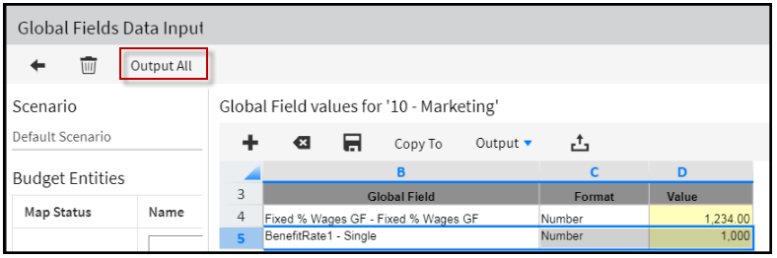
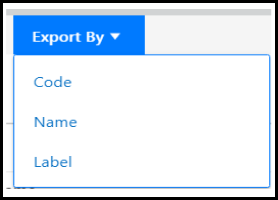
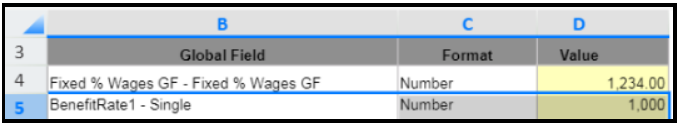
The Output All field has changed to Export By as shown below. This new option allows you to export all Global Fields by Name, Code, or Label (name + code). This option is useful when trying to make a large number of Global Field changes or adjustments. Please see the before and after view below for your reference.
Prior to change (before):
Updated page (after):
Global Fields Mass Load - In Practice
If you want to make a large number of changes or adjustments by entity to a large number of fields, the best practice way to do so is to use this Global Fields Mass Load feature. If you only want to make a small number of changes to a handful of entities, it is best practice to do that manually, it can be easier and fast. Below are the necessary steps for using the Global Fields Mass Load feature.
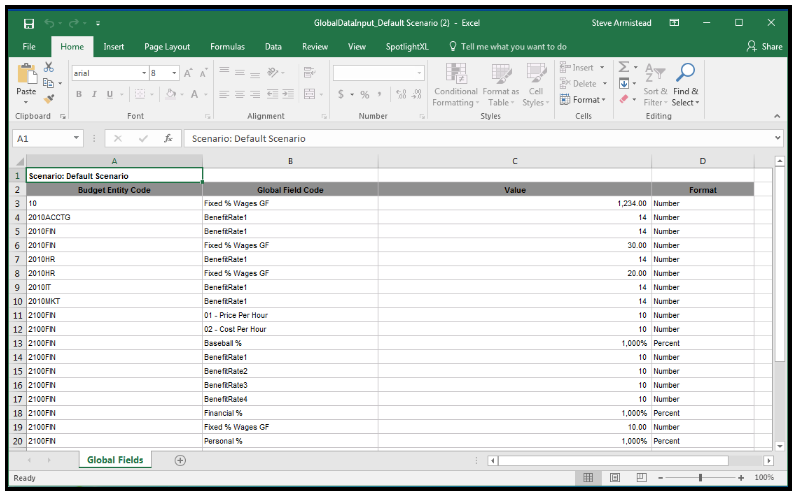
In this use case, we have a Global Field defined called BenefitRate1 and it has two lines; Fixed % Wages GG and BenefitRate 1 - Single. I want to make a large number of changes for multiple Budget Entities.
Step 1: Use the Export By feature explained above to export the Global Fields by Budget Entity Code. You should have a file that looks like the one in the screenshot below.
Step 2: Once the file is exported, make the necessary adjustments and save the newly exported file to your local machine. You have two options:
- Remove the header row and upload the file.
- Leave the header row. This option will result in an error upon loading. The error occurs due to the header row, but the data will be loaded. For example, you load a file with 1 header row and 10 data rows. Only the header row fails because it has invalid. The other 10 data rows are uploaded.
Step 3: Instead of selecting each line clicking the Copy To option and selecting the entities to copy the global field to, click Upload file, to upload the file with the Global Field adjustments that you just saved to your local machine.
Step 4: Select the saved file to load, by clicking the Choose File button.
Note:
You can upload XLSX file types only with a maximum size of 10MB and 30k rows.
Step 5: Click Submit to perform the upload.
A message will appear indicating the upload is processing and you can check the status in the Detail Log.

Global Search Expanded
Global Search allows you to search for application pages versus using the navigation. Global Search is now available for all Planning application pages.
In Practice
To use global search to locate a Planning application page:
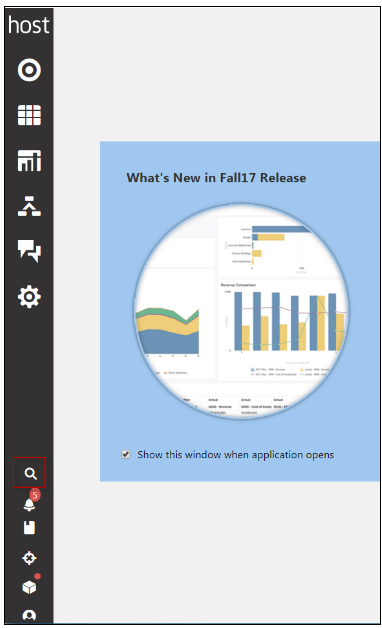
Step 1: Click the magnifying glass icon as shown below.
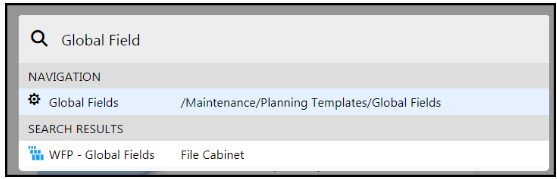
 Step 2: Enter the name or partial name of the page. Results display.
Step 3: Select results to launch the desired page.
Consolidation
Standard Journal Entries Available for Budget Scenarios
Standard and Recurring Journals Available to Copy from One Scenario to Another
Copy Single or Multiple Journals, Validations and Reclassifications Across Scenarios
Performing Entry Actions on Multiple Entries
Standard Journal Entries Available for Budget Scenarios
Add Standard Journal entries to Budget scenarios. In the past, you could only add a Standard journal to the Actual scenario.
To copy journal entries, see the topic below called Standard and Recurring Journals Available to Copy from One Scenario to Another. To add a journal entry to a Budget scenario, perform the following steps:
Step 1: Access the Consolidation Control Panel.
Step 2: Select a Budget scenario in the Scenario field.
Step 3: Click the Standard Journals process.
Step 4: Click the Add button.
Step 5: Complete the fields on the Add Standard Journal page. For information on how to do so, click here.
You’re done!
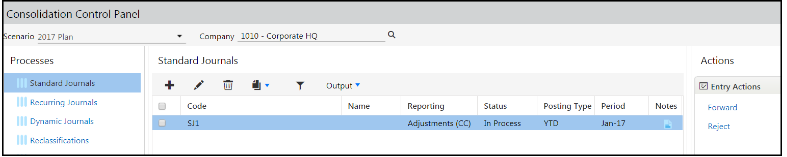
An example is shown below where the Budget scenario is called 2017 Plan and the SJ1 Standard Journal entry has been added.
Standard and Recurring Journals Available to Copy from One Scenario to Another
Standard journals are created for processing one-time journal entries. A Recurring journal contains entries that are consistent for each period within the process. For example, if you have an annual expense (such as rent) you can accrue the expense in twelve equal payments every month with a recurring journal entry. A debit and credit to the appropriate segment intersections will be created every month.
With the Fall17 release we delivered functionality to copy Dynamic and Recurring journals from scenario to scenario. Now, with this release, you can copy Standard and Recurring journals from one scenario to another.
The benefit of copying journals is to eliminate the need to manually recreate journals for a different scenario. When you perform a copy, all associated entries/lines and MDX formulas/rules are copied as well.
In Practice
To copy a standard journal from one scenario to another:
Step 1: Open the Consolidation Control Panel.
Step 2: Select the Standard Journal process from the left pane.
Step 3: Select the entry or entries from the middle pane.
Step 4: Click the Copy button and select Copy Multiple. The Copy page appears.
Step 5: Enter a Code and Name and select period dates.
Step 6: Select the Target Scenario and complete all selections based on process being copied.
Step 7: Click Save.
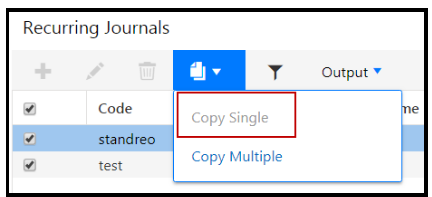
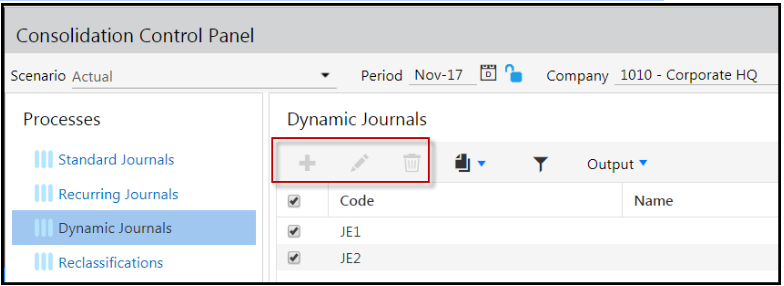
Copy Single or Multiple Journals, Validations and Reclassifications Across Scenarios
Instead of a single copy button for journals, validations and reclassifications, we’ve added two copy options; Copy Single and Copy Multiple. Use Copy Single when you want to copy within the scenario. Use Copy Multiple to copy from scenario to scenario.
Copy Single - In Practice
Copy Single allows you to copy a single journal, validation or reclassification. Copy Single does not copy from scenario to scenario but within the scenario only.
To perform a Copy Single:
Step 1: Access the Consolidation Control Panel.
Step 2: Select the scenario you want to copy the Standard Journals from.
Step 3: Select a process (i.e. Dynamic Journals) and click the checkbox next to the journal entry, validation or reclassification you want to copy.
Step 4: Click the Copy icon and select Copy Single.
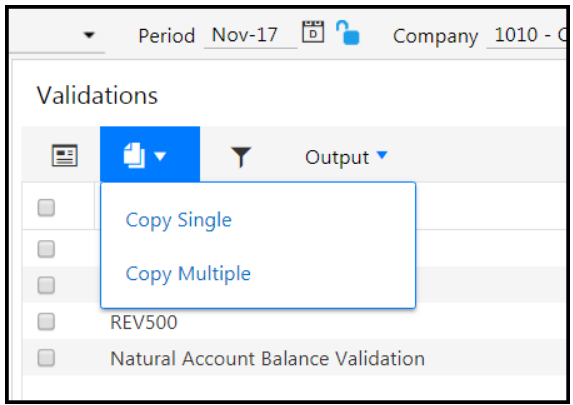
Steps vary from here based on the process selected (i.e journal versus reclassification).
Copy Multiple - In Practice
Copy Multiple allows you to copy from one scenario to another. Steps are provided below.
Step 1: Access the Consolidation Control Panel.
Step 2: Select the scenario you want to copy the journals from.
Step 3: Select a process and click the checkbox next to the entry you want to copy.
Step 4: Click the Copy icon. Select Copy Multiple. The Copy page appears.
Step 5: Enter a Code and Name and select period dates.
Step 6: Select the Target Scenario.
Step 7: Complete all selections based on process being copied.
Step 8: Click Save.
If you select multiple entries to copy, the Copy Single option will not be available for selection as shown below.
Note:
When a copy is performed, the action is logged in the Audit Log.
It is a best practice to limit the number of journals and journal lines you copy to a combined total of 30,000 (journals + lines). For example, 1000 journals with no more than 30 lines. Or, 60 journals; each of which have no more than 500 lines.
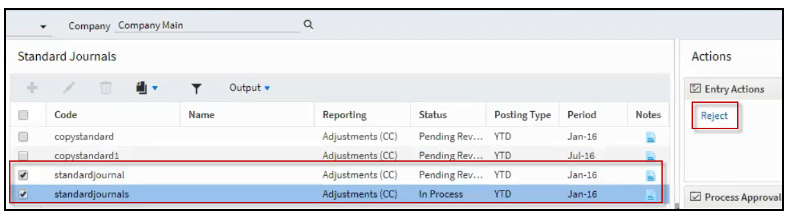
Performing Entry Actions on Multiple Entries
You can select multiple journal entries and perform a common entry action, such as forward or reject, when the selected entries have the same status. However, if you select entries that have a different status (one is “in process” when the other is “pending review”, for example) then only the common action available for both entries is enabled.
This functionality is available for Standard, Recurring, and Dynamic journals as well as Reclassifications and Validations.
In the example below, the standardjournal entry is pending review while the standardjournals entry is in process. The only common entry action is Reject.
Deselect an entry to see all actions available for the single entry.In the example below, only one entry is selected and an additional action (Forward) is available.
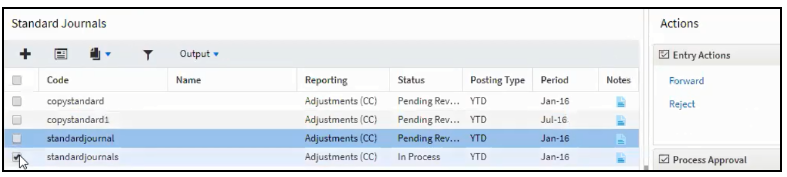
When you select multiple entries, some buttons will be greyed out as shown below.
Dashboards
Bubble and Scatter Chart Enhancements
Substitution Variables on Axis Name
Moved Favorites and More Options
Expand and Collapse Chart Icon
Moved Text, Filter, and Table Icons
Streamlined Filter Functionality
Reset of User Selections on Global Filters
Global Search and Bookmark Enabled for Dashboards
Workforce Reporting Security for Dashboards
New Dashboard Edit Option
Select to edit a dashboard directly from the dashboard thumbnail. In the past, you had to open a dashboard in View mode and then click Edit. Now, you can select the More menu on the dashboard thumbnail and the dashboard will open in Edit mode. This new option reduces clicks and is available for users with Edit or Full access to the dashboard.
In Practice:
Step 1: Open Dashboards.
Step 2: Click More on a dashboard tile.
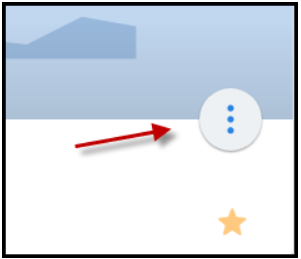
Step 3: Select Edit. The dashboard opens in Edit mode.
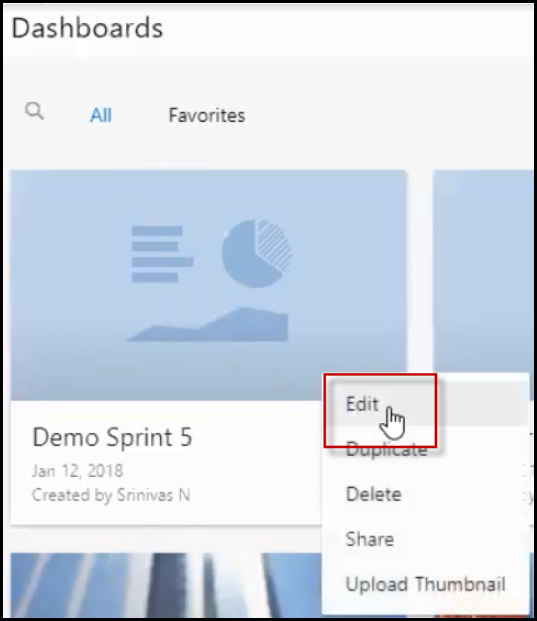
Chart Type Change Enhancement
When changing the chart type of a selected chart, Dashboards now provides compatible chart selections. Incompatible selections are not available for selection. For example, the image below shows a Bar type chart. The Bar type chart is selected and compatible charts are shown in the list-box.
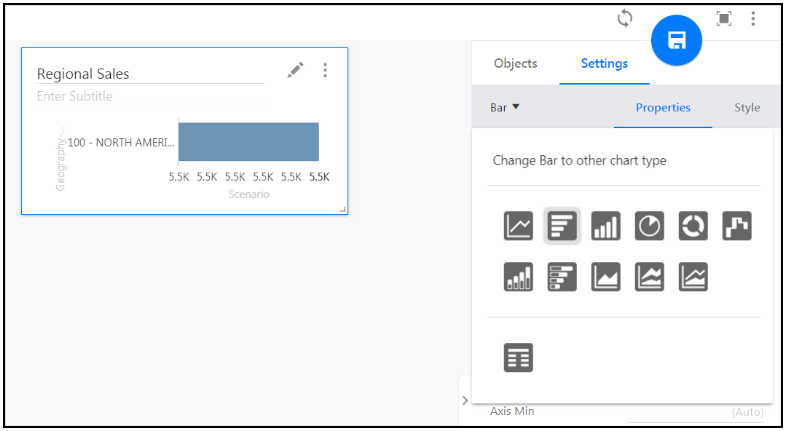
In Practice
To change the chart type, complete the following steps:
Step 1: Open Dashboards.
Step 2: Select a dashboard and click Edit.
Step 3: Select a chart in the dashboard.
Step 4: On Settings tab, click the chart list-box.
Step 5: Select a compatible chart. The chart is updated immediately.
Step 6: Click Save.
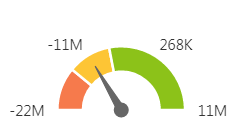
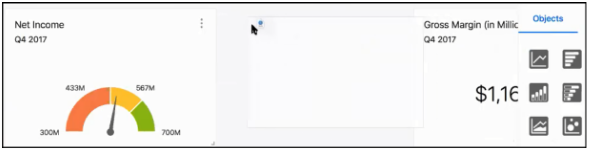
Gauge Chart
A new Gauge type chart is available from the Objects tab. Gauge charts are helpful visual indicators that use pointers to display information similar to reading a dial.
In Practice:
Step 1: Open Dashboards.
Step 2: Edit a dashboard or add a new one.
Step 3: Click Objects and select the Gauge chart icon as shown below.
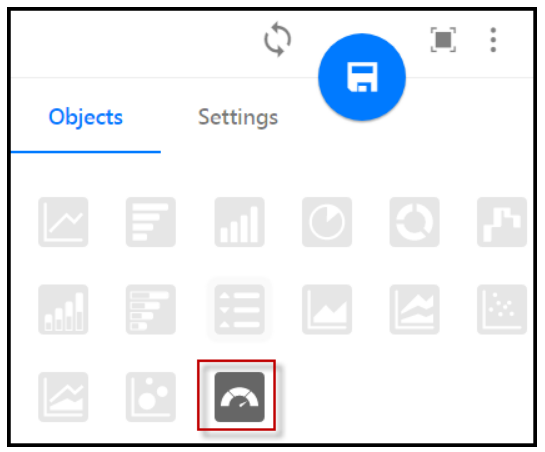
Step 4: Drag and drop the icon to the canvas. An example gauge chart is shown below.
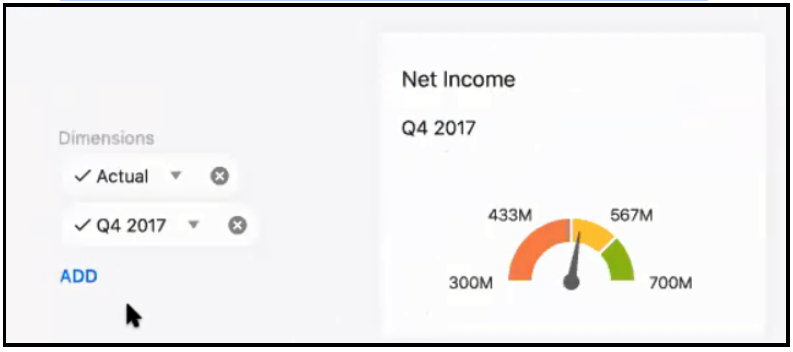
Step 5: Complete Gauge chart settings.
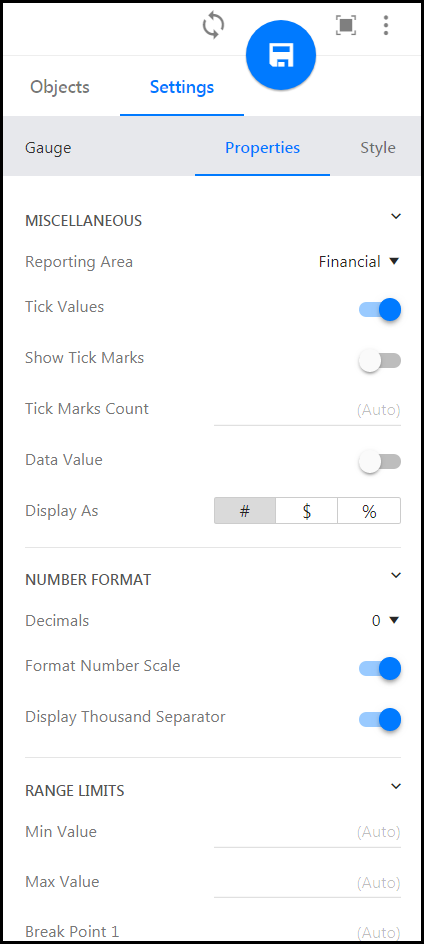
Show or hide tick values.
Tick mark values displayed:
Tick mark values hidden:

Show or hide tick marks.
Tick marks displayed:
Tick marks hidden:

For Tick Marks Count , enter the number of tick marks you want displayed.
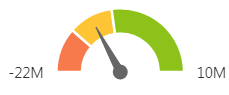
Only one member can be selected on each dimension. As with all charts, all member selections are subject to dimension security. Settings enable selection of Min, Breakpoint 1, Breakpoint 2, Max value, Low Range Color, Middle Range Color, and High Range Color.
Dashboard filters are applied when the selected dimension exists on the page or do not exist on the chart.
When a chart is run, the colors are applied as follows:
Low Range Color - applied for the range between min to breakpoint 1
Middle Range Color - applied between breakpoint 1 and 2
High Range Color - applied beyond breakpoint 2
Scale is split based on the Min & Max values selected.
Show/Hide Axis Name
Display or hide chart axis name for the horizontal and vertical axis. This flexible option allows you to further customize the look of your charts.
In Practice:
Step 1: Open Dashboards.
Step 2: Edit a dashboard or add a new one. If you add a new one, drag and drop a chart to the canvas.
Step 3: Select the chart and click the Settings tab.
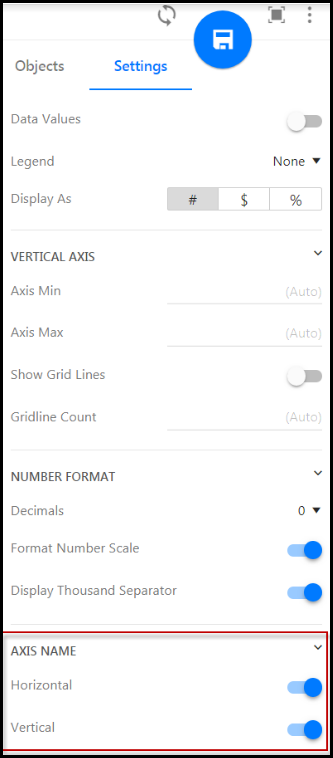
Step 4: Scroll to the bottom.
Step 5: Slide the blue buttons to the right to show the horizontal and vertical axis names. Or, slide the buttons to the left to hide the axis names.
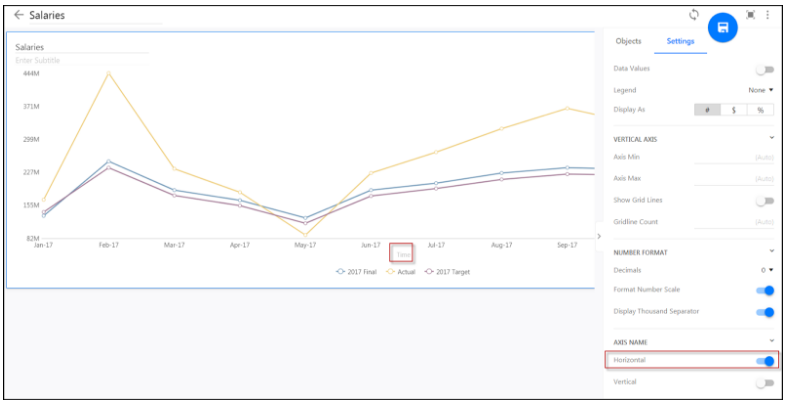
Example Line chart with Horizontal Axis Name displayed and Vertical Axis Name hidden:
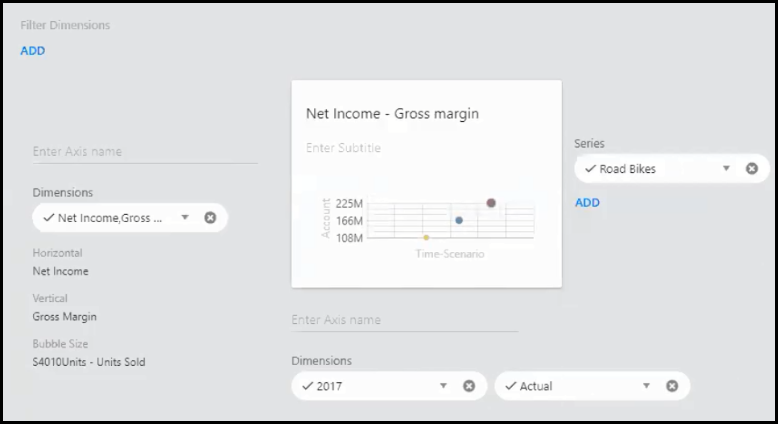
Bubble and Scatter Chart Enhancements
Enhanced user-interface for Bubble and Scatter type charts. Row and column selections are now more intuitive as well as the dimension representing the bubble size and horizontal and vertical line representation.
In the image below, the horizontal axis name is Time Scenario, which represents the dimensions on that axis and the vertical axis name is Account. You can opt to hide the axis names. For information on how to do so, see the Axis Name topic in these Release Notes.
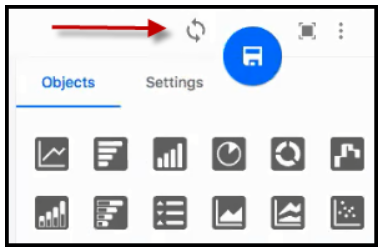
Refresh Dashboard
A new option is available to refresh dashboards. Refreshing a dashboard without saving it will return it to the state it was in prior to any selections you made as long as they were not saved.
You might want to refresh a dashboard when you want the latest data or when you’ve interacted with charts and tables.
In Practice
To refresh a dashboard:
Open the dashboard in Edit mode.
Interact with the dashboard as needed.
Click the Refresh icon shown below.
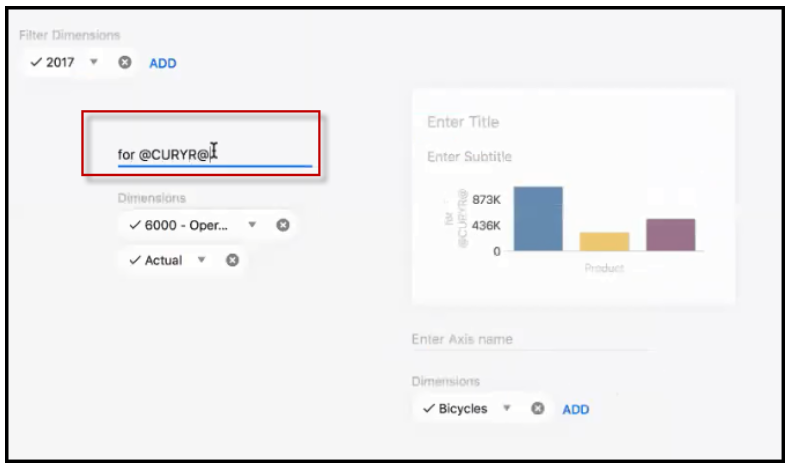
Substitution Variables on Axis Name
A substitution variable replaces a multidimensional expression with a value. For example, the @CURYR@ variable will pull the current year value.
Now, you can use a substitution variable on the axis name of a chart. Previously a substitution variable was allowed on titles, subtitles, and member selections only.
In Practice
To use a substitution variable on the axis name of a chart:
Step 1: Access Dashboards and select a dashboard to open in Edit mode.
Step 2: Drag and drop a chart to the canvas or select a chart to edit.
Step 3: Click Axis Name. Enter a substitution variable. In the example below, the current year substitution variable is used. This is one of the many substitution variables Host Analytics delivers with your application.
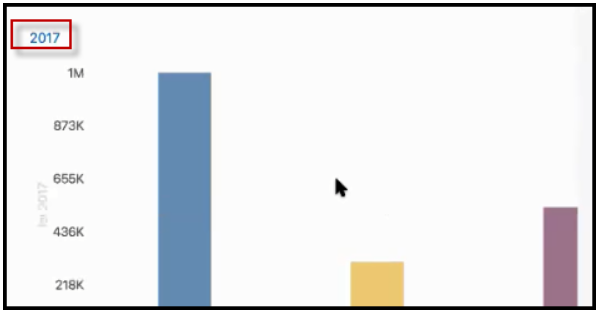
Step 4: Save the dashboard. Notice the chart is now updated with the current year as shown below.
Custom Color Schemes
Customize your charts with custom and themed color schemes. You might choose to use your organizational colors. Or, use color as a visual indicator to quickly identify gains and losses or over and under performing departments.
Note:
For all chart types, multiple color theme (Theme 1) is applied by default.
In Practice
To add a delivered or custom color scheme:
Step 1: Access Dashboards.
Step 2: Open a dashboard in Edit mode.
Step 3: Select a chart. The Settings screen appears.
Step 4: Click the Style tab. Notice that the chart type is displayed. In this example it is a Bar chart.
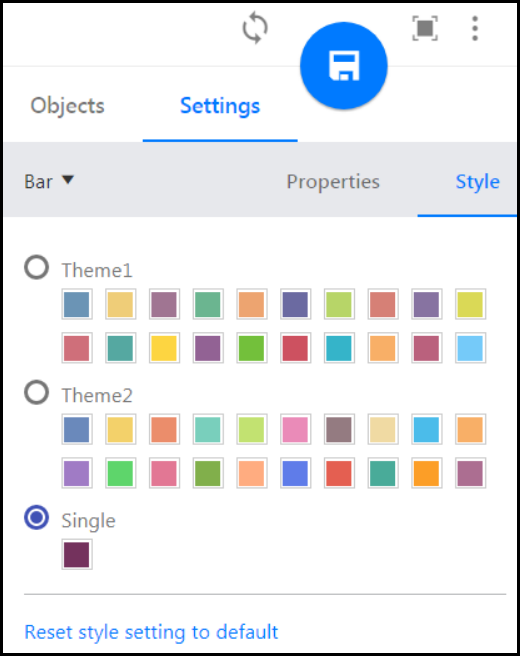
Step 5: There are two options; Single and Multiple. Selecting Single displays a single color palette. Selecting Multiple allows you to select from default themes or design your own color scheme.
Step 6: Select a color scheme by selecting Theme 1 or 2. Notice that the chart (of type Line) is updated immediately.
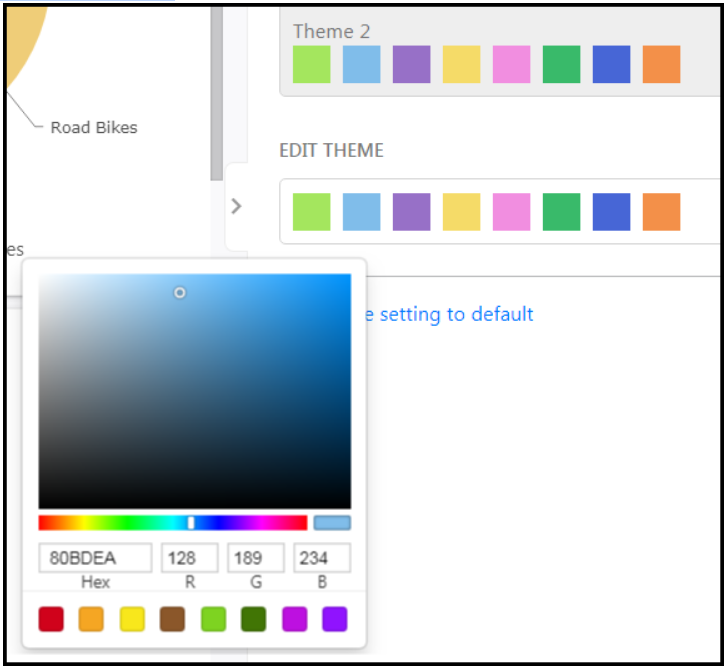
Step 7: Alternatively, select a custom theme. For every color in the selected theme, customize it by selecting a custom color as shown below. Enter an RGB, a color number, or drag the cursor around the color grid to find the desired color.
Step 8: Click to save.
At any time you can return to the default color scheme provided by Host Analytics by clicking Reset style setting to default.
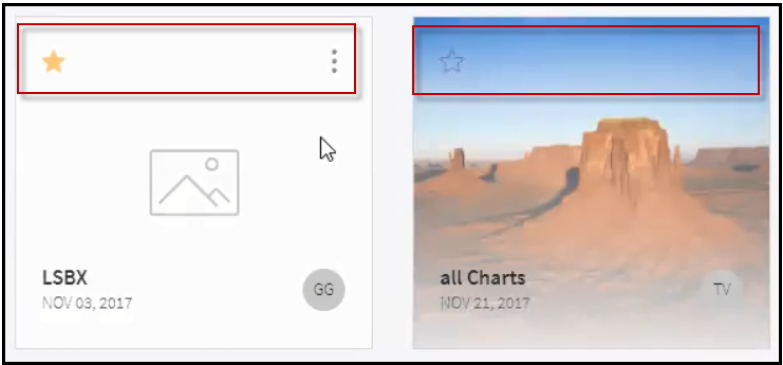
Moved Favorites and More Options
Dashboards Favorites and More Options (for the thumbnail) icons have been moved to the right-hand corner of the dashboard to eliminate interference with the thumbnail image displayed. An example is shown below.

Prior to this release, the location of Favorites and More is shown below.
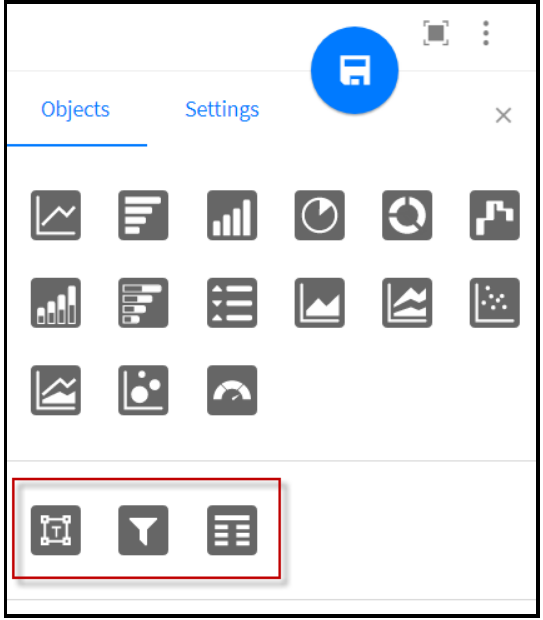
Moved Text, Filter, and Table Icons
The Text, Filter and Table icons are now located under the charts icons on the Objects tab as shown below.
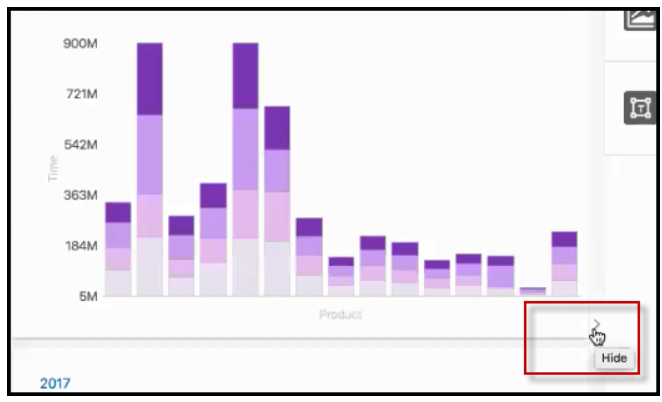
Expand and Collapse Chart Icon
The icon to expand and collapse a chart pane has changed. The new icon is shown below. Select the arrow to hide or display (expand) a chart.
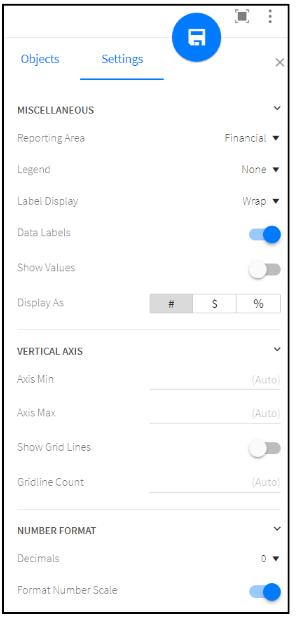
Streamlined Settings
The options available on the Settings tab have been streamlined for improved visibility and consistency as shown in the images below.
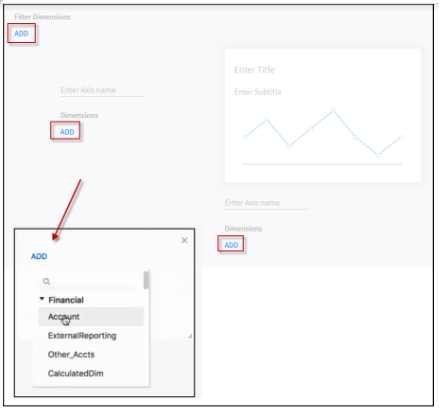
Streamlined Filter Functionality
Page filters no longer need to be dragged and dropped from the right pane and are now available on the page as shown below. When you add a filter, an Add option is available to filter dimensions (shown below). You can use type ahead and search when filtering.
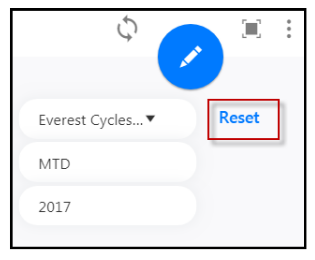
Reset of User Selections on Global Filters
Users can now reset a chart or charts in a dashboard after dimension member selections for a dimension on a chart axis have been saved. For example, let’s say a user selects dimension member 123 instead of 789 on the axis of a chart and saves the dashboard. The 123 selection is retained the next time the user accesses the dashboard. However, let’s say the user then decides that he or she wants the chart returned to the previous state (with dimension member 789 displayed). To make this happen, the user clicks the Reset button shown below.
Drag and Drop Charts
In the past, you could not drag and drop charts between two existing objects. Now, you can do so if there is enough blank canvas space between charts/tables. This means that new charts can be added wherever you like instead of at the end, which was the default behavior.
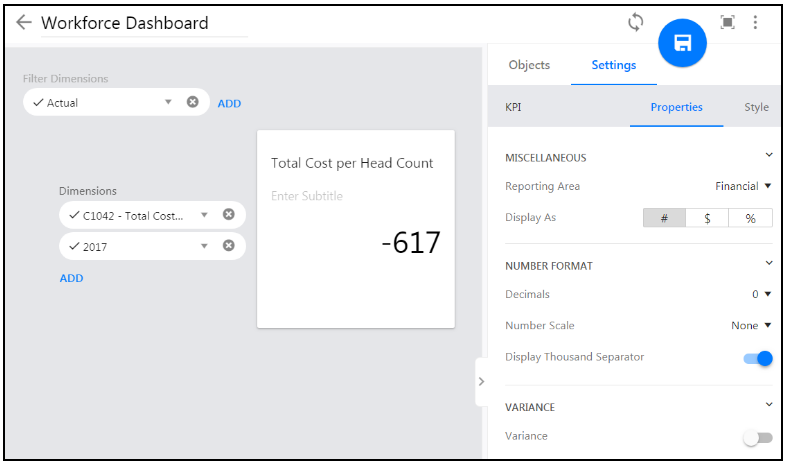
KPI Chart Update
For KPI charts, we’ve removed the row and column selections. Now, you select from a list of dimensions to the left of the chart as shown below. There is no limit to the number of dimensions you can add, but only one member can be selected on each dimension and the chart output will remain as a single value result.
Note:
Single value KPI charts that exist prior to the Winter18 release will be migrated to the new user-interface as displayed in the image above (with dimensions listed on the side of the chart opposed to the row and column). All other KPI charts will remain as they were prior to the Winter18 release.
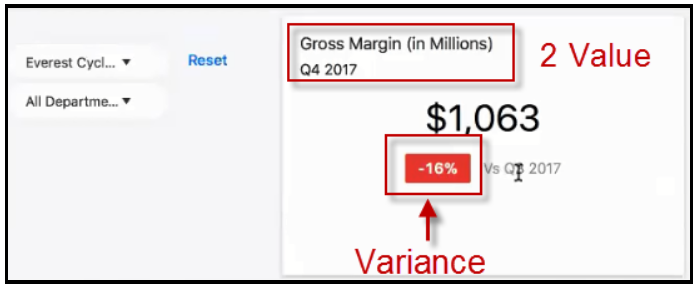
2 Value KPI Chart with Variance
KPI charts now display 2 values versus the 1 value available in prior releases. You can also include a variance against a compare dimension and add corresponding text. These additional options provide more flexibility to extrapolate the data you want to display.
In Practice
In the example below, gross margin is compared for Q4 and Q3 of 2017. Percentage is shown for variance, but you can opt to display as a number (versus percentage) in the Settings - Property pane. The variance default negative color is displayed in red. The variance default positive color is green.
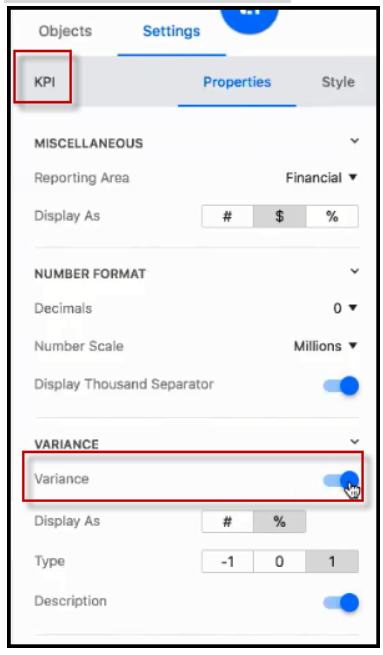
Steps to create a 2 value KPI with a variance and description:
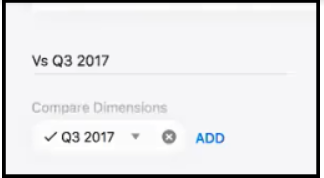
Step 1: Ensure Variance is turned ON. Click the Settings pane and select the Properties tab. Slide the button for Variance to the right as shown below. The Compare Dimensions prompt is displayed beneath the KPI Chart.
Step 2: Select a single member from each dimension as shown below. Notice that checkboxes have been removed from the selection hierarchy. Now, you can just select the member.
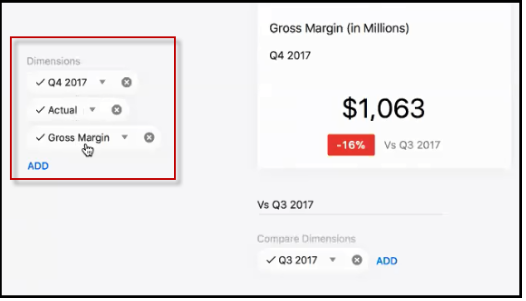
Step 3: Select compare dimensions. You can add up to 2 compare dimensions for each KPI.
Step 4: To add a description, ensure the Description field is turned ON. Click the Settings pane and select the Properties tab. Slide the button for Description to the right as shown below. Enter the description above the Compare Dimensions option (also shown below). Substitution Variables can be used in the description.


Use ‘Type’ to apply a sign reversal.
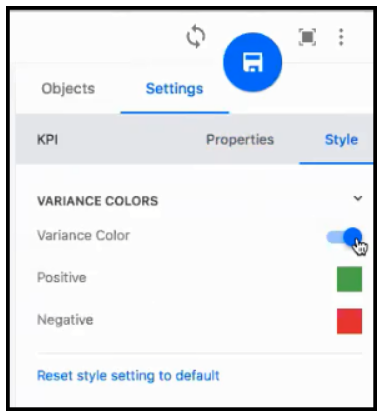
Another option is to display variance in a specific color. To do so, select the KPI chart, click the Settings tab and the Style tab. Slide Variance Color to ON. Select custom positive and negative colors to display.
At any time you can return to the default color scheme provided by Host Analytics by clicking Reset style setting to default.
Global Search and Bookmark Enabled for Dashboards
You can now use global search to search Dashboards. You can bookmark Dashboards as well.
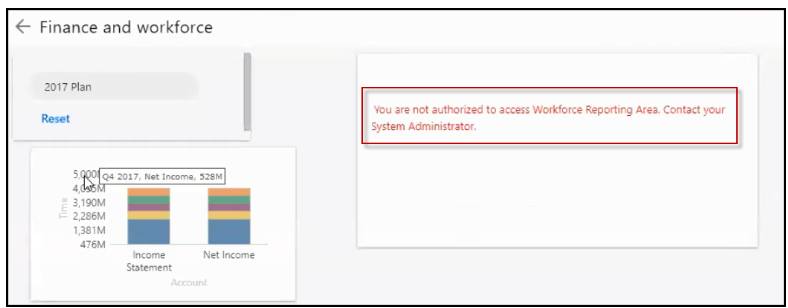
Workforce Reporting Security for Dashboards - Available on an Opt-In Basis
To ensure data is secure, users must be explicitly provided with access to Workforce Reporting to view the data in Dashboards. If access is not provided, the error message below will be displayed.
To provide users with access to Workforce Reporting, complete the following steps.
Step 1: Navigate to Maintenance > Admin > User Management.
Step 2: Select a user.
Step 3: Click More.
Step 4: Select Workforce Reporting Security.
Step 5: Select a user or user group in the Unmapped Users/User Groups pane.
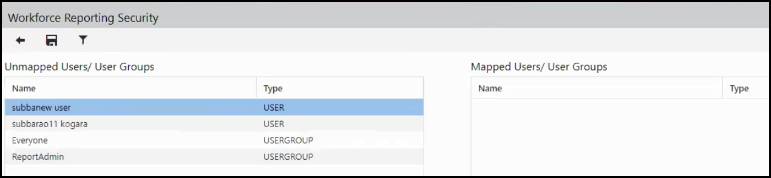
Step 6: Click the forward arrow. The user/user group will appear in the Mapped Users/User Groups pane.
Step 7: Click Save.
Note:
When you add charts from Workforce Reporting Area, non-numeric measures like Start Date, Review Date, Work State, Pay Plan etc. are not supported on the charts, however they can be used in Tables as columns.
Reports
Planning Template Notes Available in Dynamic Reports
Report Sets Number Scale Update
Toolbar Grouping Changes to Dynamic Reports
Access Templates Notes from Dynamic Reports
Display template notes for members in a Dynamic Report. The advantage of this feature is the ability to see notes recorded in a template within the Dynamic Report interface and output. For example, a user can make a note in a template that a department will gain a certain amount in funding or gain a headcount in the coming quarter. This information is important when reporting on the department budget. So, displaying notes like this provides pertinent information in reports without having to open the template in the Planning Control Panel.
Notes entered in the template are displayed in a Dynamic Report only after the template is opened and saved at least once from the Budget Control Panel. Or, if the Simulation Engine is run for the template.
Time and Reporting dimensions allow rollup members, however, all other dimensions have to be leaf members for notes to be rendered in a Dynamic Report. When you drill down on a rollup member, you will see the notes associated with the leaf members under the rollup member.
Notes posted in the following templates are shown in reports:
Global Template Single Copy
Global Template Entity Copy
Allocation Templates
Line Item Templates
Capital Templates
Template based HR
Notes posted in the following template types are NOT shown in reports
Initiatives
Block Templates
Detailed HR
To display notes in a Dynamic Report:
Step 1: Open the Dynamic Report.
Step 2: Click the More listbox.
Step 3: Select Show Notes. You can also select Hide Notes to hide them from display.
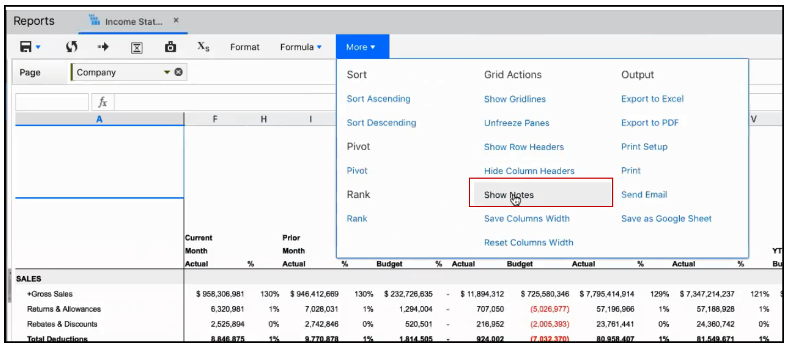
Once you click Show Notes, a Notes column is displayed on the report and notes are displayed for each line in the report. Notes are always vertically bottom aligned like the other cells in the report.
A date/time stamp with user name is added to the beginning of each note. The date/time stamp format is applied based on user location and language settings.
Guardrails:
The maximum number of characters displayed in the notes field is 1024, which includes that username and date/time stamp.
You can have up to 250 notes per report.
Notes are aggregated and displayed when coming from several sources. For example, notes sourced from multiple templates for the account and scenario combination. Consolidation happens for multiple scenarios, companies, departments, and so on for the page or column axis for leaf members in the hierarchy.
Notes are retained when running a Dynamic Report in a Report Collection or Financial Package Publisher. Notes are also retained when the Dynamic Report is sent in an email or exported and when you save a snapshot of a Dynamic Report.
Note:
Running a Dynamic Report with notes may impact performance.
Notes are not time bound. For example, if a scenario’s duration is Jan 17 to Jan 19, but the time selected in the report is Dec 16, notes are till displayed for these lines even though data does not exist on those scenarios for Dec 16.
If you suppress empty rows/columns, corresponding notes are also suppressed. Similarly, if the report line does not have any data, notes are also not displayed for those lines.
Note:
Notes are supported for Financial and Financial Snapshot Reporting Areas only.
Report Sets Number Scale Update
We’ve change the label name for Number Scale from Same to None as shown below. Selecting None applies no scale to the number format and is reflected in the Format Data pane as shown below.
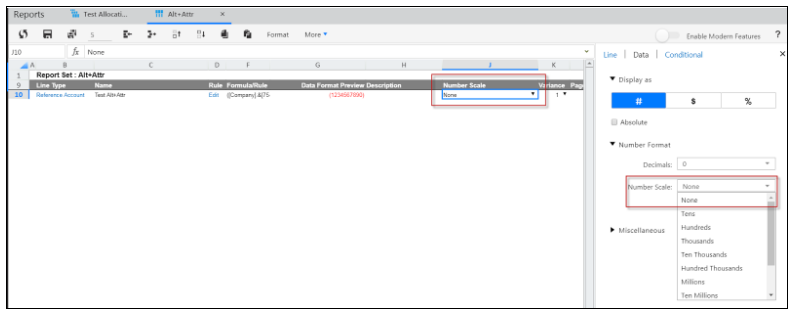
Steps to view / change number scale provided below:
Step 1: Open Reports.
Step 2: In the File Cabinet select a Report Set.
Step 3: Open the Report Set by clicking the link.
Step 4: Select a new number scale in the column.
Step 5: Click Format and select the Data tab. The number scale is reflected here.
Bookmarks
You can bookmark a Dynamic Report. This is beneficial to quickly access the report in the future. To do so, open the Dynamic Report from the File Cabinet, click the Bookmark icon, and select Bookmark this page as shown below.
If a Dynamic Report is deleted, the bookmark is not removed. The bookmark must be deleted independently of the Dynamic Report.
Update to Dynamic Reports
The first cell in the Dynamic Report grid is no longer selected by default when a Dynamic Report is run. The grid is now unselected by default. See Before and After screenshots below.
Before -
After -
Toolbar Grouping Changes to Dynamic Reports
Prior to this release some options available under the More list box in the Dynamic Report interface were grouped into an Other Actions category as shown below.
Now, these actions are grouped according to action as shown below.
Global Search
Global Search is now available for Dynamic Reports. Click the Global Search icon, enter the name of the report, and select from results.
Common
Hierarchy Management Usability Improvements
Updates to the DLR Calculation Exception Setup Page, Currency Calculation Exception, Currency Exception, and Global Fields Mass Load Functionality
We’ve changed some of the functionality around the Mass Upload feature that affects the DLR Calculation Exception Setup page, Currency Calculation Exception page, Currency Exception page, and Global Fields page, and added a new Output feature
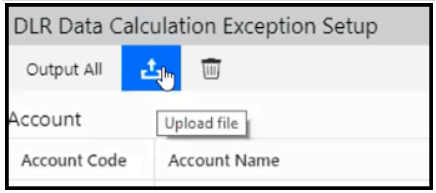
Upload Button Moved
The Upload file button has been moved to the top of the page as shown below on the DLR Data Calculation Exception Setup page.
Append and Override Logic
Append and Override options have been removed from the File Upload page as the logic is now built-in. The system checks to see if the file contents already exists. If the contents exists, the system performs an append. If the contents does not already exist in Host Analytics, an override is performed. This is also the case for Currency Calculation and Currency Exceptions Mass Load functionality released in Winter17.
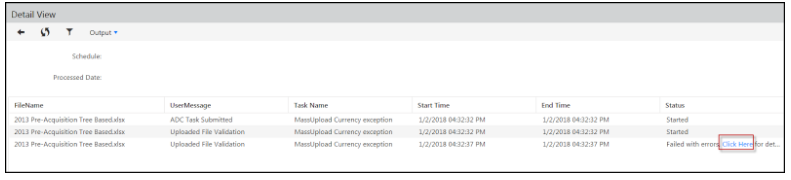
Mass Load Exceptions - Detail View Page & Excel Error File
On the Detail View page, you can see the status of the exception file upload. Now, detailed information is provided in Excel output for all exceptions that occurred during the mass load. Open the error file that contains exception data in a table format in Excel by clicking the Click Here link in the Status column as shown below.
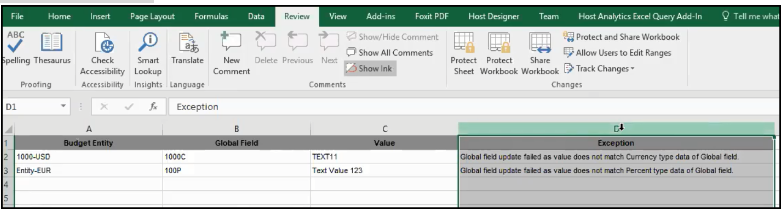
Example output with 2 exceptions is shown below. The purpose of viewing exceptions is to resolve them within the file (by entering a new value in this case) and upload the file again without exceptions.
Hierarchy Management Usability Improvements
Removed Search Results Limitation
Selecting Members From the Hierarchy Path
Locate Results Display
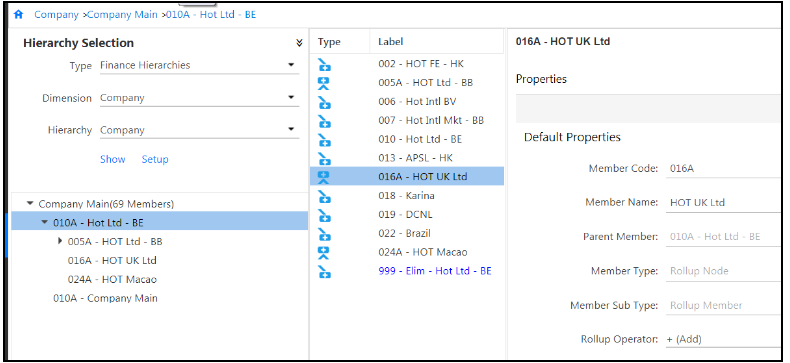
When you search a hierarchy for a member, you can use the new Locate button to display the location of a selected member within the hierarchy. The parent member displays in the hierarchy in the left pane, the member displays in the center pane, and the member’s properties display in the right pane.
In Practice
Step 1: Access Hierarchy Management by navigating to Maintenance > Hierarchy > Hierarchy Management.
Step 2: Perform a search. In this case, ot is entered in the Search field. Results are displayed.
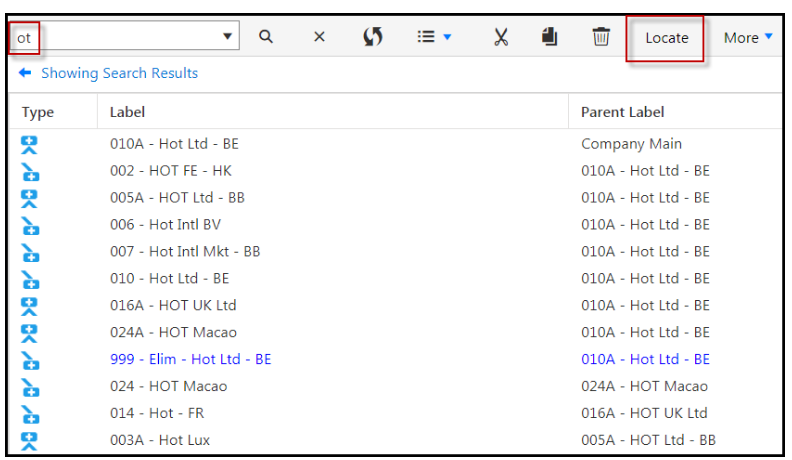
Step 3: Select a member. In this case 010A-Hot Ltd-BE is selected.
Step 4: Click the Locate button. Results display with the parent member highlighted in blue in the left pane, the member highlighted in blue in the center pane, and properties are displayed in the right pane as shown below. Also, the Search field remains populated with the data entered when the search was performed.
Removed Search Results Limitation
Prior to this release, when you searched for a member in the Hierarchy Management screen (accessed by navigating to Maintenance > Hierarchy > Hierarchy Management), only 100 results were displayed. If over 100 results were returned, a More button was available to view additional results. We’ve removed the More button along with this limitation. Now, all results are now displayed even if over 100. Use the scroll bar to scroll through results.
Selecting Members From the Hierarchy Path
The hierarchy path is displayed in the Hierarchy Management screen (accessed by navigating to Maintenance > Hierarchy > Hierarchy Management) based on where you navigate within a hierarchy. In the example below, the following hierarchy path is displayed:
Company > Company Main > 010A - Hot Ltd - BE > 016A - HOT UK Ltd
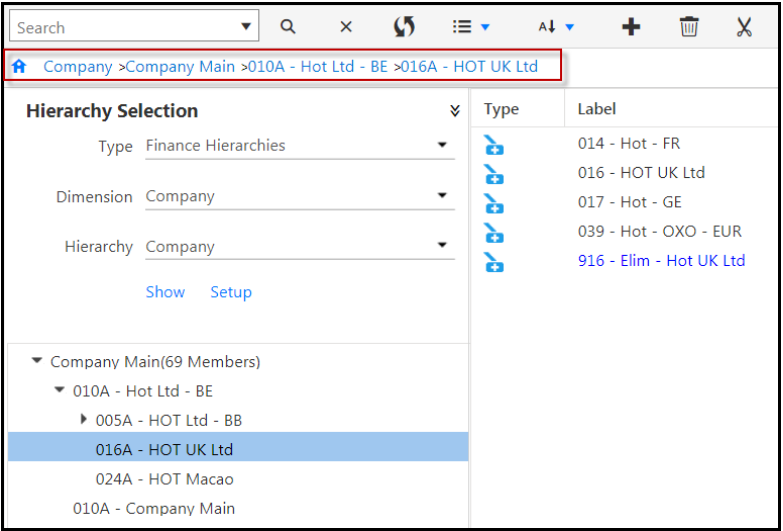
With this release, when you click a member in the path. When you do so, the parent member will be displayed in the left pain and the member itself will be displayed in the center pane. For example, using the scenario above, if 010A-Hot Ltd-BE is clicked, the parent member of 010A-Hot Ltd-BE displays in the left pane.
Desktop Notifications
Desktop notifications provide important information such as; when your Host Analytics session is about to expire and when a process run in the cloud is complete. With desktop notifications, you will receive the notification no matter what Host Analytics application page or window you’re working in.
When you login to Host Analytics, you’ll be prompted to enable desktop notifications. Once enabled, you can disable desktop notifications. Steps for the Chrome browser are provided below, but you can enable or disable desktop notifications for any browser.
Steps to disable/enable desktop notifications in Chrome:
Step 1: On your computer, launch Chrome.
Step 2: Click More (3 vertical dots) from the upper-right hand corner.
Step 3: Click Settings.
Step 4: Search in the Settings window for Content Settings or open the Advanced pane to view Content Settings.
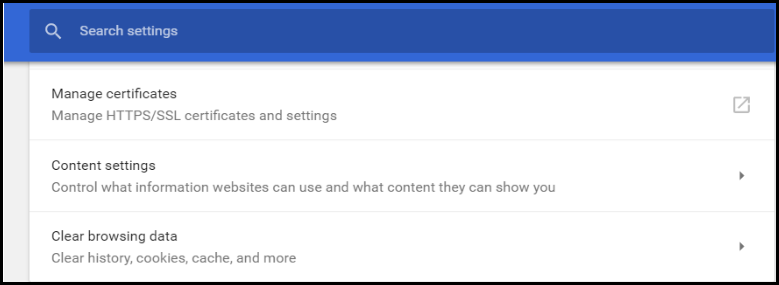
Step 5: Click to open Content Settings. Click Notifications.
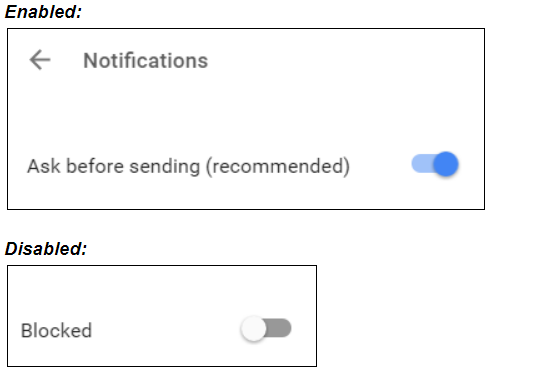
Step 6: Turn on/enable Ask before sending desktop notifications or turn off / disable desktop notifications.
Modeling 2.4
Starting with this release, users should go to the Host Analytics Community portal for Release Notifications.
Additionally, users should download the SpotlightXL Add-In from the online help under SpotlightXL Installation, Where to Download and Version Information.
Changes to User Management with New User Types:
Improvements to Breakback:
Improvements to the Web-Based Model Manager:
Ability to View or Change the Value of a Variable in a Calculation from Model Manager (Web UI)
Ability to Create, View, and Edit Maps from Model Manager (Web UI)
Expanded Use of Variables and Expressions:
Enabled Secondary Double-Click in Views
Changes to User Management
New User Types Added: Business and External
In this release, we are introducing User Types. User Types will define which users are internal to your business and which are external. Internal users are called Business. External users are called External.
The Business user type is for all users within your organization that use Modeling.
The External user type is for users outside of your organization who need to access your application for diagnostics, development, or debugging work, such as Host Analytics Support or Partner Consultants.
| Business User Type | External User Type |
|---|---|
Internal to your organization | External to your organization |
Access only to your organization's tenant or tenant group | Access to yours and other organizations' tenants |
Count toward your organization's license count | Do not count toward your organization's license count |
Admin Business user can make changes only to other Business user accounts | External users are typically going to be Admins and can make changes to any user account |
When you first run Release 2.4, you will notice that all existing user accounts have been assigned to a User Type. All users within your organization, including your admin, should be Business. All partners, consultants, and Host Analytics employees should be External. If you see any users with an incorrect user type, please contact Host Analytics Support.
To review your organization's user accounts:
Select Manage, User Management.
To see how many accounts are in use, go to Manage, Application Administration, Application Statistics. See Clarification on License Usage in Application Statistics for more information.
Specifying the User Type when Adding a User
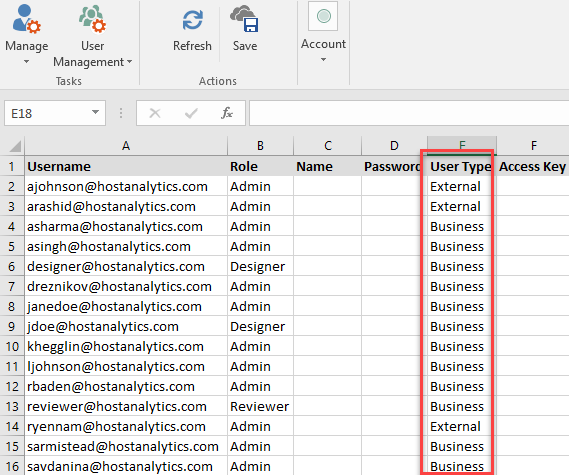
When adding a user in the application, you must now select the User Type.
- Select the Manage task and the User Management subtask.
- In the Username cell enter the user's login ID.
- In the Role cell, select Admin, Designer or Reviewer. For information on each of these roles, see User Roles.
- Enter a temporary password for a new user in the Password field.
- Select a User Type: Business or External. For information on these types, see User Types.
- Click Save.
Important:
If you are a Business user, you can add only new Business users. You cannot add a new External user. Only External users can create new External users. However, if you are a Business user, you can add an External user to your application if the External user name already exists.
As a Best Practice, Business users should manage only Business users. For any changes related to External users, contact Host Analytics Support.
Example: External Partner A has worked with Business Customer P before, and External Partner A has an External username. When Business Customer X starts working with External Partner A, they can add External Partner A to their application because External Partner A already has a username (usernames are global). Business Customer X cannot add a new External Partner B, though, if that is a new username to the Host Analytics system.
Business Admins can change the password of a Business user but not an External user. If an External user wants to change their password, they should contact Host Analytics Support.
Changes to the Columns in User Management
The User Management page in Modeling has been changed. Only admins have access to the User Management page. Select Manage, User Management.
Two columns have been removed: Status and Release Notifications. For release notifications, users should go to the Host Analytics Community portal for information.
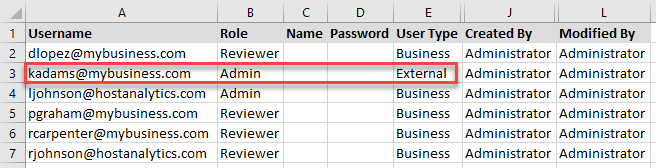
The User Management page contains Created By and Modified By columns. User names are global across all Host Analytics tenants, and External user names will be shown as "Administrator" in the Created By and Modified By columns.
Clarification on License Usage in Application Statistics
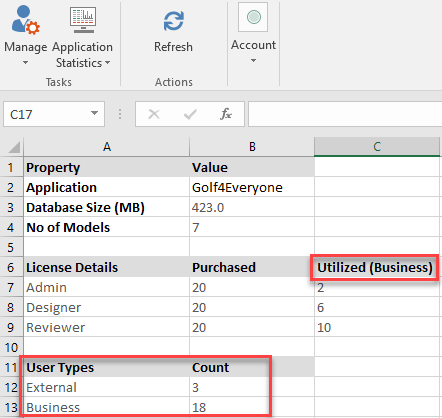
The Application Statistics page now shows license usage based on user types. Your license count is the number of allowed Business users. External users do not count toward the license count. To view this page, select Manage, Application Administration, Application Statistics. Only admins can access the Manage menu.
In the example below, the application Golf4Everyone allows for 20 users. 18 have been utilized so far: 2 admins, 6 designers, and 10 reviewers (end users). A new section below the license details shows that 18 Business users and 3 External users exist. The External users do not count toward Golf4Everyone's total licenses.
Enhancements to the Load Users or User Groups API to Support the New User Type
These APIs return the names of users or user groups for a tenant, add users and user group mappings, and delete users. A new option has been added for the User Type.
User Types will define which users are internal to your business and which are external.
The Business user type is for all users within your organization that use Modeling, and have access only to your organization's tenant or tenant group.
The External user type is for users outside of your organization who need to access your application for diagnostics, development, or debugging work, such as Host Analytics Support or Partner Consultants. External users have access to yours and other organizations' tenants.
Another new option has been added called supportRole. This field has no effect in this release. It will be used in a future release.
Changes are noted in red below.
Request Headers
Content-Type : application/json
Accept: application/json
X-ACCESS-TOKEN: <Token>
API Endpoints
GET: /api/ui/user/getRaw
Returns a List of User Objects for that Tenant.
Sample Response in JSON
[
{
"email": "testuser1@test.com",
"name": "",
"status": "Unverified",
"groups": [
{
"name": "Group1"
}
],
"role": "Admin",
"invalidPasswordAttempts": 0,
"lockedStatus": "UnLocked",
"emailSubscription": "Subscribe",
"userType": "External",
"supportRole": "Administrator"
},
{
"email": "testuser2@test.com",
"name": "",
"status": "Unverified",
"groups": [
{
"name": "Group1"
},
{
"name": "Group2"
}
],
"role": "Reviewer",
"invalidPasswordAttempts": 0,
"lockedStatus": "UnLocked",
"emailSubscription": "Subscribe",
"userType": "Business",
"supportRole": "Administrator"
}
]
POST: /api/ui/user/saveUsersRaw
Returns: nothing or error message.
This API creates users and groups.
Groups sent must be the final mapping because the previous mapping will be erased. If no groups are sent, the user will not be able to login to the tenant.
Unmapped groups will not be deleted.
Inactive users should be deleted before adding new users to avoid license limitations.
Required Fields (email, name, groups, role, password, userType):
Email: Must be a valid email format. Cannot be empty.
Name: Can be empty.
Groups: List of Group Objects {“name”:”group”}. Can be an empty list.
Role: "Admin", "Designer", or "Reviewer". Cannot be empty.
Password: Must contain at least 1 uppercase, 1 lowercase, 1 number, and 1 special character. Minimum length 8 characters. Cannot be empty. Passwords will be set only for new users on the environment (users are global). If the user is already present on environment but not on the tenant, the password will not be reset/overridden.
userType: "External", "Business". Cannot be empty. User Types will define which users are internal to your business and which are external. The Business user type is for all users within your organization that use Modeling, and have access only to your organization's tenant or tenant group. The External user type is for users outside of your organization who need to access your application for diagnostics, development, or debugging work, such as Host Analytics Support or Partner Consultants. External users have access to yours and other organizations' tenants.
Note
Only External users can create new External users. If you are using the API to add a new External user, the person running the API must be logged in as an External user. However, if you are a Business user, you can add an External user to your application if the External user name already exists. For example, External Partner A has worked with Business Customer P before, and External Partner A has an External username. When Business Customer X starts working with External Partner A, they can add External Partner A to their application because External Partner A already has a username (usernames are global). Business Customer X cannot add a new External Partner B, though, if that is a new username to the Host Analytics system.
Sample Payload
[
{
"email": "testuser1@test.com",
"name": "",
"status": "Unverified",
"groups": [
{
"name": "Group1"
}
],
"role": "Admin",
"password":"Test1234!"
"userType":"External"
},
{
"email": "testuser2@test.com",
"name": "",
"groups": [
{
"name": "Group1"
},
{
"name": "Group2"
}
],
"role": "Reviewer",
"password":"Test1234!"
"userType": "Business"
}
]
For additional information, see Load Users or User Groups API.
Ability to Run Breakback from a Calculation
Breakback was introduced in Release 2.1.1 as a method to update data with a top-down allocation. Until now, all the functionality took place within views and reports. In this release, you can now run Breakback operations from a Calculation, thus automating your top-down allocations and making them easier to maintain.
Use SpotlightXL to define Breakback operations in a calculation. Once defined, you can run the calculation from SpotlightXL or Spotlight.
Calculation Breakback Basics
Breakback requires several pieces of information:
Model name
Parent-level data intersection from which to allocate data to children
Spread method
Type of change to make: amount or percentage increase/decrease
Value of the change to make
Data intersection to use as a reference for the Breakback (optional)
Hold members (optional, child members that will be skipped in the Breakback)
You can provide the required information using a new Breakback button on the Calculation ribbon.
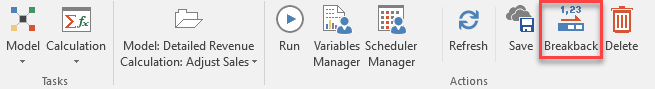
This button functions similarly to the Breakback button in Views and Reports. The main difference is that you must also specify the parent-level data intersection; in views and reports, this is the data cell that your cursor is on before you select Breakback.
Calculation Breakback, Value Input Example
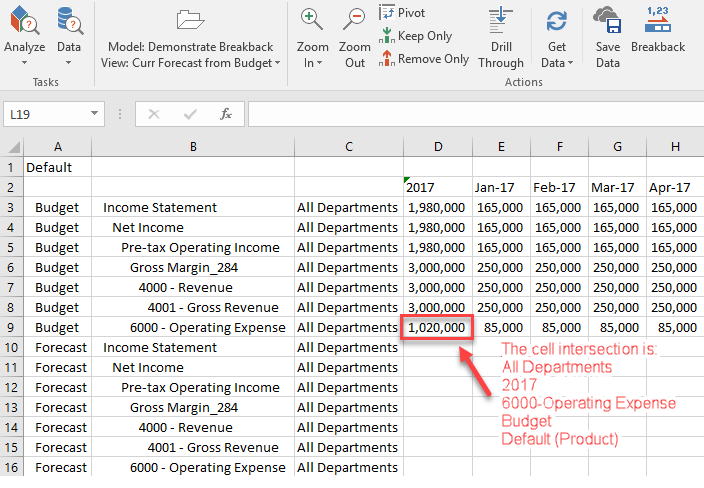
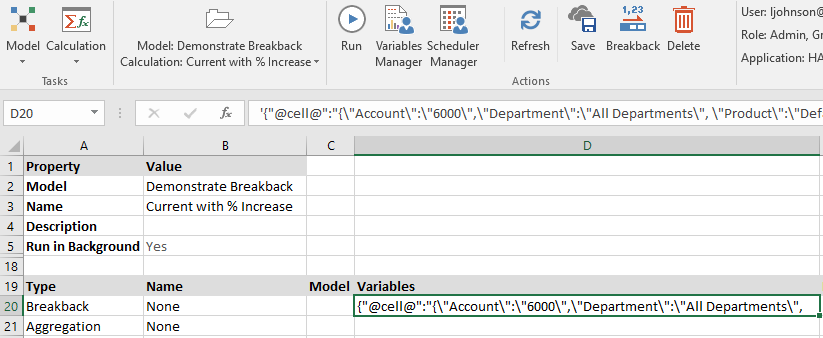
This example uses similar choices as are demonstrated in the help topic for Breakback from a view or report. See Using Breakback based on Current Data with % Change (Increase or Decrease). For 2017 Budget, we want to increase the Expense (account 6000) amounts by 3%. Here is the view before the calculation is run, with the Breakback Cell highlighted.
To add Breakback to a calculation:
Select Model, Calculation.
Select a model from the Model drop-down.
Give the Calculation a name.
Click Save.
Under Type, select Breakback.
Under Name, type None.
Click Save. Notice that the Variables section is now populated with several variables.
Select the cell with all the Variables.
Click the Breakback button on the ribbon.
Select the model from the Model drop-down. By default, the model specified in the calculation is selected.
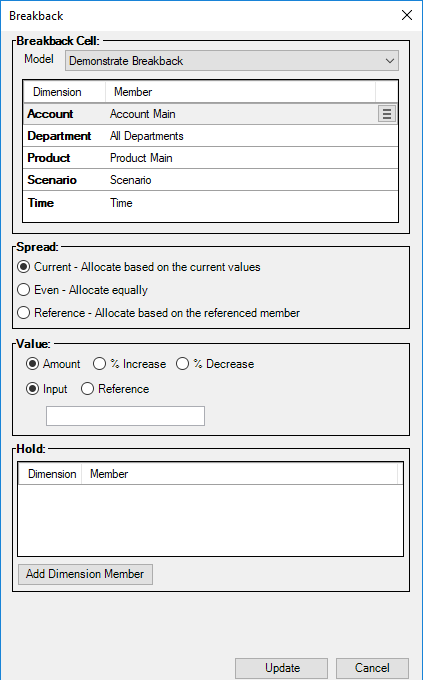
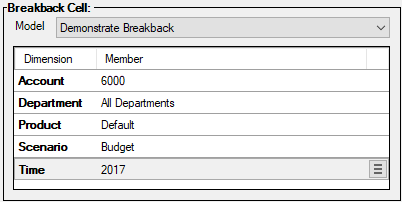
In the Breakback Cell area, specify the parent-level data intersection. This is the highest level parent that you will base the allocation from. The allocation will go to the leaf-level children.
In the Spread area, select Current. For information on spread types, see Breakback Types.
In the Value area, select % Increase.
Select Input because we will manually input the % increase that we want by typing 3 in the % box.
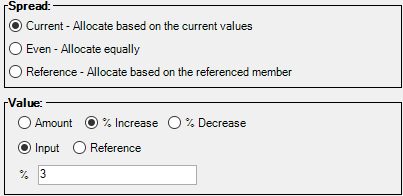
Skip the Hold area.
Click Update.
Now you are returned to the calculation where you can add more commands.
In the second row of the calculation, select Aggregation from the Type column.
Under Name, type None.
Click Save.
Note:
If you want additional Breakbacks that are similar to the one you have already added, you can copy the Breakback row to a new row in Excel. Then when you put your cursor on the row under the Variables column and select Breakback from the ribbon, it is pre-populated with the last Breakback, and you can make changes.
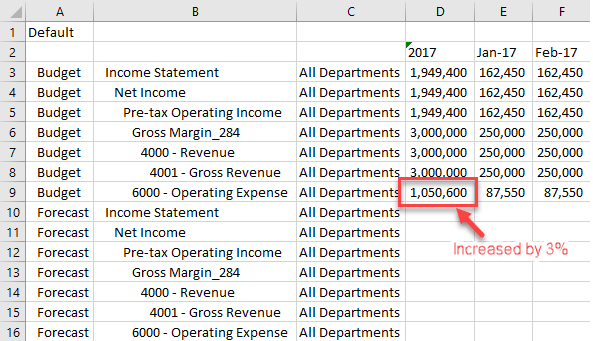
Your calculation is ready to run.
After running the calculation and refreshing the View, here is the resulting data.
Calculation Breakback, Value Reference Example
You can set up Breakback to refer to a data intersection in your model as the basis for the allocation. For example, if you do not know the exact value of the % Increase or the Value Input, or if you want the % Increase or Value to be variable, you can specify a data cell from the model to reference for the value.
Here is the process to use a cell in the model as the Value for the allocation:
Use a report to set up a form for a user to enter the amount to use or the amount to increase or decrease.
Use the cell intersection coordinates from the report as the reference for the Breakback in the calculation.
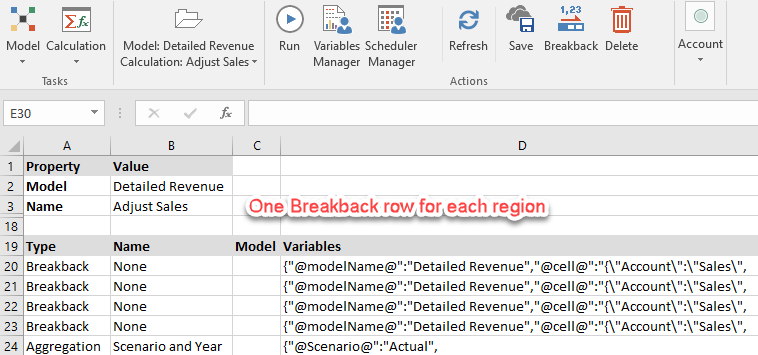
Use one Breakback row in the calculation for each amount entered by the user.
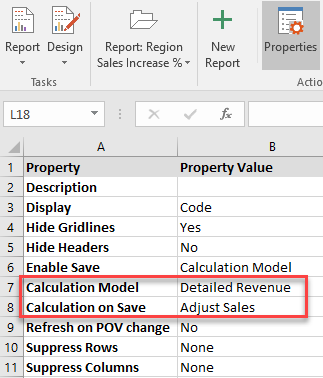
Add the name of the calculation to the report Calculation on Save so that each time the user saves, the Breakbacks are calculated.
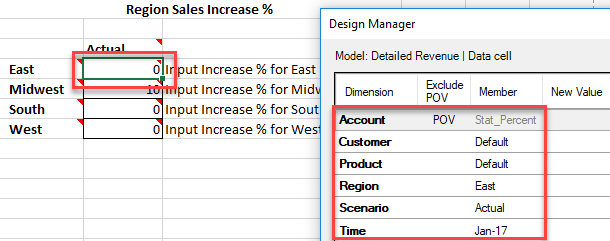
The following example uses a report Sales Increase % to let users input values for regional sales increases. The values inputted by the user are used in the Breakback calculation to increase Sales values in the model. The report automatically runs the calculation when the user saves their input values.
Use a report to set up a form for a user to enter regional sales increases.
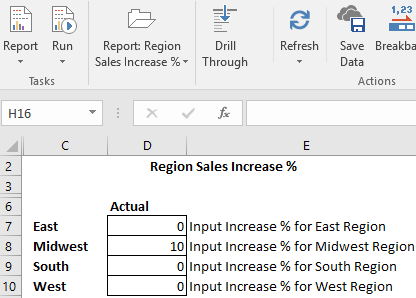
Note the data intersection from the report using Design Manager.
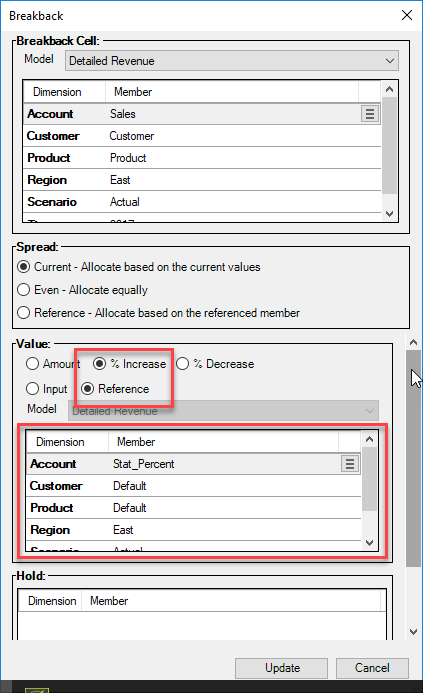
In the calculation, add a Breakback row, and use the cell intersection coordinates from the report as the reference for the % Increase.
Use one Breakback row in the calculation for each amount entered by the user.
Note the name of the calculation.
Add the name of the calculation to the report Calculation on Save so that each time the user saves, the Breakbacks are calculated.
Ability to View or Change the Value of a Variable in a Calculation from Model Manager (Web UI)
The Model Manager has been enhanced to provide the ability to view and set variables in calculations using the Variable Manager. This functionality was previously only available in SpotlightXL.
You can view the current value for the variable and optionally specify a new value. This is useful for organizations that want to set up a calculation and run it regularly, using a variable to specify what is different each time you run it. For example, the calculation may run an aggregation for a department, or for just a particular year, where the department and year are variables.
Consider the following example:
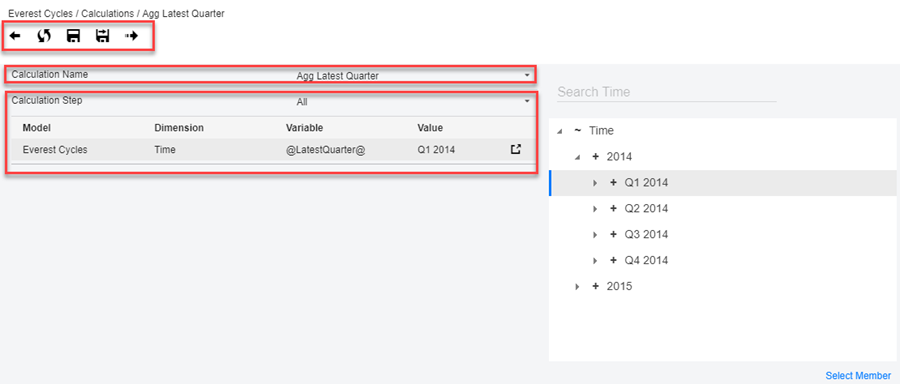
Everest Cycles is a model that contains financial data for an international company that sells bicycles.
The model needs to be aggregated quarterly.
Using SpotlightXL, you create a Scope for the model that defines a variable called @LatestQuarter@, based on the Time dimension.
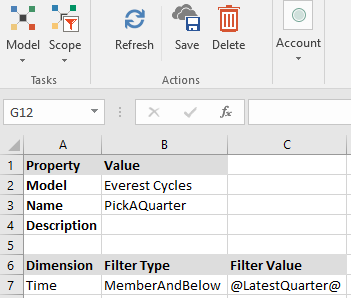
You create a Calculation that runs an aggregation for the scope of time specified in the variable @LatestQuarter@. The initial value of the variable is Q1 2014.
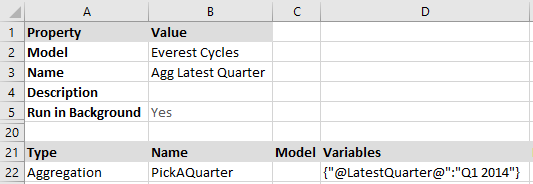
Now, in Model Manager, the variable used in the calculation "Agg Latest Quarter" can be modified at runtime so that the calculation aggregates whichever quarter the user choose.
Login to Spotlight.
Select Model from the task menu.
Select the Calculations artifact from the Model box and pick one from the list to open the Model Artifacts Browser.
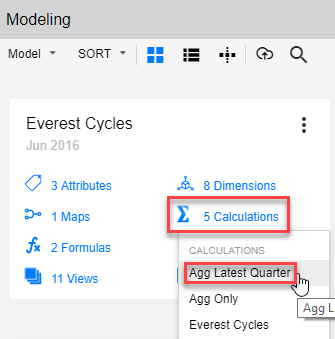
The Model Artifacts Browser lists the calculations. Included is a new icon, which opens the Variable Manager.
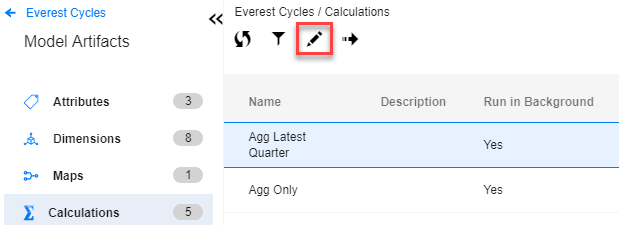
Click the Variable Manager icon to open the Variable Manager screen.
The icons along the top are:
Return to Model Artifacts.
Refresh to the last saved version.
Save changes to the calculation.
Save changes to the calculation and Run it.
Run the calculation.
The Calculation Name is provided along with a drop-down if you would like to switch to viewing a different calculation.
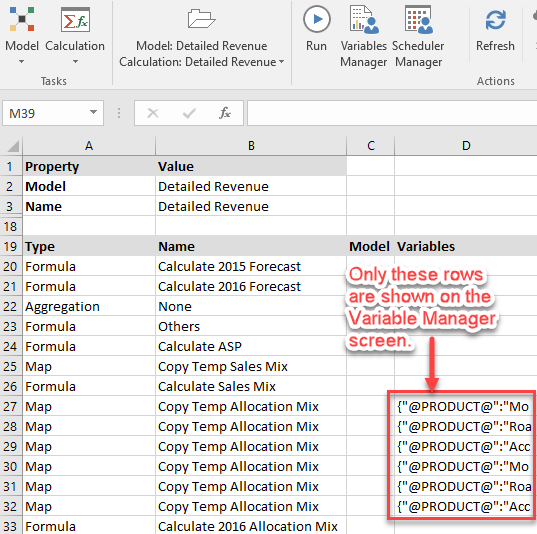
A Calculation Step is provided so that you can step through complex calculations with multiple variables that need to be set. The current step and its variable(s) are listed. For information on how calculation steps correspond to the rows in a calculation, see Calculation Steps in Model Manager.
Click the open box icon to select a new value for the variable.
In the dimension browser pane on the right, search or click through to find the quarter that you want to calculate.
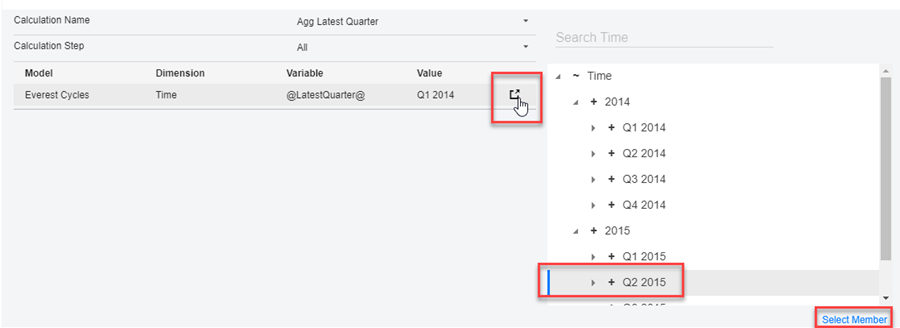
Click Select Member. The selected member then appears under the Value column.
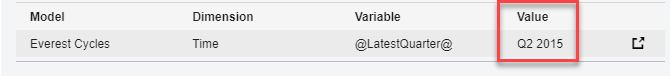
Click Save or Save and Run. A message appears to confirm your selection.
Click to Return to Model Artifacts when done.
Calculation Steps in Model Manager
In Model Manager, you can set the value of variables used in calculations.
Select the calculation and click the Variables Manager icon to open the Variable Manager screen.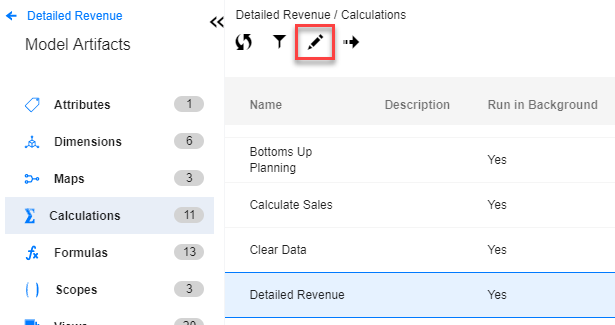
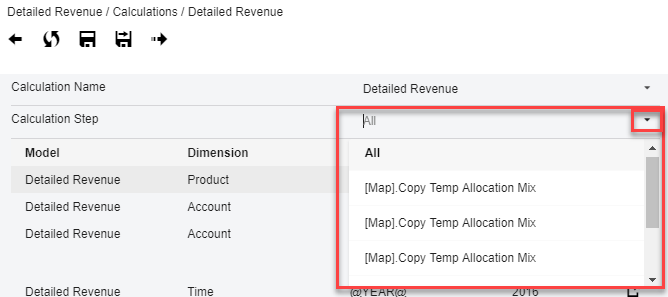
Under Calculation Step, you see the list of All variables used in the calculation. These steps correspond to rows in the calculation in SpotlightXL that include variables. By default, you see All variables that are used in all steps of the calculation. You can set them all at once, or set them step by step.
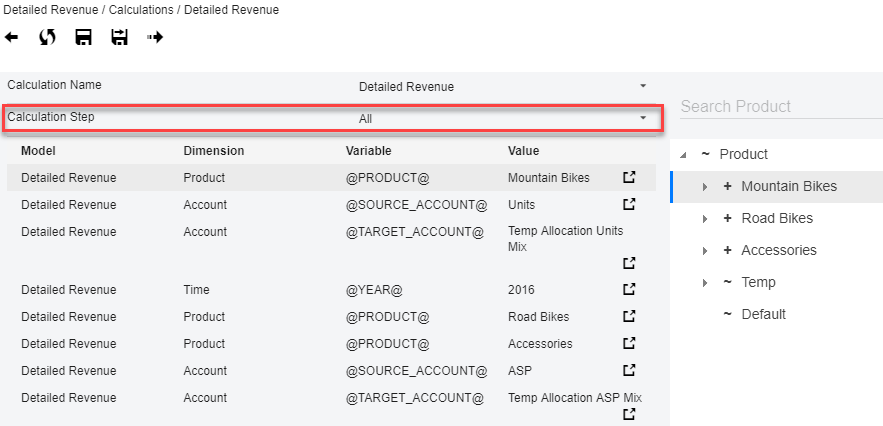
Note:
The Variable Manager screen does not show you all the rows in the calculation, only those that include variables. For example, the full calculation for the Detailed Revenue calculation above includes several rows that do not use variables. Only the 6 rows that include variables are included in the Variable Manager.
You can use the drop-down to select different steps in the calculation and set variable values for each. Or you can select All and set all variable values at once.
To make changes to the variables:
Select a step in the calculation.
Select a variable.
Select the dimension member you want to use in place of the variable.
Click Select Member.

Continue by changing variables in as many steps as you want.
Click Save or Save and Run when done.
To assign a substitution variable to a variable:
You can also use a substitution variable to change the value for a variable instead of using Variable Manager. You can assign the substitution variable to the variable once in the calculation, and then you only need to change the value of the substitution variable going forward.
Select a step in the calculation.
Select a variable.
Select the substitution variable you want to use in place of the variable. (The substitution variable must be predefined.)
Click Select Member.
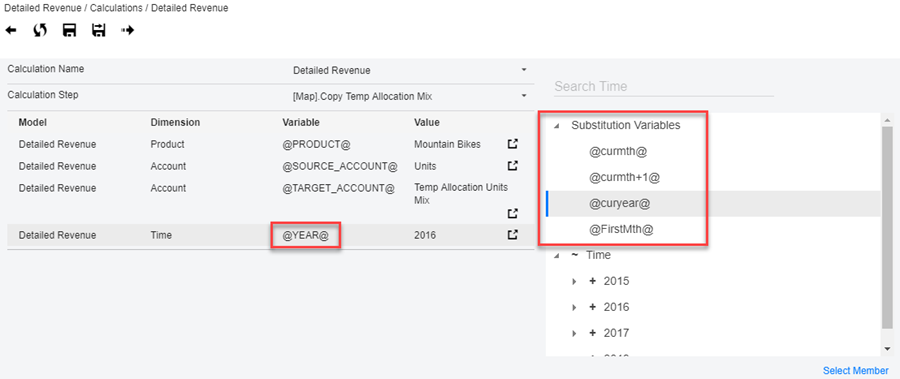
Click Save or Save and Run when done.
Ability to Create, View, and Edit Maps from Model Manager (Web UI)
The Model Manager has been enhanced to provide the ability to create, view, and edit Maps. The Map Manager also includes helpful Member Selection boxes so you do not have to remember or re-key member names.
Model Maps provide the ability to move metadata and data from one place to another:
To transfer data from Host Analytics Planning, Consolidation, or Reporting applications to a SpotlightXL model
To transfer data from one SpotlightXL model to another
To transfer data within a model
To transfer data from a SpotlightXL model to Host Analytics Planning, Consolidation, or Reporting applications
Viewing an Existing Map
Login to Spotlight.
Select the Model task.
Select the Model Relationship layout.
Scroll to find the model and map you want to view.
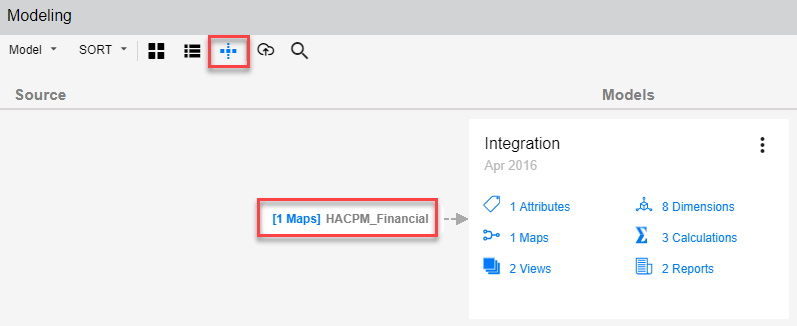
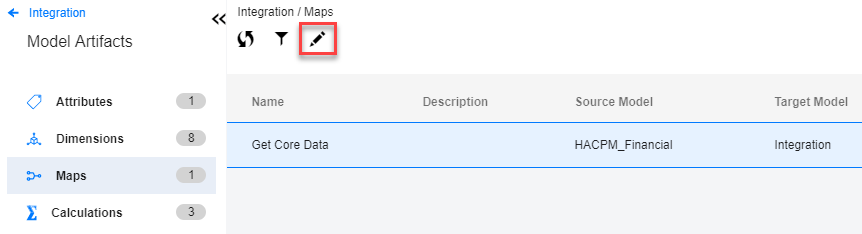
Select Maps, then pick a map from the list, to open the Artifacts Browser.
Click the pencil icon to open the map.
Editing an Existing Map
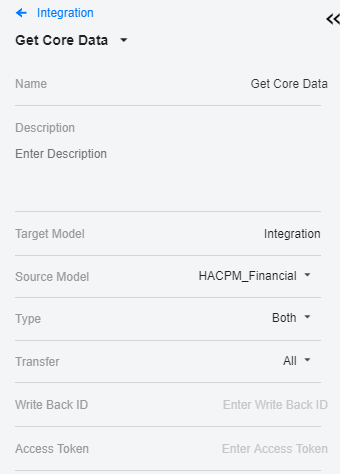
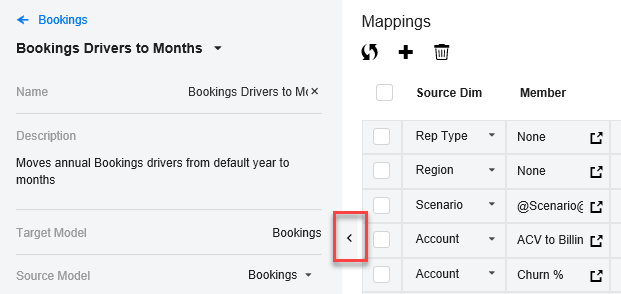
Open the map using the pencil icon. The Mappings screen appears.
The left pane of the screen displays the following basic information about the map:
Map name
Map description
Target model
Source model
Map type (Data, Metadata, or Both)
Transfer type (All data, or Leaf data)
Write Back ID (used only when data is flowing back to the original data source)
Access Token (used only when automating data integration with APIs)
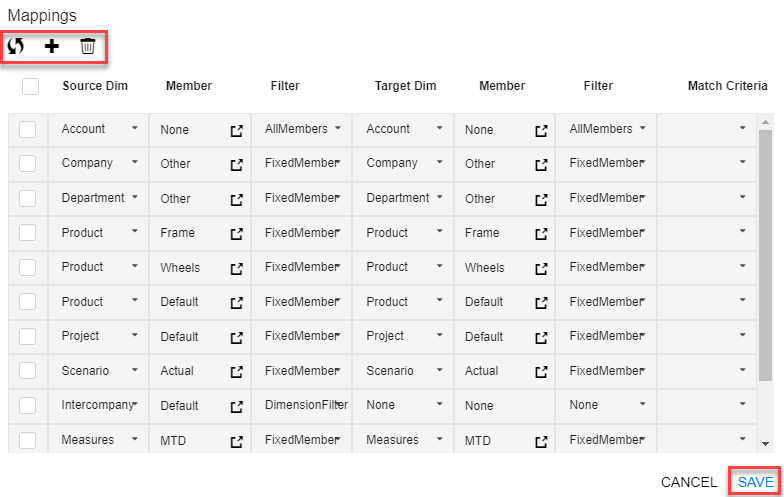
The right pane of the screen displays the mapping details (along with their equivalents in SpotlightXL):
Source Dimension
Member (Source Value)
Filter (Source Filter)
Target Dimension
Member (Target Value)
Filter (Target Filter)
Match Criteria
Use the drop-down arrows to select different options.
Use the open icon to view the Member Selection box.
To delete a row, click the checkbox next to the row and click the trashcan icon.
To discard your changes, click the Refresh icon.
To add a new row, click the + icon.
When done with your changes, click Save.
Note:
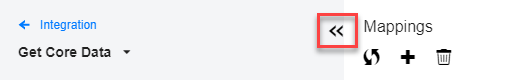
You can expand the Mappings pane by clicking the left arrow between the two panes. It looks slightly different depending on your browser.

For details about using maps to load data from Host Analytics Planning, Consolidation, or Reporting applications, see Setting up the Target/Master Model using a Map.
Creating a New Map
Open the Model Manager layout screen of your choice.
Click the More menu, then select Add, then Map.
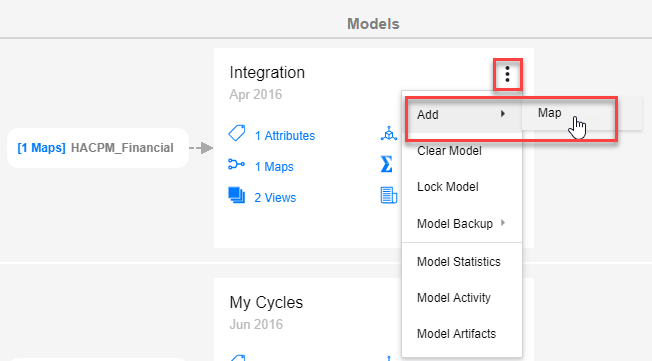

The Mappings screen appears.
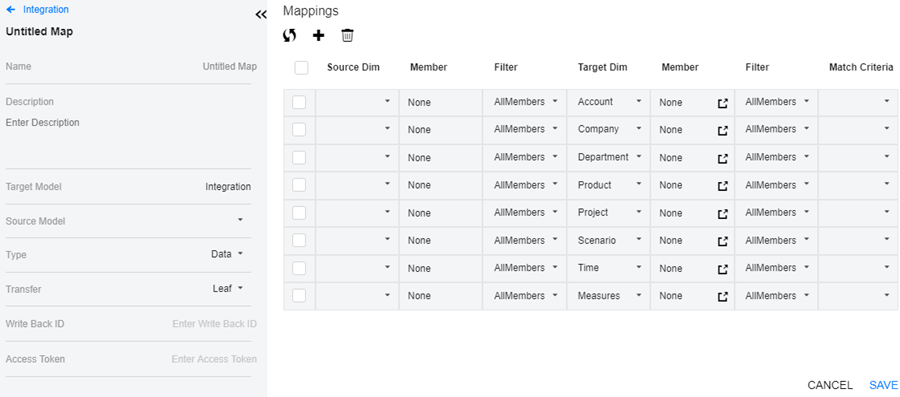
The left pane of the screen lets you specify the following basic information about the map:
Map name (required)
Map description
Target model, populated with the name of the model you started from in the Model Manager layout (required)
Source model, select the drop-down to pick the model you are copying from (required)
Map type, default is Data (Data, Metadata, or Both) (required)
Transfer type, default is Leaf (All data, or Leaf data) (required)
Write Back ID (used only when data is flowing back to the original data source)
Access Token (used only when automating data integration with APIs)
The right pane of the screen is where you specify the mapping details:
Source Dimension
Member (Source Value)
Filter (Source Filter)
Target Dimension
Member (Target Value)
Filter (Target Filter)
Match Criteria
Use the drop-down arrows to select different options.
Use the open icon to view the Member Selection box.
To delete a row, click the checkbox next to the row and click the trashcan icon.
To discard your changes, click the Refresh icon.
To add a new row, click the + icon.
Note:
You can expand the Mappings pane by clicking the left arrow between the two panes. It looks slightly different depending on your browser.

When done with your changes, click Save.
For details about using maps to load data from Host Analytics Planning, Consolidation, or Reporting applications, see Setting up the Target/Master Model using a Map.
Ability to Use Variables and Variable Expressions in Maps, Formulas, and Scopes
In this release, you can now use both variables and variable expressions in Maps, Formulas, and Scopes. Expressions were introduced in release 2.1.2 for use in Reports and Excel-based Reporting. Now you can use them in Maps, Formulas, and Scopes also. You will need to type them in manually at this time; a user interface similar to the one provided in Reports will be added in the future.
To see details about how expressions work, their syntax, and how to chain them together, see Example Substitution Variable Expressions.
Variables and Expressions are supported in both SpotlightXL and Spotlight.
Variables and Expressions in a Map
Variable Example, Get One Fixed Month
The following example shows two variables used in a map. One is a variable on the source model (HACPM_Financial) and one is a variable on the target model (Drill-Thru).
Note:
In Maps, variables are allowed only in Maps of type Data.
In SpotlightXL, select Model, Map:
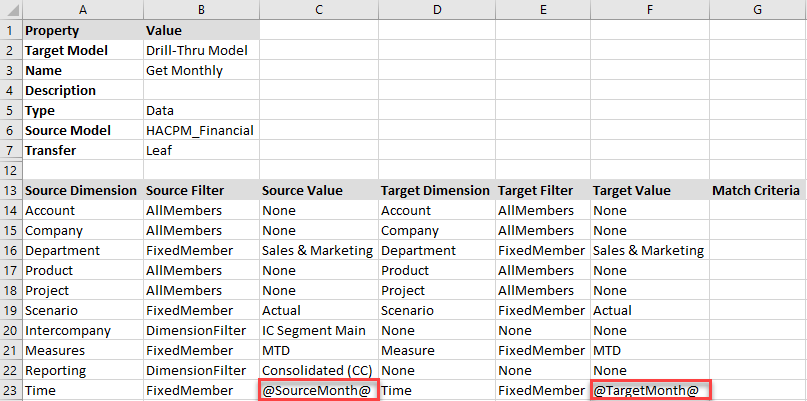 In Spotlight, select Model, select a Map, and click the pencil icon to open the Mappings screen:
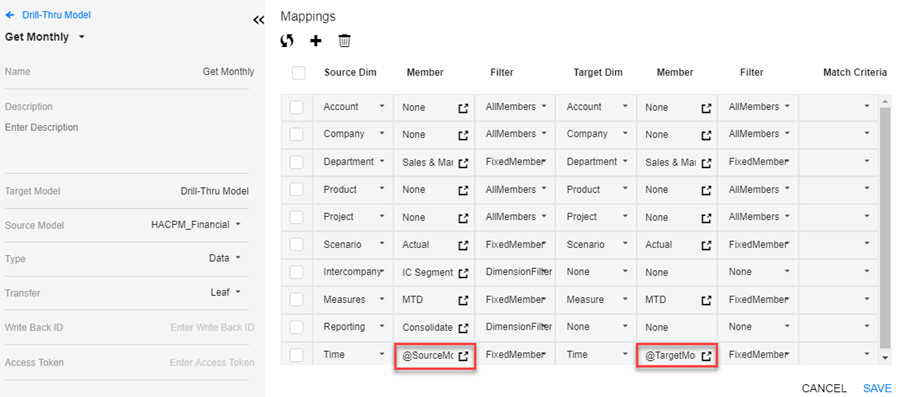
Expression Example, Get One Fixed Month and 12 Months Trailing
Many users already use variables in their maps, as described in the section above. You can now simplify the maintenance of the maps by using fewer variables and adding expressions. For example, if you want to get data for a particular month, and the 12 months trailing, use just one variable for the month and expressions for the preceding months.
@TargetMonth@
@TargetMonth@.Lag(1)
@TargetMonth@.Lag(2)
...
@TargetMonth@.Lag(12)
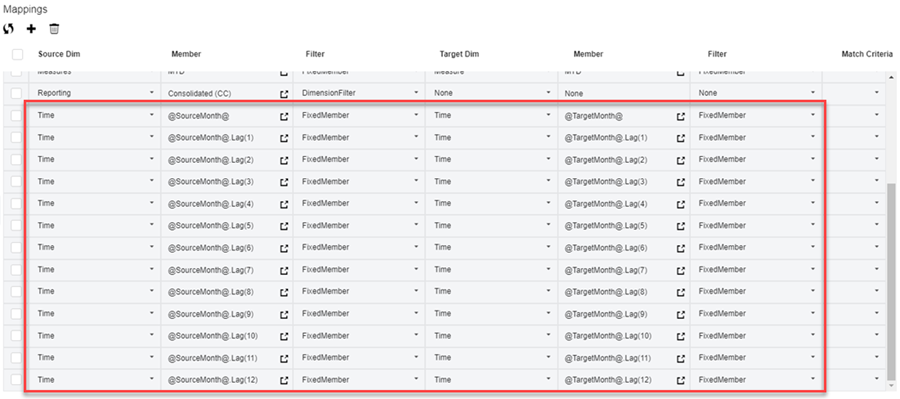
Here is the map shown in SpotlightXL: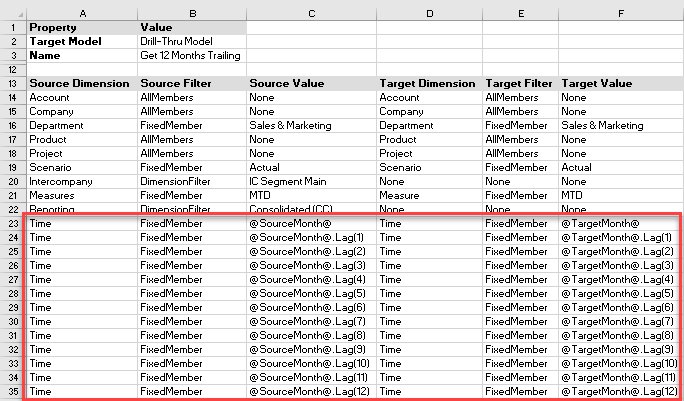
Here is the map shown in Spotlight Model Manager:
To see details about how expressions work, their syntax, and how to chain them together, see Example Substitution Variable Expressions.
Variables and Expressions in a Scope
The following example shows one variable and an expression used in a Scope. Editing a Scope is available only in SpotlightXL at this time.
In SpotlightXL, select Model, Scope:
Variables and Expressions in a Formula
The following example shows a variable used in a Formula. Editing a Formula is available only in SpotlightXL at this time.
In SpotlightXL, select Model, Formula:
Putting it Together in a Calculation
Expressions are not yet supported directly in calculations but you can use expressions in the Scope which is used by the calculation.
The following example shows a calculation that uses variables from a scope, formula, and a map.
The Map gets data from the source model based on the variables pointing to a particular month.
The Aggregation uses a Scope to calculate the total in the quarter parent of the particular month.
The Formula calculates the Budget Variance for the same year as the particular month.
Use the Variables Manager to set the values of the variables.
In SpotlightXL, select Model, Calculation:
In Spotlight, select Model, select a Calculation, and click the pencil icon to open the Variable Manager:
Audit Log Enhancements
The Audit Log has been enhanced to include additional entries:
Display which user locked or unlocked a user's password
Display which user added or deleted another user from an application
Only administrators have access to the Audit Log. Select Manage, Application Administration, Audit Log.
Enabled Secondary Double-Click in Views
When navigating in Views, you can now double-click your secondary mouse button to Zoom Out. For right-handed users, this is the right mouse button. For left-handed users, this is the left mouse button.
Known Issues
B-252 | Clear HACPM_Financial data returns the Setup screen to New Model. |
B-201 | Model Manager: Add Modified By field to Model Properties. |
B-196 | Model Manager: Provide better error checking in models with special characters in their names or artifacts. |
B-160 | Model Manager: When updating hierarchy in the dimension browser, the order of where I move the member is not preserved. |
B-148 | Model Manager: Group Access changes are not tracked in Model Activity. |
B-147 | Model Manager: List View Sort + Selection is performing some sort of double sort |
K-168 | Using special characters for the model name results in errors. |
K-115 | Implement support for UTC offset in fractional hours. |
3080 | In some cases, strange artifacts appear on screen in Excel while saving a large report with freeze pane. |
2971 | Breakback does not hold the cells on the report which are locked. |
2873 | Breakback on rollup value from negative to positive may yield weird or incorrect results. |
2611 | Cascade Reports will not work as expected if the user deletes a Dimension or an Attribute from the Model. |
2492 | If a report which is saved in an excel work book(offline) is renamed then users need to reload that report into the Excel workbook. Best practice is to refresh all reports in the saved workbook before renaming any report. |
2421 | Excel "Compatibility Mode" is Unsupported |
2354 | Snapshot email link will not work for users with SSO integration if they are not logged into the application. As a workaround they should log into the application and then access the Snapshot email link. |
2276 | If user makes any changes to the report (ex:- formatting, adding rows or columns, deleting rows or columns) after running it and then take a Snapshot then user will not see all the changes made to the report and in some cases the snapshot will look weird. We recommend users to take Snapshots without making any changes to changes to the report after its executed |
2113 | Integration between Planning & Modeling applications from web interface is best supported in Google Chrome browser. Users cannot navigate from Planning to Modeling if Internet Explorer compatibility mode is turned on. |
2080 | If users are using Firefox browser, right clicking an item in the Folder structure may display an incorrect menu. |
1845 | If POV member defined is removed or renamed, it cannot be fixed in report design mode and error is displayed. |
1464 | When suppress rows/columns is enabled, If Dimension Members and Data Intersection are available in same column/row in a report then dimension members will be suppressed along with data intersections. |
1457 | In some cases Suppress blank rows/columns is not working as expected when Groups are expanded in the report. |
1455 | Suppress blank rows/columns is not supported in Spotlight (i.e. Web Interface). |
1454 | In Some cases Suppress blank rows / columns is not working as expected if groups and freeze panes are enabled in the Report. |
1446 | Unable to navigate to Design View after rename or remove HostAnalyze worksheet. |
1406 | Excel 2016 charts containing 3D Clustered Column, 3D Stacked Column, or 3D Stacked Bar are not supported. |
1322 | Unable to cascade with substitution variables. |
1321 | Substitution variables are not working as expected in Cascade Report. |
1273 | Cascade Report has inconsistencies with Filters. |
1144 | Freeze Panes location should not be outside of the sheet viewable range. |
687 | Modified Report definition by removing months column still retain after Refresh. |
Excel-based Reporting issues:
3161 | Substitution variable override is not supported for worksheet with use of both display label and code settings |
2518 | Reviewer user has no access to Publish Excel-based reports. |
2302 | If there are any Snapshots in the workbook then Convert Entire Workbook option will not convert the workbook. |
2097 | When using Design Manager, Update button is enabled only after entering a valid New Value and hitting enter. |
1887 | It takes over 1 - 3 min to open 22 MB Excel workbook. |
1755 | Locking / Scaling is not applied when converting a Formatted Report to Excel-based Report. |
1699 | It may takes up to couple of hours to Capture Entire Workbook with 30 worksheets and ~7000 data cells or more cells |
1698 | Message shows 'Please contact administrator...' when select Refresh after session timeout. |
1672 | Provide an option to reset the Excel workbook so users can upload using a different Report Template. |
1624 | Unable to download the same report as it is being used by another process. |
1550 | Errors when Capture Data as SpotlightXL Formulas with a cascade report while in Design mode. |
Resolved Issues
C-32 | Support number formats other than US when saving data in Views and Reports |
C-33 | When the Windows Explorer has a Preview pane enabled, certain SpotlightXL windows and forms may render incorrectly. |
C-35 | Breakback percentage increase with value that contains a comma is cause an Excel error. |
C-37 | Data input when moving from cell to cell is very slow in a report. |
C-38 | In a report, we have now provided the option to reset the Substitution Variable values back to the default values. |
Was this article helpful?