- 46 Minutes to read
- Print
- DarkLight
- PDF
Winter19 Release Notes
- 46 Minutes to read
- Print
- DarkLight
- PDF
Thank you to all customers who contributed to the Host Customer Community. Most of these enhancements and features came from your requests. We hear you!
Summary of Enhancements
This section provides you with a quick overview of features and functionality delivered with this release that may affect the way you use the Host Analytics application. It is not a comprehensive list of all the new features delivered with this release; but rather those features that impact the way in which the application behaves.
Planning
- New View Mode Template functionality will be enabled by default for all new customer applications. For existing applications, this feature is available on an opt-in basis.
Consolidation
Renamed Label from Inactivate to Inactive.
Ability to run Eliminations as part of the Consolidation Process.
Modeling
Spotlight Web Reporting: multi-tab reporting and support for more chart types, styles, and positions in reports.
External Source Models: backup and restore, loading data via PCR data load rules, map support for DimensionFilter.
Spotlight for Office: support for Excel formulas and formatting in PowerPoint and Word via embedded workbooks.
Direct Access to PCR: Scenario dimension security for metadata, reporting cube defaults for system-defined dimensions are honored in new Views.
Common: Task Manager Hierarchy View
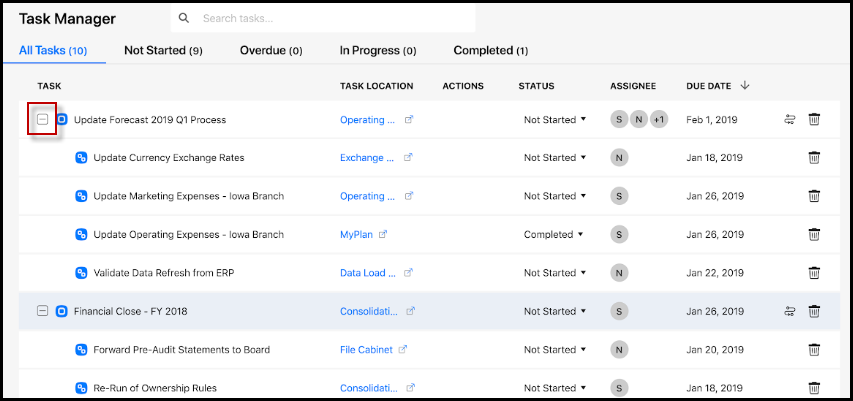
We continue to enhance Task Manager. For this release we have added the ability to view tasks and subtasks in a hierarchical structure.
In Practice:
Access Task Manager by clicking the icon.
Click Add Task.
Enter task details and save.
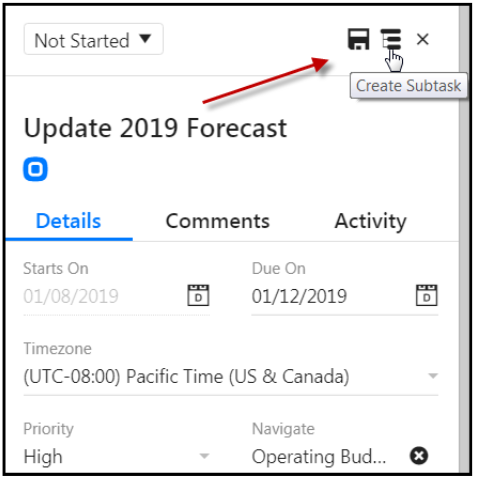
Open the task you added and click Create Subtask. Create as many subtasks as you like.
Now, expand the task to review the subtask in hierarchical format as shown below.
Common: New Bulletin Board
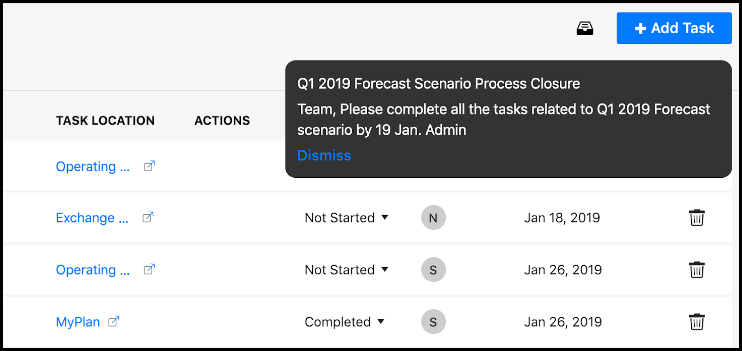
Bulletin Board is another cool feature we added to Task Manager. Admins can use the Bulletin Board feature (by creating an announcement) to quickly communicate and deliver organizational messages, task-oriented goals, reminders, and other vital information to end users. This information can only be seen (by users) in Task Manager.
In Practice:
Access Task Manager.
Click the new Bulletin Board icon.

Click Add to create a new announcement.
Enter the announcement subject/topic.
Select the timezone in which the announcement will show.
Select the dates the announcement will start and end.
Enter the announcement message.
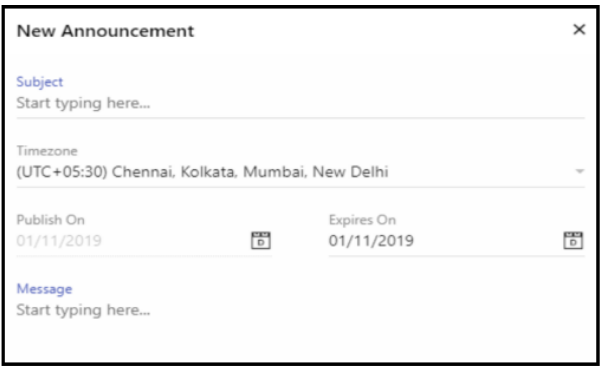
Click Publish. The announcement will appear in the Bulletin Board as shown below.
Common: Additional Flexibility for GL Data - Data Load Rule using NetSuite Connect
Prior to this release, when creating a Data Load Rule to load GL Data, you could map Fiscal Year and Fiscal Month columns in the Define Data Mapping step as shown in the image below.

Now, these columns are no longer available. Instead, we’ve added flexibility so that you can map ANY type of date to the Date column and load data based on that mapping.

Complete the following steps for GL Data - NetSuite Connect Data Load Rules:
- Access the Data Load Rule.
- Open it and navigate to the Define Data Mappings page.
- Map the source Date column to the target Date type column.
- Run the Data Load Rule.
Common: Ability to Convert a Data Load Rule Type to NetSuite Connect
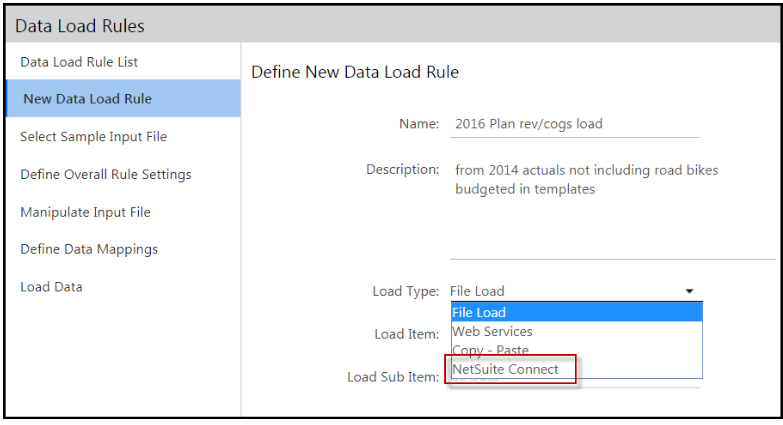
In the Fall18 release we delivered the ability to change the Data Load Rule (DLR) type. For example, you could change a File Load type to a Copy Paste type or to a Web Services type DLR. With this release, you can change any type of existing Data Load Rule (File Load/Copy Paste/Web Services) to a NetSuite Connect type. This is beneficial because instead of re-creating the entire DLR (Data Load Rule), you can simply edit it and change the Load Type. This flexibility saves time and ensures consistency in loading data when the same DLR is used.
In Practice:
Access the Data Load Rules pages by navigating to Maintenance > DLR > Data Load Rules.
Double click a DLR on the Data Load Rule List page. The Data Load Rule opens.
Change the load type as needed. In the example below, a File Load type is changed to NetSuite Connect.
Complete the remaining steps from Select Sample Input File to the Load Data step to use the DLR.
To use NetSuite Connect there are required setup steps. Click here to learn all about NetSuite Connect and how to perform the setup.
Common: Ability to Load Currency Exchange Rates with the NetSuite Connect Data Load Rule
You now have the ability to load currency exchange rates using NetSuite Connect. This functionality expands upon the current NetSuite Connect capabilities, which allow you to load segment hierarchies and GL data.
Exchange rates are loaded to Host Analytics via a NetSuite Connect Saved Search. For information, on how to set up a Saved Search, click here. Once NetSuite Connect is setup and the Saved Search is created, follow the steps below to load exchange rates.
In Practice:
Navigate to Maintenance > DLR > Data Load Rules.
Click the New Data Load Rule tab.
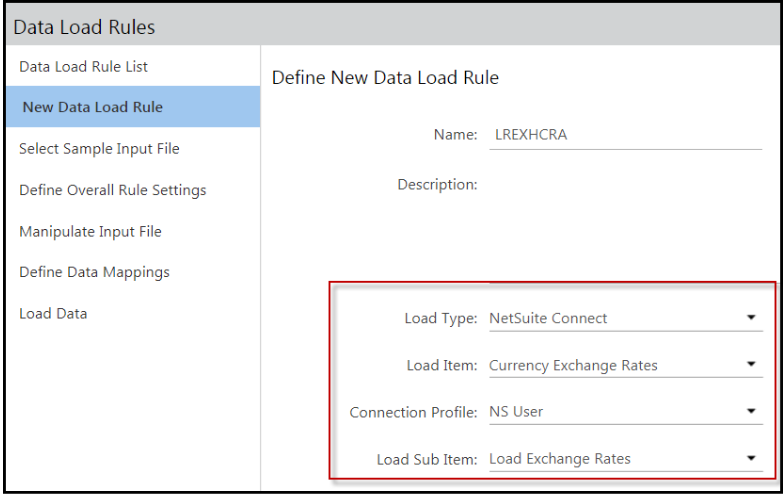
For Load Type, select NetSuite Connect.
For Load Item, select Currency Exchange Rates.
For a Connection Profile, which is set up on the Configuration Tasks screen.
For Load Sub Item, select Load Exchange Rates. See the image below.
Click Next. The Select Sample Input File screen opens.
Complete header and number and date format fields. Click Saved Search. The Select Saved Search screen appears as shown below.
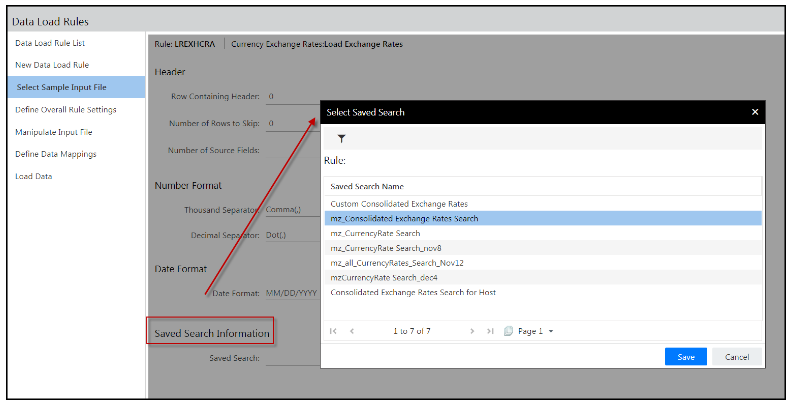
Select a Saved Search and click Save.
Click Next. Complete all remaining pages and fields and create a Process Flow to load data.
For detailed information on Data Load Rules and how to load data, see the Admin Guide to Loading Data.
Common: Filter Option for Entity Lock
The new Filter option allows you to filter entities by status; locked, unlocked or partially locked. Filtering entities by status allows you to quickly determine the state of the entities.
In Practice:
1. Access the Lock Data page by navigating to Maintenance > Reports > Lock Data.
Click the Lock Data tab.
Click the Filter icon (shown below).
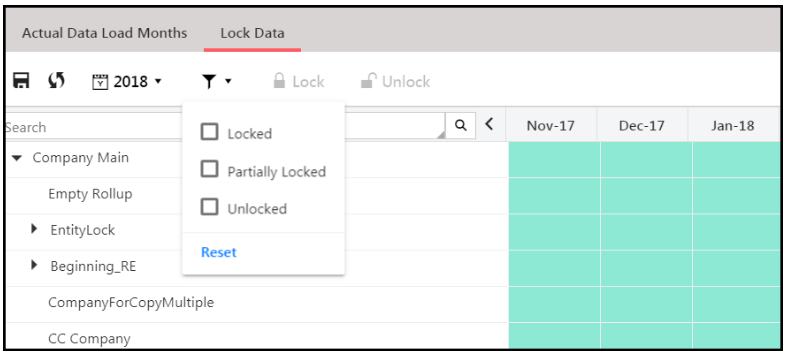
Select Locked to show entities that are in a locked state.
Select Partially Locked to show entities that have members that are locked.
Select Unlocked to show entities that are in an unlocked state.
Select a combination of options; such as Locked and Partially Locked for example.
Click Reset to remove all filter selections.
Common: Special Characters Restriction in Segment Hierarchy Load and Hierarchy Management
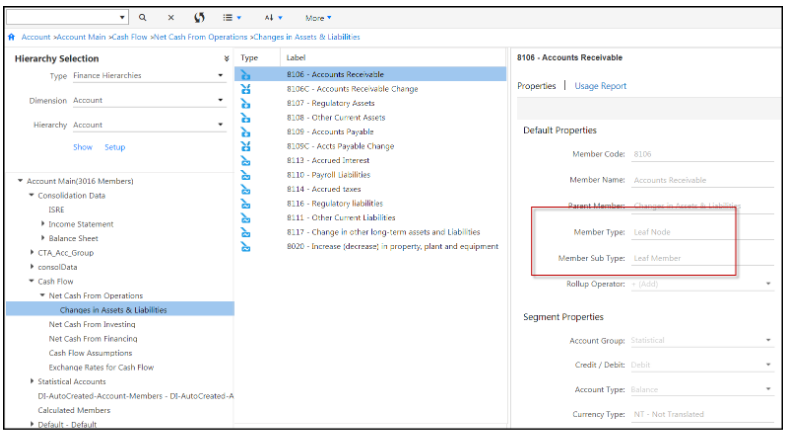
With this release the following special characters are restricted from use in the Leaf Code of a segment leaf member when creating segment hierarchy data or loading it to Host: ‘ " ~ ` ! @ # $ ^ * ( ) + = [ ] { } \ | ; : < > , ?
All other special characters documented in the Getting Started guide are supported.
Here is an example of an Account segment leaf member. The Leaf Code in this case is 8106.
Common: Access to User Management Application Pages
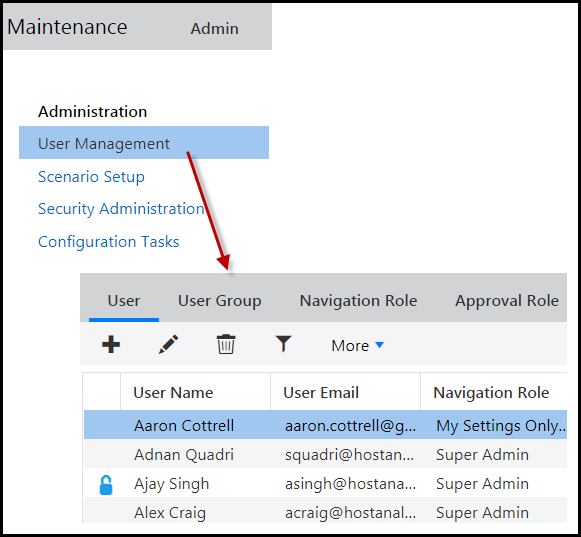
Now, as soon as your application is available, you can access all application pages under User Management (navigate to Maintenance > User Management). This means Admins can immediately add, edit and delete users. There is no need to wait until application configuration is complete.
Planning: New View Mode Functionality for Planning Templates
New View Mode functionality will be enabled by default in all new customer applications. If not enabled, template viewing functionality will remain “as is”. This functionality is not available for Offline Planning templates as of this release. This feature will be available for Offline templates in a future release. Please be aware that once this functionality is enabled, you can’t go back to the original functionality. So, please test in the sandbox environment and train end-users accordingly.
The new view mode functionality for templates offers several benefits and conveniences; most notably, real-time data changes/updates, streamlined movement of information, as well as the elimination of clicks.
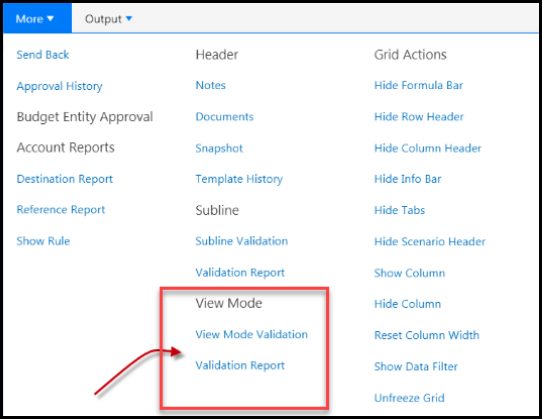
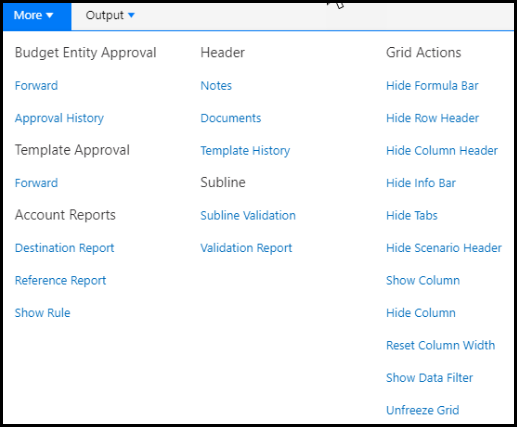
Template calculations are immediately executed so that the template shows up-to-date results (as if you opened it in Input mode). If you don’t enable this functionality and you open a template in View mode, you need to run a Validation report or reopen the template in Input mode. By introducing this new functionality, we have eliminated the need to run a Validation report or and reopen templates in Input mode to view the most recent data. If you enable this enhancement, the More list-box, will look a different ( View Mode options aren’t needed and will be removed as shown in the screenshot below).
Without New View Mode Functionality Enabled:
With New View Mode Functionality Enabled:
If you export the template to Excel, formulas are retained (as shown in the image below) as are sublines.

In Practice
Let’s say a template includes a formula that is based on a global field. When calculated, the formula (for example cell A10 * 2) results in the value of $100 USD. User A saves the template and forwards to User B for review. Before User B performs the review, the formula is changed resulting in a value of $120 USD versus $100 USD.
If this feature is not enabled, this is how the application with behave when the template is opened in View mode:
The value of $100 USD will be displayed
The formula (A10*2) will not be displayed
If this feature is enabled, this is how the application with behave when the template is opened in View mode:
The application will recalculate the formula so that the value of $120 USD is displayed
The formula (A10*2) will be displayed
When Template View Mode functionality is enabled, the application will behave exactly as it would for a template opened in Input mode, but without the option to Save.
If you run the Subline report, the template main lines and sublines will display. The application will recalculate the formulas for the sublines as well and show the latest values, but the formulas will not display.
For Offline Planning, when a template is opened in View mode, the formulas are recalculated and the latest values are displayed. The formulas will display as well.
Planning: Entity Locking in Decision Hub
We’ve added Decision Hub checks and balances. Now, you cannot download a currency linked to a locked entity in Decision Hub. Additionally, the system will verify the period for which the entity is locked.
Access the Exchange Rates - Profile screen by navigating to Maintenance > Currency > Exchange Rates. Click the Profile tab to download exchange rates. Click the Mapping tab to view the currencies that are mapped to the profile.
Currency for an entity is selected on the Hierarchy Management screen.
Entities are locked on the Lock Data page accessed by navigating to Maintenance > Reports > Lock Data and clicking the Lock Data tab.
Reporting: Hierarchy Updates Automatically Display in Report Filters
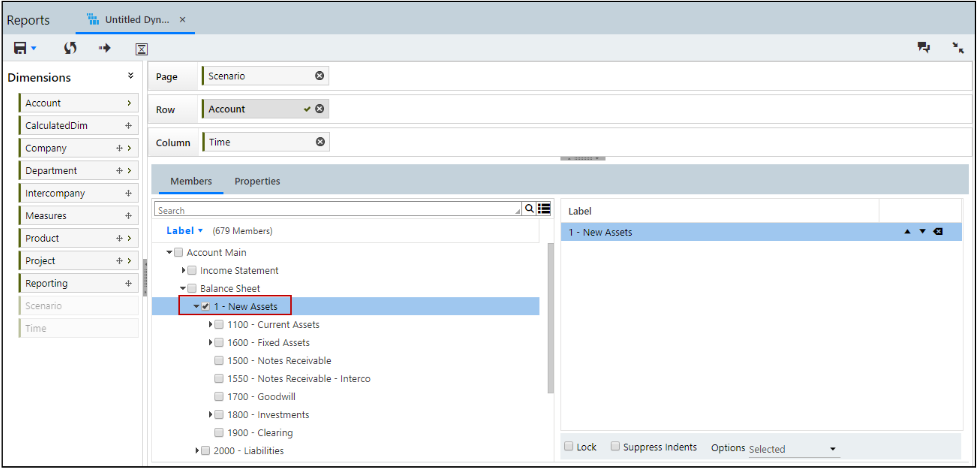
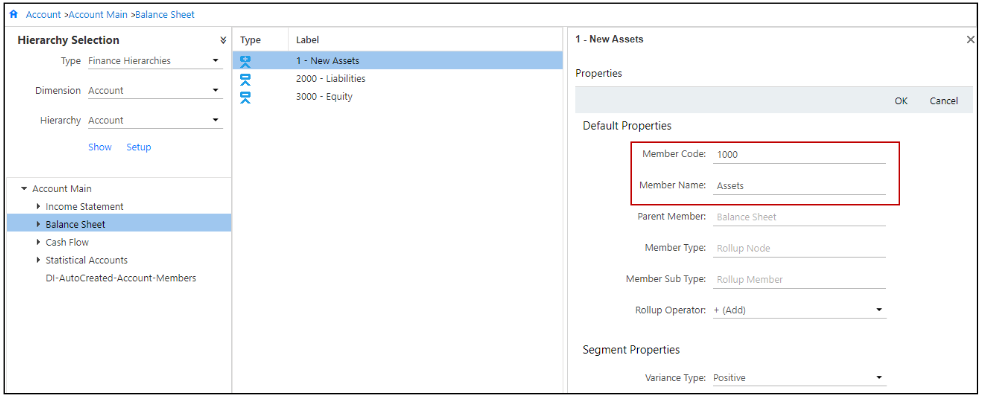
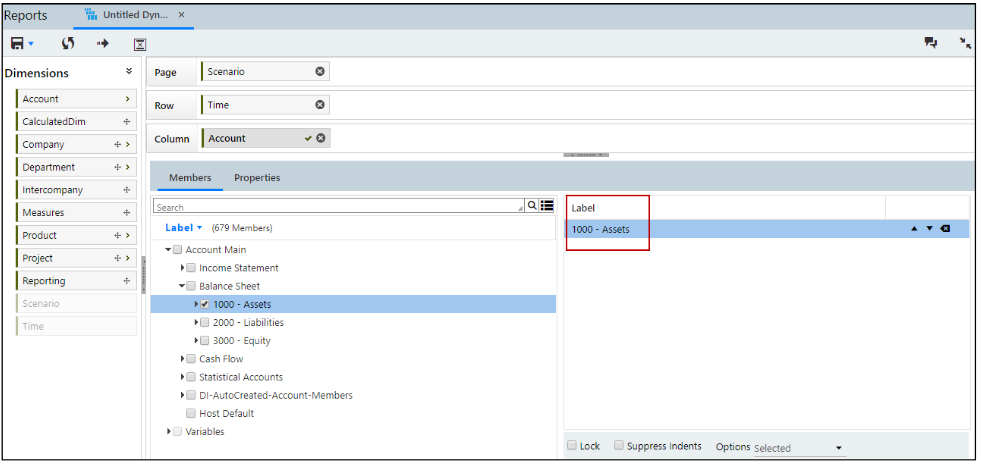
Now, if you update a Member Code or Name on the Hierarchy Management page, the updated name or code is automatically displayed in the member selections of a Dynamic Report. Prior to this release, any change to the Member Code or Name was not displayed in the member selection pane.
Members that are used in a Dynamic Report and deleted from the Segment Hierarchies are still shown in the report selections, however, they are ignored when the report is run.
For example, if you want to change the name and code of the highlighted member in the image below.
You can change the Member Name or Code by navigating to Maintenance > Hierarchy > Hierarchy Management as shown in the below image.
The updated member name and code is automatically displayed under the Label pane in the member selection of the Dynamic Report.
Reporting: Additional Pre-Defined Derived Variables
With this release, we have added 49 derived variables for @CURYR@ substitution variable on Time dimension. These derived variables are available for Financial and Workforce reporting areas.
You can access the derived variables by navigating to Maintenance > Reports > Cube Settings > Substitution Variables > @CURYR@> Derived Variables.
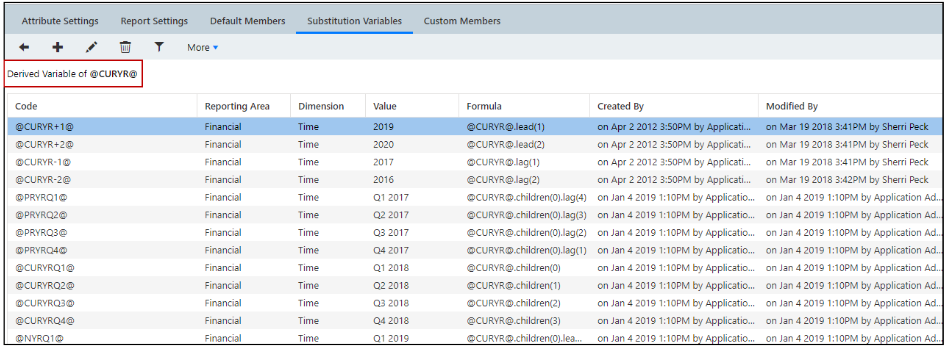
The followings derived variables have been added for this release.
Variable Name | Variable Type | Purpose | |
|---|---|---|---|
1 | @CURYRQ1@ | Derived Variable | Quarter 1 |
2 | @CURYRQ2@ | Derived Variable | Quarter 2 |
3 | @CURYRQ3@ | Derived Variable | Quarter 3 |
4 | @CURYRQ4@ | Derived Variable | Quarter 4 |
5 | @NYRQ1@ | Derived Variable | Next year Quarter 1 |
6 | @NYRQ2@ | Derived Variable | Next year Quarter 2 |
7 | @NYRQ3@ | Derived Variable | Next year Quarter 3 |
8 | @NYRQ4@ | Derived Variable | Next year Quarter 4 |
9 | @PRYRQ1@ | Derived Variable | Previous year Quarter 1 |
10 | @PRYRQ2@ | Derived Variable | Previous year Quarter 2 |
11 | @PRYRQ3@ | Derived Variable | Previous year Quarter 3 |
12 | @PRYRQ4@ | Derived Variable | Previous year Quarter 4 |
13 | @CURM01@ | Derived Variable | 1st month of the year |
14 | @CURM02@ | Derived Variable | 2nd month of the year |
15 | @CURM03@ | Derived Variable | 3rd month of the year |
16 | @CURM04@ | Derived Variable | 4th month of the year |
17 | @CURM05@ | Derived Variable | 5th month of the year |
18 | @CURM06@ | Derived Variable | 6th month of the year |
19 | @CURM07@ | Derived Variable | 7th month of the year |
20 | @CURM08@ | Derived Variable | 8th month of the year |
21 | @CURM09@ | Derived Variable | 9th month of the year |
22 | @CURM10@ | Derived Variable | 10th month of the year |
23 | @CURM11@ | Derived Variable | 11th month of the year |
24 | @CURM12@ | Derived Variable | 12th month of the year |
25 | @NYRM01@ | Derived Variable | 1st month of the next year |
26 | @NYRM02@ | Derived Variable | 2nd month of the next year |
27 | @NYRM03@ | Derived Variable | 3rd month of the next year |
28 | @NYRM04@ | Derived Variable | 4th month of the next year |
29 | @NYRM05@ | Derived Variable | 5th month of the next year |
30 | @NYRM06@ | Derived Variable | 6th month of the next year |
31 | @NYRM07@ | Derived Variable | 7th month of the next year |
32 | @NYRM08@ | Derived Variable | 8th month of the next year |
33 | @NYRM09@ | Derived Variable | 9th month of the next year |
34 | @NYRM10@ | Derived Variable | 10th month of the next year |
35 | @NYRM11@ | Derived Variable | 11th month of the next year |
36 | @NYRM12@ | Derived Variable | 12th month of the next year |
37 | @PRYRM01@ | Derived Variable | 1st month of the previous year |
38 | @PRYRM02@ | Derived Variable | 2nd month of the previous year |
39 | @PRYRM03@ | Derived Variable | 3rd month of the previous year |
40 | @PRYRM04@ | Derived Variable | 4th month of the previous year |
41 | @PRYRM05@ | Derived Variable | 5th month of the previous year |
42 | @PRYRM06@ | Derived Variable | 6th month of the previous year |
43 | @PRYRM07@ | Derived Variable | 7th month of the previous year |
44 | @PRYRM08@ | Derived Variable | 8th month of the previous year |
45 | @PRYRM09@ | Derived Variable | 9th month of the previous year |
46 | @PRYRM10@ | Derived Variable | 10th month of the previous year |
47 | @PRYRM11@ | Derived Variable | 11th month of the previous year |
48 | @PRYRM12@ | Derived Variable | 12th month of the previous year |
49 | @2YRPriorM12@ | Derived Variable | 12th month of 2nd year prior to the current year |
Reporting: Enabled Options for Substitution Variable Selection in Dynamic Reports
With this release, Dynamic Reports display data for variables based on the selection in the Options drop-down list. Prior to this release, when you selected any value from the Options drop-down list for any variable, the Dynamic Report did not show the data based on the selected level.
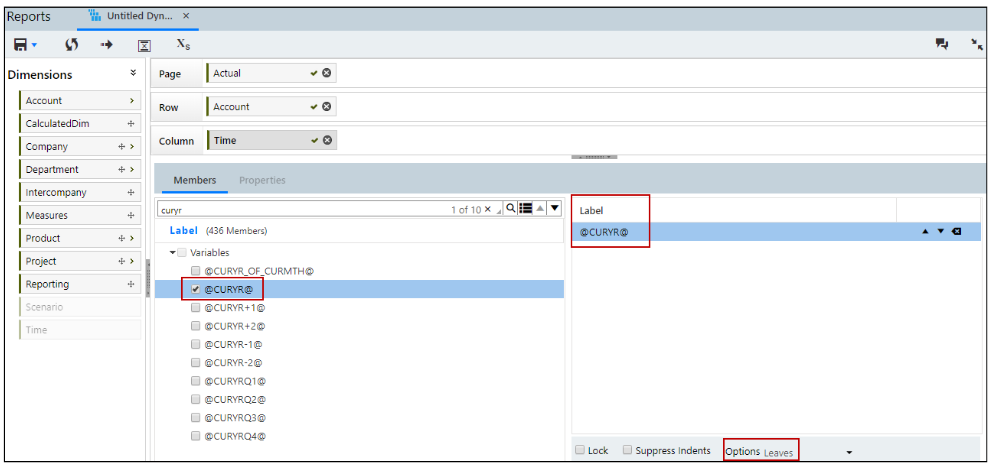
For example, if you want to create a Dynamic report with Account, Time, and Scenario as the dimensions, select a member and variable for the Account and Time dimensions. Then, select the required value from the Options drop-down list.
The screenshot below shows the Leaves option selected for the @CURYR@ variable.
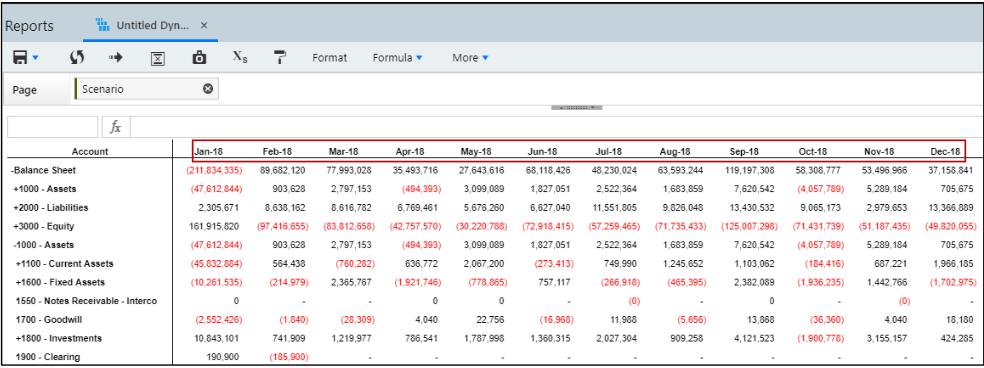
Click Save and then Run the report. The Dynamic Report below displays the Leaves option selected for the @CURYR@ variable as months.
Reporting: Dynamic Report Drill Through Enhancements
The following enhancements have been made in the Dynamic Report Drill Through:
Ability to Enable or Disable Drill Through
Metadata Available in Export to Excel
New Notes Column in the Dynamic Report Drill Through Report
New Measure Column in the Dynamic Report Drill Through Report
Ability to Enable or Disable Drill Through
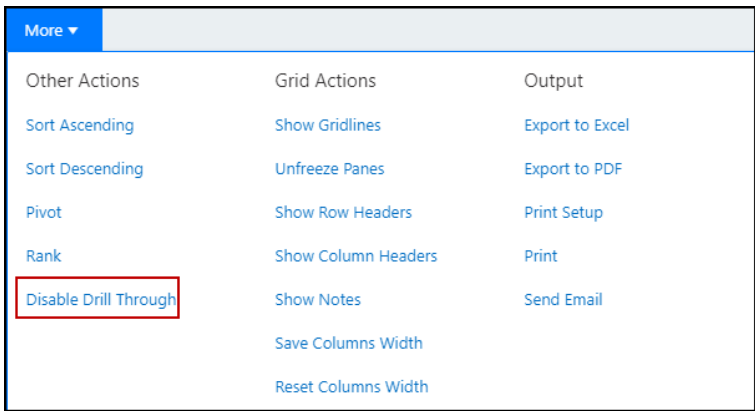
With this release, you have the capability to enable or disable the Drill Through functionality. A new option has been added to the More drop-down menu.
To access the new option, open a Dynamic Report, select the More drop-down menu > and click Disable Drill Through.
Metadata Available in Export to Excel
With this release, you have the ability to view metadata along with general report data in the Drill Through report when you export to Excel. Prior to this release, only the Drill Through report was displayed when you export to Excel as shown in the image below.

The metadata contains the following details as shown in the image below:
Drill Through: Displays the data selected for Drill through
Dimensions: Displays the various dimensions that are selected to create the report. For example, the image below displays Account, Company, Time, Department, Scenario, and Reporting dimensions.
Date: Displays the date and time of report generation.

New Notes Column in the Dynamic Report Drill Through Report
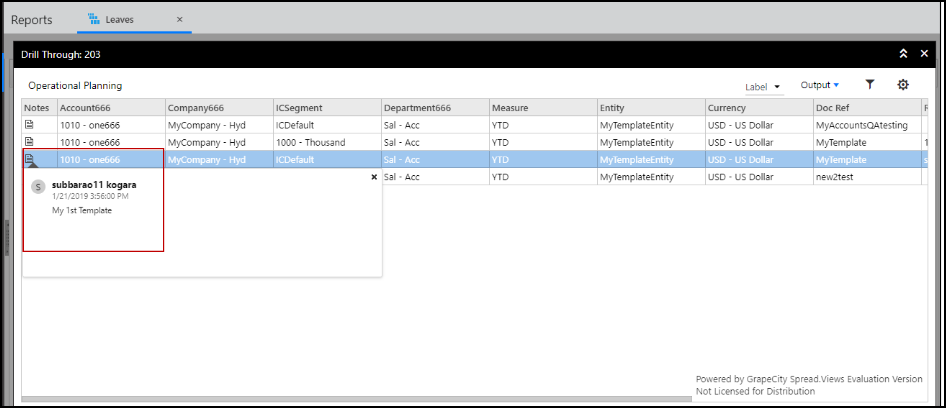
A new Notes column has been added to the Operational Planning tab in the Dynamic Report Drill Through report. This column now displays a Notes icon for a line in Drill Through when the line has a note available in the source Planning template. You can double click the icon to view the content.
For example, the image below displays a note for the highlighted line in the Planning template. When you use the data from the Planning template the note is retained in the Drill Through report.
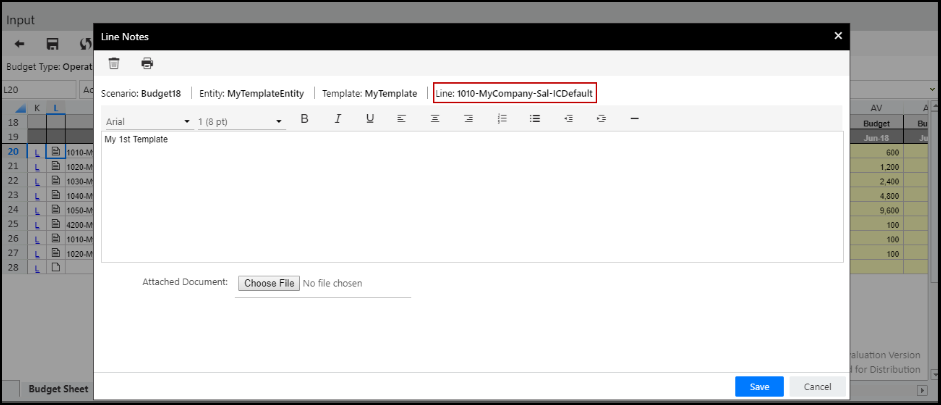
The Drill Through report displays the note that is available in the source Planning template.
Important Information:
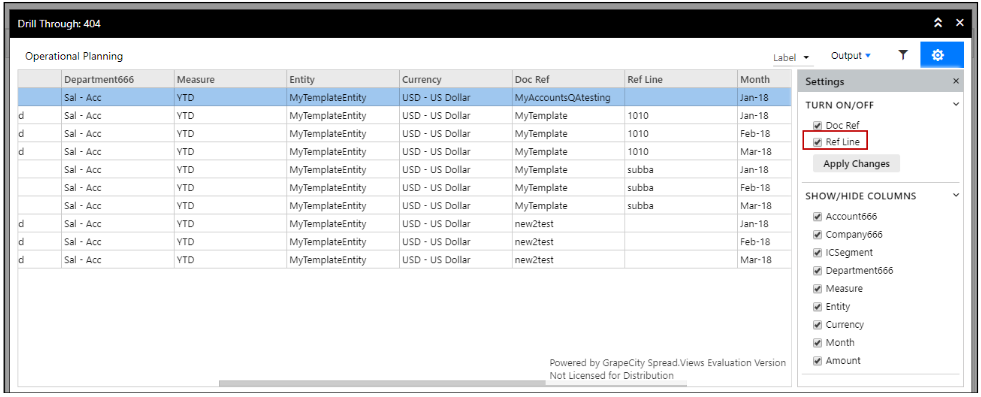
The Notes column is not displayed in the grid if the Ref Line checkbox is not selected.
When you export the Drill Through Dynamic Report, 1024 characters are displayed in notes.
Drill Through displays up to 250 notes.
New Measure Column in the Dynamic Report Drill Through Report
A new Measure column has been added to Dynamic Report Drill Through report. The Measure column is displayed in the Operational Planning, Capital Planning, Workforce Planning, and Translations tabs in additional to Consolidation and GL Data Loads tabs.
The Measure column displays the data similar to Verify Data page.

Reporting: Multiple selections on Measures and Scenario for Pick list
The Show Pick List checkbox in Dynamic Reports now provides you with the ability to select multiple members for Measures and Scenario dimensions.
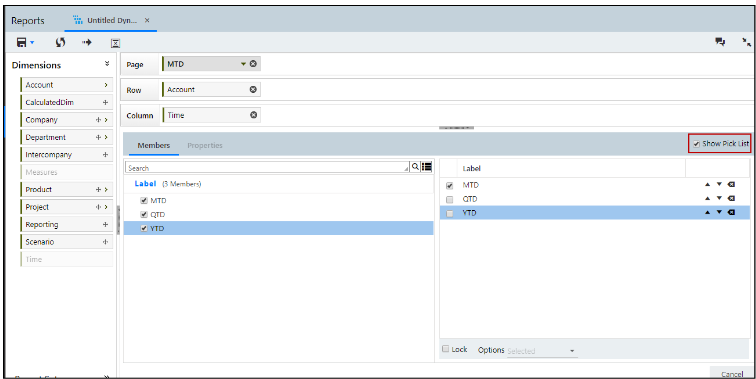
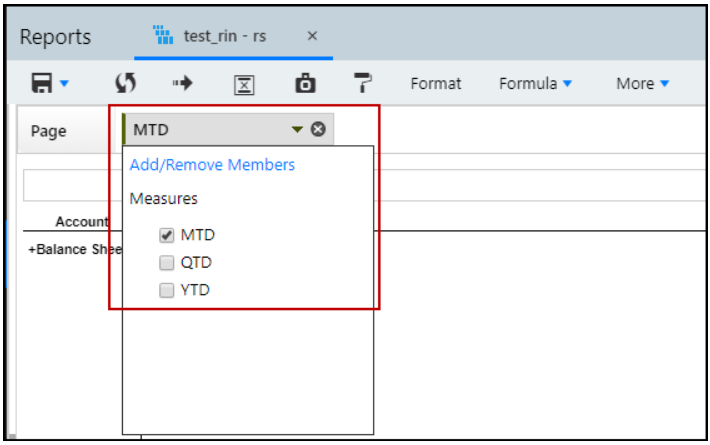
For the Workforce or Financial reporting area, if you select the Measures dimension on the Page axis and select the Show Pick List checkbox, you can select multiple members. However, you can run the report with only one member. You can later select a different member from the axis drop-down as shown in the below image.
Similarly, if you select the Show Pick List checkbox for the Scenario dimension in the Workforce reporting area, you can select multiple members.
Reporting: Dimension Security Report
With this release, you can generate a Dimension Security report. The report contains information about a user’s access details.
The Export to Excel drop-down list has been added to the Dimension Security Setup page. Now, you can export the Dimension Security report based on the following drop-down options:
Export All Users: Exports the Dimension Security report of all the users.
Export Selected User: Exports the Dimension Security report of a user selected from the Dimension Security Setup page.
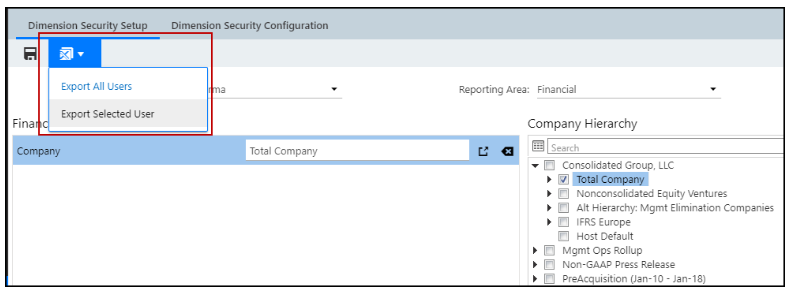
You can generate the Dimension Security report by navigating to Maintenance > Reports > Dimension Security > Dimension Security Setup > Export to Excel.
Important Details:
Dimension Security applied to attributes cannot be exported to the Dimension Security report.
You can download a report with a maximum size of 10MB.
You can download a report with a maximum of 100K rows.
If you select the Export Selected User option, then the Dimension Security report is downloaded directly to your system. When you select the Export All Users option, a notification is displayed that the Dimension Security report has been submitted for processing. After the process is complete, a link to download the report is displayed. You can either click the link to download or you can view the report sent to your registered email address.
When you export the Dimension Security report, all the leaf members are displayed in the level-based format if:
The user has access to a rollup member in the Dimension Hierarchy.
The Copy Scenario Security to Report Security and Copy Budget Entity Security to Report Security checkboxes are selected in the Dimension Security Configuration page.
Reporting: Repeat Row and Column Headers Checkbox on the Dynamic Report Print Setup Page
With this release, two new checkboxes have been added in the Dynamic Report Print Setup window to enable a better viewing and readability experience. Now, when the Dynamic Report output runs into multiple pages, the row and column header are repeated in each page of the Dynamic Report when you print it. The following are the checkboxes have been added to the Print Setup window:
Repeat row header on each page
Repeat column header on each page
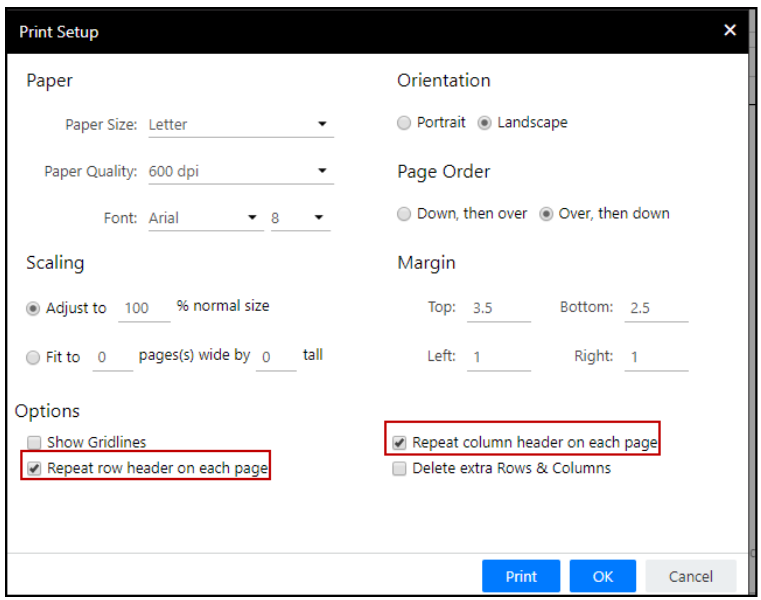
Use the following path to navigate to the checkboxes: Dynamic Report> More > Print Setup.
Dynamic Reports exported as Google Sheets always repeat the headers in the print output irrespective of the Repeat Header configuration done in the Dynamic Report Print Setup.
Financial Packages generated as a Word document and displayed as a Table does not repeat headers in the print.
Reporting: Additional Filters Available for the Budgeted Data Report
The following two new filters are available for the Budgeted Data report:
View
The Budgeted Data report now provides you with the ability to sort the report using the View filter. The View filter comprises the following options:
By Month: Select this to generate a report showing the monthly budgeted data.
By Quarter: Select this to generate a report showing the quarterly budgeted data.
By Scenario: Select this to generate a report showing budgeted data for multiple scenarios. You can select up to 3 scenarios from the Scenario filter.

Time
The Time filter allows you to view the Budgeted Data report based on the selected year, quarter, and month.

Reporting: Intuitive Exit Validations
Now, when you navigate away from the File Cabinet page or close the application, a confirmation message is displayed if unsaved changes exist.
Reporting and Dashboards: Date and Time Display
All fields and columns that display date and time such as Modified Date, Created Date, and Due Date now display according to the user’s time zone.
The exceptions for Date and Time display is;
When Planning Notes are retrieved from Dynamic Reports
When Due Date is retrieved in Financial Package
Date and Time stamp displayed on exports are appended with the time offset. For example, UTC + 0500.
Dashboards: Drill Through Reporting from a Dashboard Chart and New Drill Down Selection
Drilling down and through to data from Dashboards to Operational Planning, Capital Planning, Workforce Planning, GL Data Loaded data, and Consolidation unifies the Host Reporting platform for all financial and operational needs, provides more value through improved operational efficiency, and provides improved traceability to facilitate faster and better business decisions.
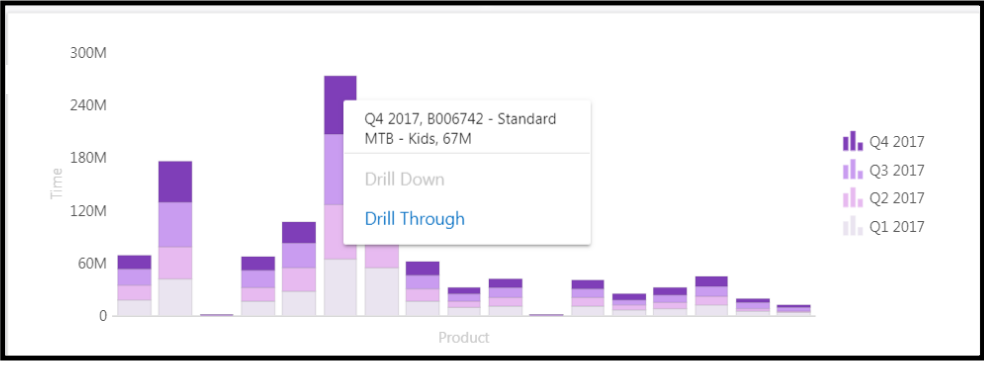
Drilling down and through is available for all chart types, but does not apply to KPIs, Gauge charts, filters and text areas. Drill Down and Drill Through may or may not be available on chart data points. Chart data point selections are made when the chart is created. For example, using the chart below, only Drill Through is available. This could be because the leaf level members are already displayed on the chart; so there are no lower level members to drill down to.
Some Important Details:
Drill through is available for all dimensions, attributes, and attribute hierarchies in the Financial Reporting Area and enabled only if ‘new’ drill through is enabled in the application. Contact Host Analytics Support if this is not already enabled in your application.
Host offers in-memory and on demand loading of drill through data to ensure the best performance with large volumes of data.
All Drill Through reports honor dimension security; irrespective of the individual module access/security such as Planning template security, Data Integration security, budget entity privileges, and Consolidation security.
Drill through on Custom Members is supported only when there is a single dimension multiple member or single dimension single member or multiple dimension single member mapping.
Currency in Drill Through reports is displayed in the same currency and format in which it was loaded to Host.
Number scale is NOT honored in Drill Through reports.
Bubble/Scatter charts show multiple values on a single data point. The Drill Through report displays the source details for all values.
In a Table, drill down always happens on a row irrespective of the cell selected.
In Practice:
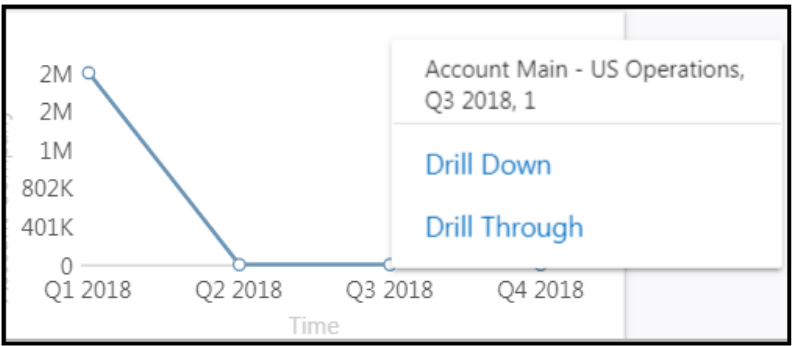
Drill Down is not new functionality, but now you can select the new Drill Down option by right-clicking on a chart intersection to drill to the next level in addition to double-clicking on a data point. For example, using the image below, right-click on the Q3 2018 data point and select Drill Down.
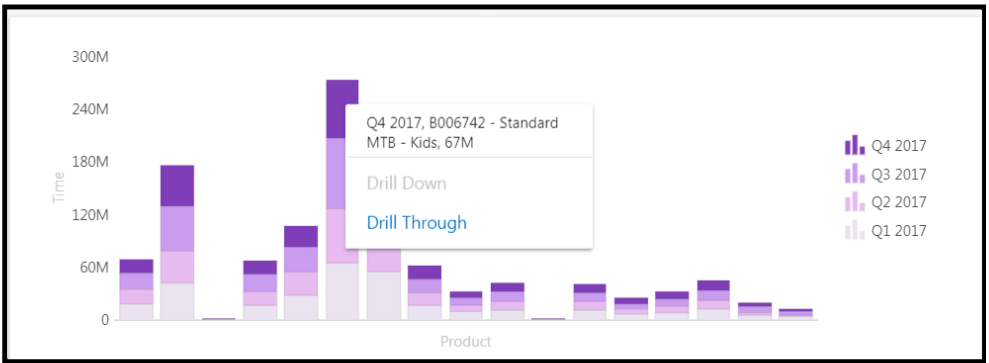
Now, let’s say you want to drill through, using the chart below as an example, right-click at a data point select Drill Through.
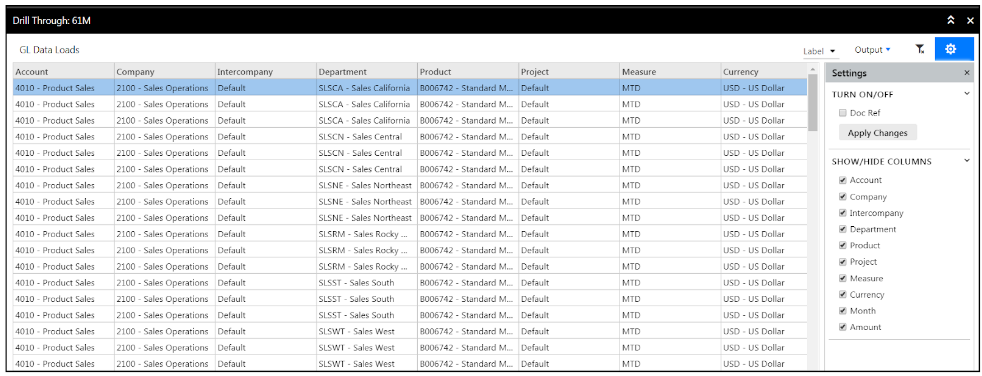
The Drill Through report displays with relevant data as shown below. You cannot save the Drill Through report, but you can export it to Excel.
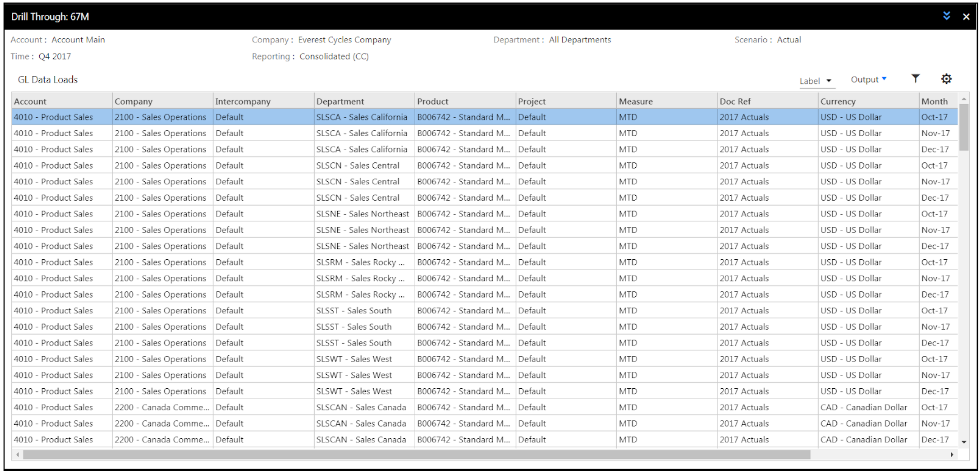
Information on fields and icons available in the Drill Through report is provided below.
Label - Display the Drill Through report output by member code, name, or label (code+name). When Drill Through report is exported to Excel, the code/name/label configuration is retained across all tabs. Once you navigate away from the Drill Through screen, the default setting is reapplied. You cannot have one tab display code while the other displays label, for example. All tabs will display based on the latest selection made on any of the tabs.
Filter - Filter data in the Drill Through report. You can filter each column as shown in the image below.

Gear icon - You can turn on/off Doc Ref. If turned off, data is aggregated for a given segment and currency combination across all Data Load Rules. Select or deselect the checkbox and click Apply Changes.
Select columns to show or hide in the drill through report by selecting or deselecting the checkboxes under SHOW/HIDE COLUMNS.
Dashboards: Stacked Column Chart is Now Available in Combination Charts
You can now use the Stacked Column chart type in single and dual y axis Combination charts. In addition, you can use the Stacked Column chart in combination with a Line chart. This additional functionality provides even more flexibility when designing charts.
In the image below, the new Stacked Column chart type is shown in the setup for a single axis Combination chart.
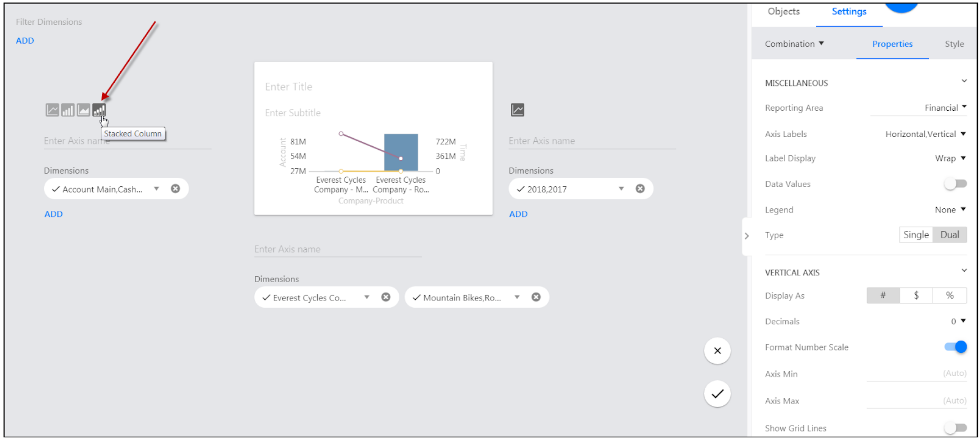
When a Stacked Column chart is applied in a Combination chart, the Settings pane enables all existing configurations as applicable for the Stacked Column chart.
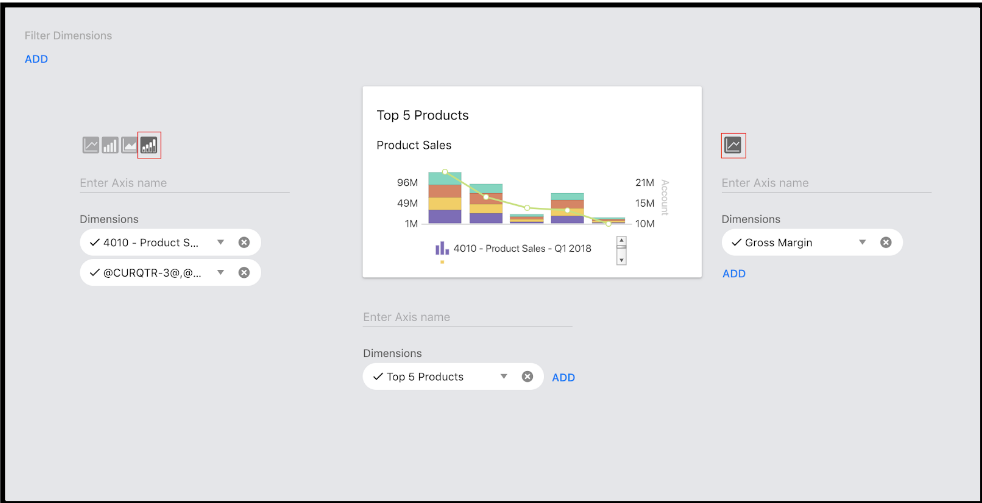
The image below shows the Stacked Column chart type in a dual axis Combination chart used in combination with a Line chart.
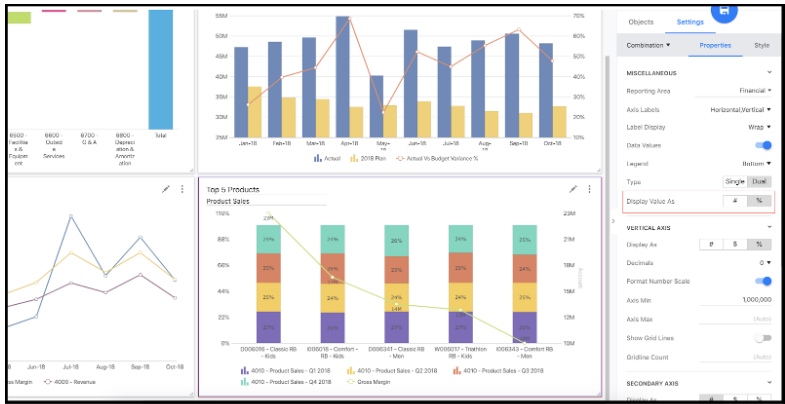
Enable Data Values and set the Display Value As to % to include the percentage Stacked Column chart in combination with a Line chart.
Dashboards: Ability to Override Substitution Variable Values at Dashboard Run Time
Now, you have the ability to override substitution variable values for a Dashboard when you perform a run or edit. This flexibility provides you with the means to override substitution variable values on the fly. For example, you might have a quarterly substitution variable added to multiple charts to display the current quarter. But, let’s say you want to see chart results for a prior quarter to compare and contrast with the current quarter. You can open the substitution variables page from the dashboard, change the value for the current quarter substitution variable to the prior quarter, and run the dashboard.
We’ve added a new Substitution Variable icon to display and modify values. This icon is shown below. It is displayed for standard and derived variables from the Dashboard edit and run interfaces when:
Substitution variables are used in filters (both dashboard and chart level)
Substitution variables are used in charts
Substitution variables are used on horizontal or vertical axis
Substitution variables are used on secondary axis
Substitution variables are used in tables
Substitution variables are used in text areas
Substitution variables are used in KPIs
Substitution variables are used in titles, subtitles, or descriptions
Substitution variables are used in custom members
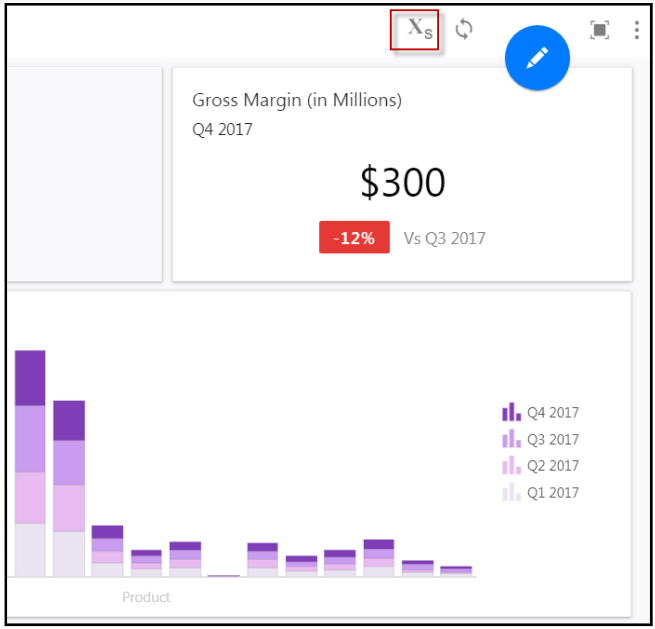
In Practice: How to Select a New Substitution Variable Value to Override the Existing Value
In this example, the @CURQTR@ substitution variable value is overridden and changed from Q42017 to Q32017. The dashboard is executed with the new value.
Open a dashboard in edit mode.
Click the Substitution Variables icon. The Substitution Variables page displays as shown below. A consolidated list of all dashboard specific substitution variables used in all charts, tables, filters, and text objects is displayed. Note that if a single variable is used multiple times in a dashboard, it is displayed only once on this page and the value is the common value. Default values set up for each Substitution Variable on the Maintenance Substitution Variable setup page (accessed by navigating to Maintenance > Reports > Cube Settings > Substitution Variables) are displayed.
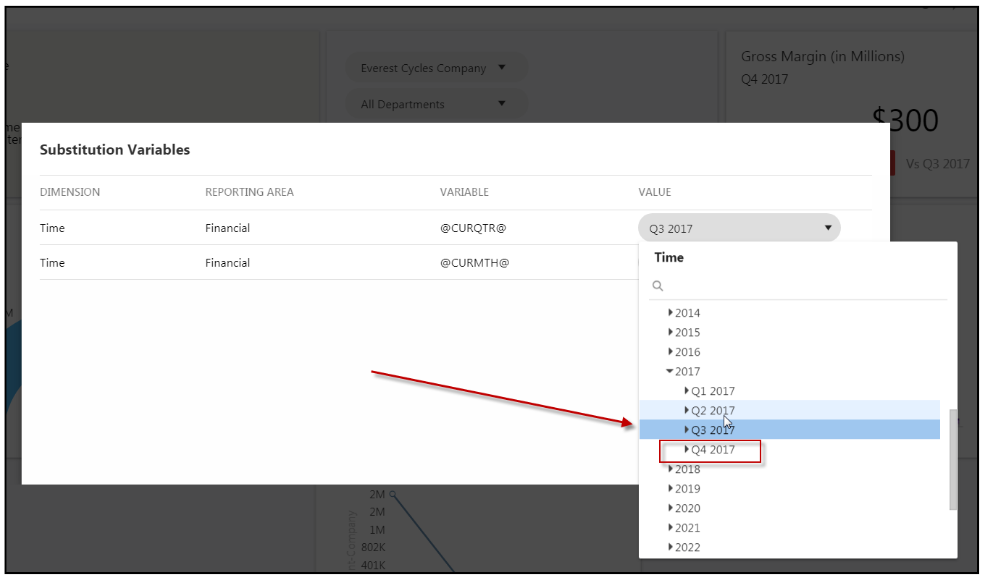
Click Run. The dashboard executes and replaces the newly selected value. Note that The values updated are not saved and have no effect on the default values selected and saved in the Maintenance Substitution Variable setup page for the substitution variable.
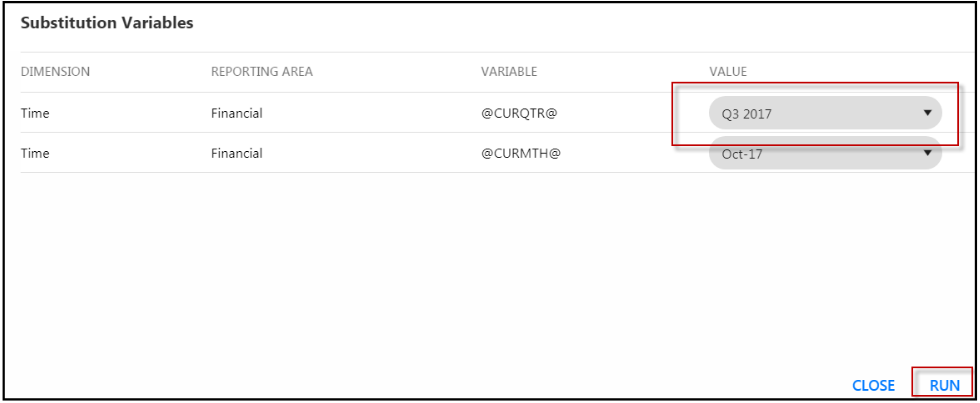
On the Substitution Variables page, the Dimension, Reporting Area, and Variable columns are shown (along with the Value column).
If a dimension is used in the dashboard that is shared across reporting areas (Financial, Workforce, and Scorecard, [does NOT apply to Modeling]), for example @CURMTH@, and the same dimensional variable in used in multiple dashboard charts created on different reporting areas, then the variable is shown only once on the page. The value is applied across all reporting areas and corresponding charts.
For all derived values used within the dashboard elements, the corresponding standard variable shown and the derived variable values are calculated based on the standard variable value set.
Dashboards: Wrap Headers in Dashboard Tables
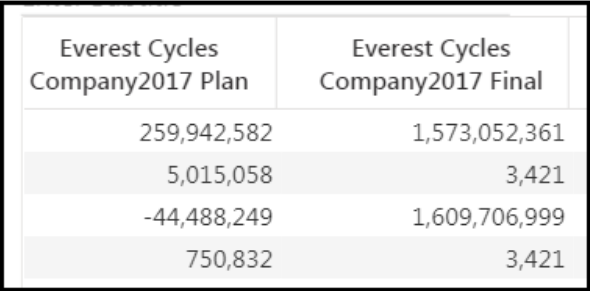
Row and column headers in all dashboard tables are now centered and wrapped instead of truncated. We’ve reduce the column width by wrapping the headers so that more data is visible. See how the column headers are wrapped in the table below.
Consolidation: Ability to Post Eliminations During the Consolidation Process
Now you can include eliminations (along with interim and reporting currencies) in the Consolidation process, which can then be scheduled to run in Cloud Scheduler. This eliminates the need for manual execution, however, you can continue to post eliminations independently as well. Having both options provides additional flexibility and convenience.
Active elimination sets are processed and posted during the processing of common currency in the Consolidation process. More specifically, the sequence of execution within the Consolidation process is as follows:
- Local Currency
- Common Currency
- Interim Currency
- Reporting Currency
During the processing of Common Currency, the following happens:
Local currency is converted to common currency
Dynamic Journals Posting
Non Controlling Interest Calculations
Active elimination sets are processed and posted - this happens the first time eliminations sets are posted and for subsequent Consolidation processing the elimination sets are first cleared and then posted.
Current Year Retained Earnings calculations
Beginning Retained Earnings calculations
Hyperinflationary Company Processing
CTA calculations
If the posting of any elimination fails during the Consolidation process, the entire process fails. If a Cloud Scheduler task includes the posting of eliminations for a company and the elimination company under the rollup company is deleted at some point in time, the Cloud Scheduler task will fail. To resolve this issue, update the existing Cloud Scheduler task and uncheck the Eliminations checkbox. Save it and run again.
In Practice:
Access the Consolidation Control Panel.
Select the Consolidation Process.
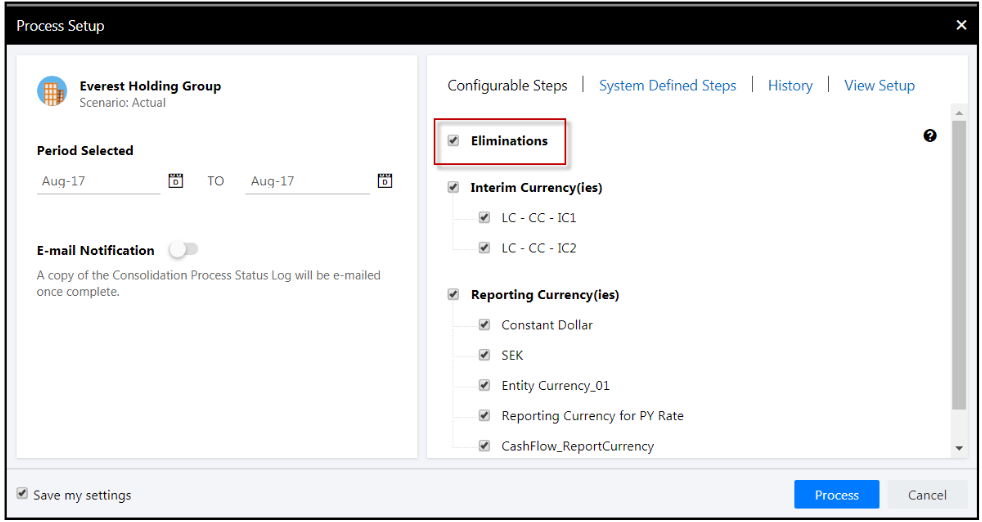
Click the Process action. The Process Setup page appears as shown below.
Select the Eliminations checkbox and click Process or set up a Cloud Scheduler process. Note that the Eliminations checkbox is only available/visible in the selected company is a rollup and has an elimination company as one of its descendants.
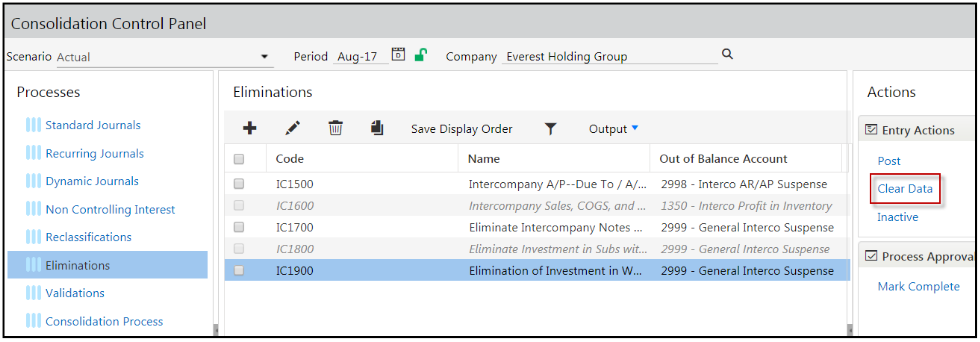
When eliminations are posted as part of the Consolidation process, the only way to clear elimination postings is to perform the following steps.
Access the Consolidation Control Panel.
Click the Eliminations process in the left pane. Eliminations are shown in the center pane.
Select an elimination and click the Clear Data action as shown below.
Consolidation: Updates to Status Column and Display of Active / Inactive Entries
There are three updates being delivered, which are:
Renaming of Inactivate action and Deactivate action to Active and Inactive
Status Column
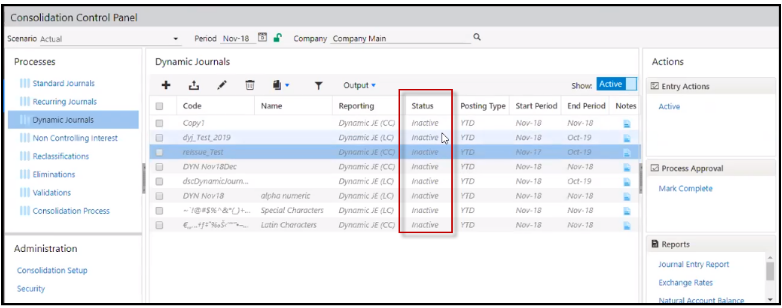
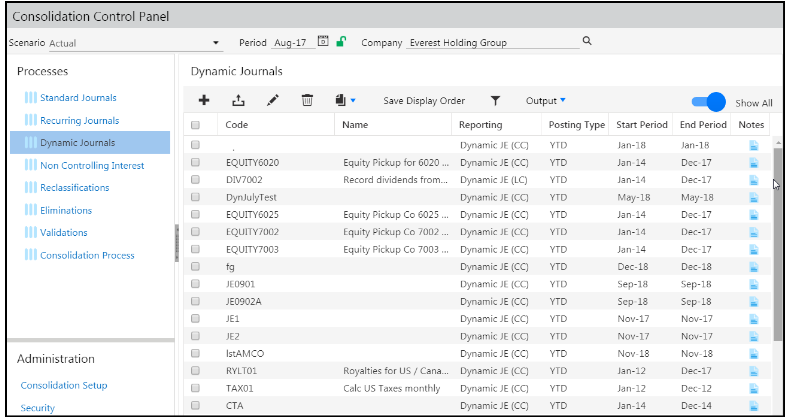
With the Fall18 Release we delivered functionality so that you could change the status of Elimination Sets to Active or Inactive. Now, we’ve added the Status column for consistency and informative purposes to all Processes including; Dynamic Journals, Non Controlling Interest, and Validations.
With Status Column.
Prior to this Release.

Show All Toggle
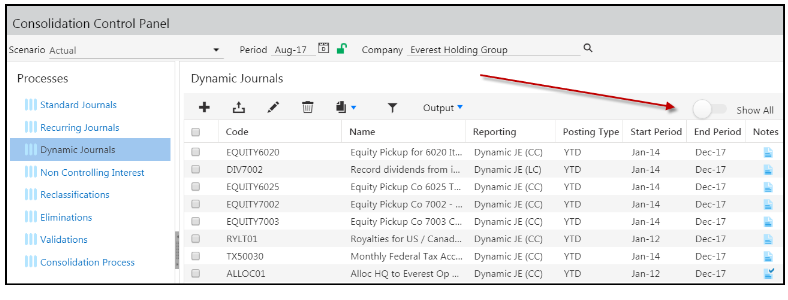
Prior to this release, the Show toggle (shown in the image below) displayed active journals only. Now, the Show All toggle, when turned off, displays all Active and Inactive journals in the selected period. When turned on, all journals for all periods are shown.
Show All Turned Of
 Show All Turned On
Modeling 2.8: Spotlight Web Reporting Improvements
In November 2018, we introduced an opt-in replacement for Reporting on the Web. The Web Reporting module offers support for Excel formulas and Suppress Rows and Columns.
In this release, we are adding support for multiple tabs on the web, standardized fonts, more flexibility in charts, and quick functions.
Spotlight Web Reporting: Multiple Tabs Supported
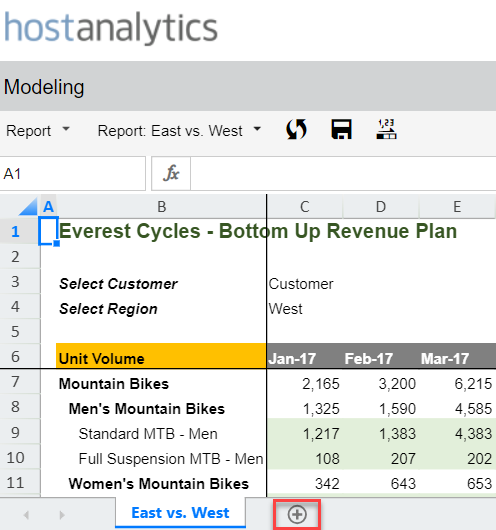
You can now run multiple reports in Spotlight by adding tabs. You can easily switch back and forth between tabs to compare and analyze data from different reports simultaneously. You can run up to 10 reports at a time.
This feature is limited to Reports and is not available for Views or Models in Spotlight.
Click + to add a new tab, then select a report from the toolbar to open it.
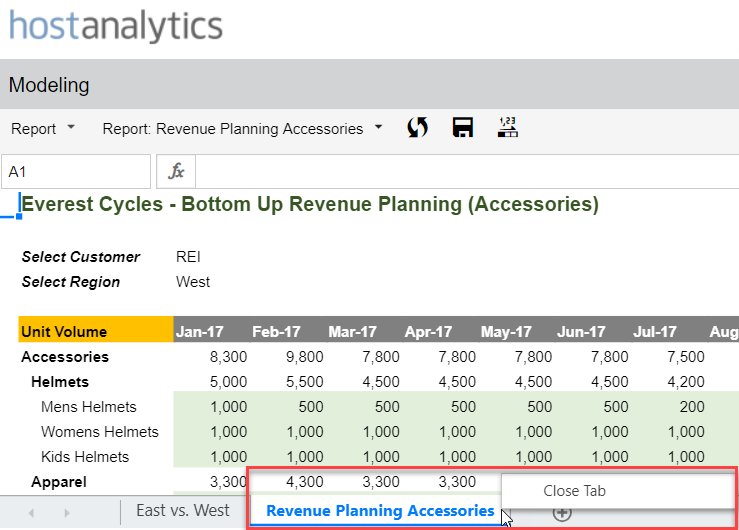
To close the report, right-click on the tab and select Close Tab.
You can also drag and drop to re-order the tabs, and use the arrow buttons to navigate through the tabs.
Spotlight Web Reporting: More Charts Supported
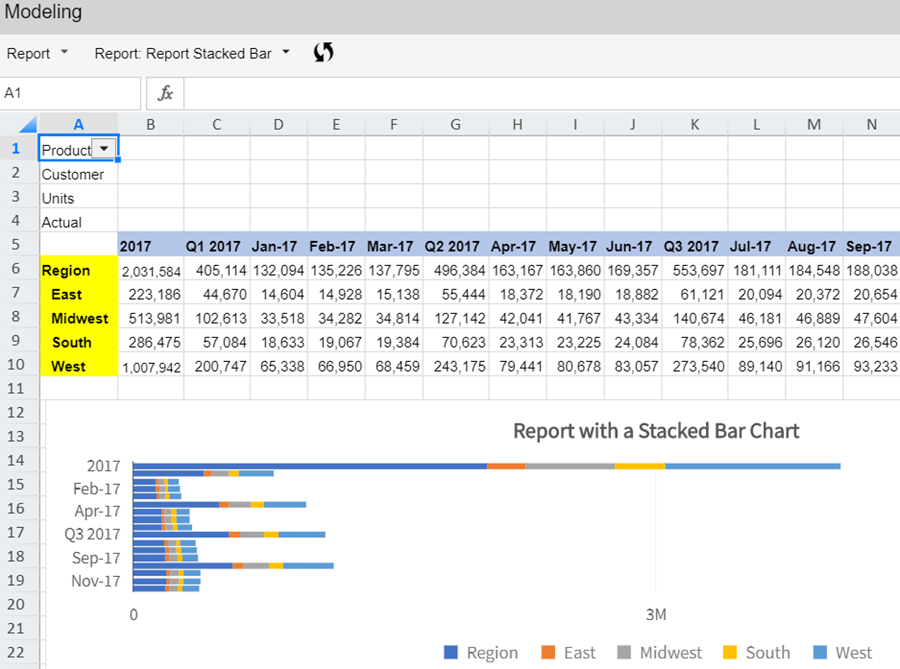
All chart types currently supported in SpotlightXL are now supported on the web. Formatting as applied in SpotlightXL is also supported on the web; examples include chart title text, chart legend, chart color palette, chart style, tooltips, and position.
Charts in Web Reporting are now more consistent with the user interface in Host Analytics Dashboards.
Chart types supported in Spotlight Web Reporting are variations of bar, column, line, pie, and scatter.
Chart Formatting Supported. Chart Formatting Supported. Items in orange color are new in this release. Items in orange color are new in this release. |
|---|
Chart Title - Text |
Chart Legend |
Chart Color Palette |
Chart Tooltip |
Chart Style |
Chart Position |
Bar Chart |
Clustered Bar |
Stacked Bar |
100% Stacked Bar |
3D Clustered Bar |
3D Stacked Bar (not supported in Excel 2016) |
3D 100% Stacked Bar (not supported in Excel 2016) |
Column Chart |
Clustered Column |
Stacked Column |
100% Stacked Column |
3D Clustered Column (not supported in Excel 2016) |
3D Stacked Column (not supported in Excel 2016) |
3D 100% Stacked Column (not supported in Excel 2016) |
3D Column |
Line Chart |
Line |
Line with Markers |
Stacked Line with Markers |
100% Stacked Line with Markers |
3D Line |
Stacked Line |
100% Stacked Line |
Pie Chart |
Pie |
3D Pie |
Pie of Pie |
Bar of Pie |
Doughnut |
Radar Chart |
Scattered Charts |
Excel Formatting Supported |
|---|
Font Size |
Bold |
Italic |
Underline |
Double Underline |
Background Color |
Text Color |
Style |
Border - Top |
Border - Right |
Border - Bottom |
Border - Left |
Border Properties* |
Border Color |
Alignment - Left |
Alignment - Center |
Alignment - Right |
Indentation |
Format - Number |
Format - Currency |
Format - Percent |
Column Width |
Row Height |
Hide Gridlines |
Hide Headers |
Images in Reports |
*Border Properties - All border properties are supported in Spotlight with the exception of Diagonal Borders (left and right) and Advanced dashed borders (beyond simple dashed border). If selected in the design mode of a report, when the report is rendered they will be reverted to the simple dashed border.
Spotlight Web Reporting: Standardized Font
The font used to display Spotlight Web Reports is now standardized as Arial 9-point. This applies to new and existing reports with no custom font settings. If you have modified the font of headings and other text items in design of existing reports, they are honored.
Spotlight Web Reporting: Quick Math Functions
The Web Reporting window is now updated to include quick functions such as Sum, Average, Count, Min, and Max when you select a range of cells.

Modeling 2.8: Spotlight for Office: Support for Embedded Excel Workbooks in PowerPoint and Word
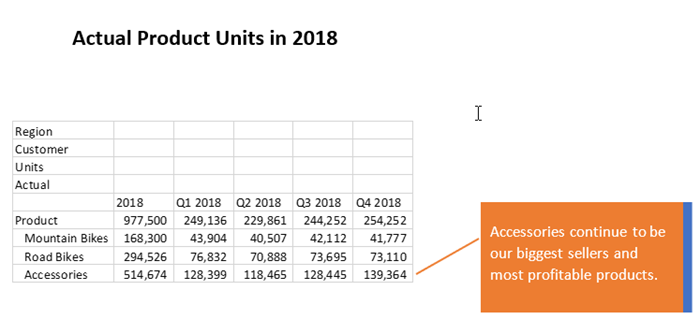
In this release, we are enabling users to embed Excel workbooks inside Microsoft PowerPoint presentations and Microsoft Word documents. With the Spotlight for Office add-in, you can refer the data directly in PowerPoint and Word, however, you also have a need to leverage Excel formulas and formatting. This is accomplished by embedding the workbook.
To embed the Excel workbook, use the Excel Reporting feature in SpotlightXL to lay out the report according to your needs, then use Spotlight for Office to insert it into a presentation or document.
The main advantage to embedding a workbook is the ability to use Excel formulas and formatting within the object in PowerPoint or Word while still having access to the latest data with the click of the Refresh button.
Best Practice Recommendations when Embedding an Excel Workbook
Have only one worksheet in the workbook. That worksheet must use Excel Reporting formulas to display and retrieve data and dimensions.
Have only a few columns and rows in the workbook.
Have data references from only one model.
For general information on Spotlight for Office, see Modeling: Spotlight for Office Primer.
For information on creating Excel Reports, see Modeling: Creating Excel Reports,
To embed a workbook in PowerPoint:
In SpotlightXL, create an Excel Report and save the workbook.
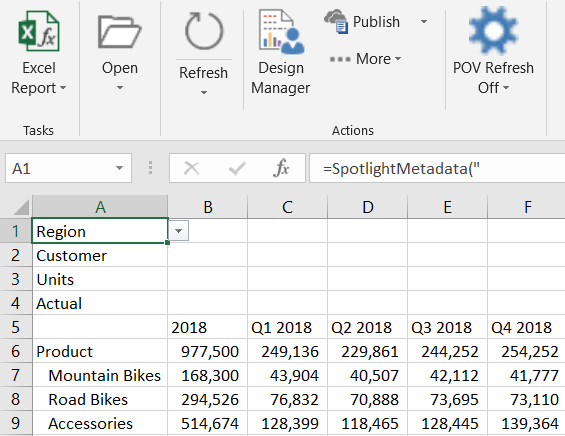
Start PowerPoint or Word.
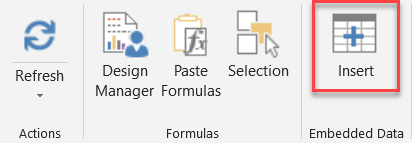
On the SpotlightPPT or SpotlightWord menu, select Insert.
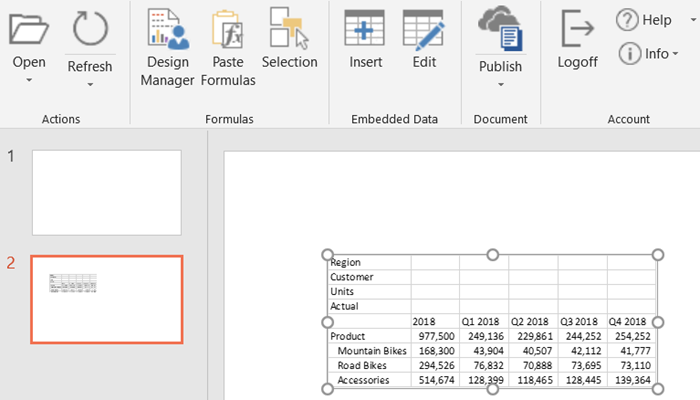
From the Open dialog box, find and select the workbook and click Open. The report from the workbook appears in a box.
To add formulas or formatting, double-click anywhere inside the box. An Excel menu then appears within the PowerPoint or Word window, giving you the ability to utilize the power of Excel.
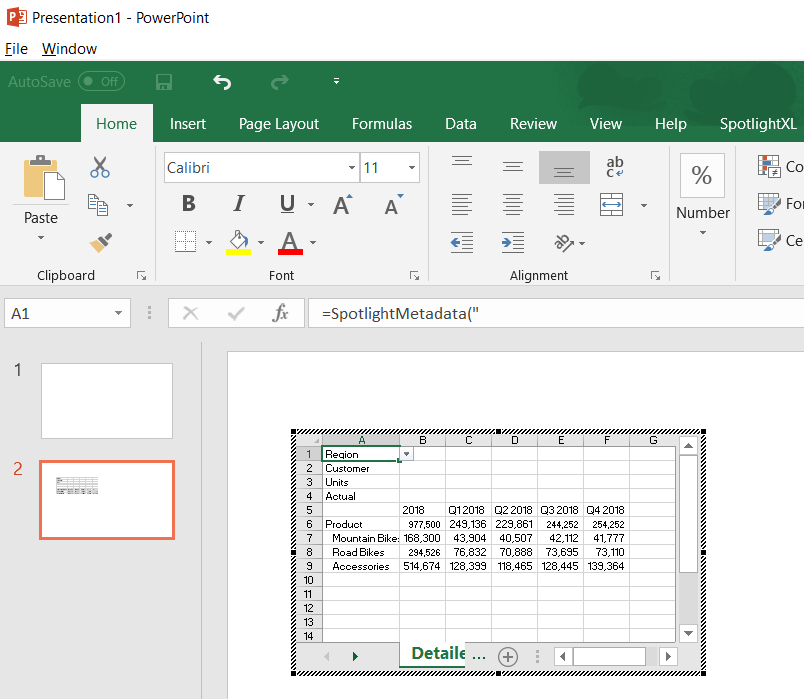
In this example, a % of Total column is added and formulas inserted.
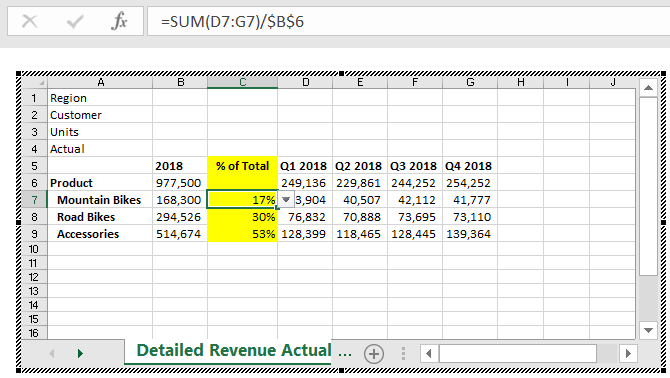
To return to PowerPoint or Word, click outside the box.
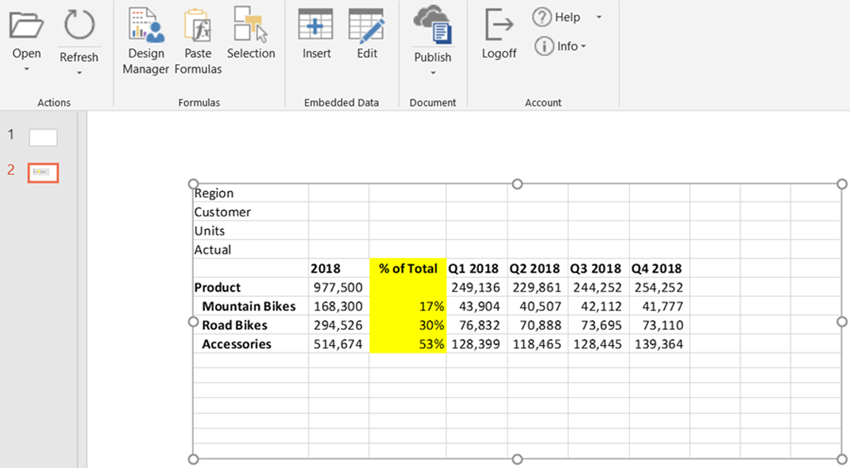
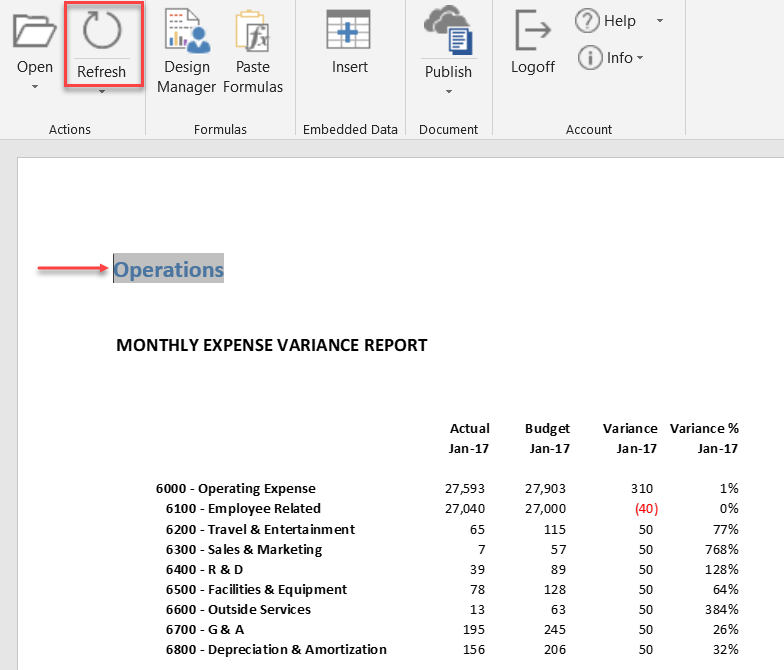
Whenever you want to get the latest data, click Refresh. When you click Refresh, the cells with references to Spotlight formulas (Excel Reporting cells) are refreshed from the model, and the cells with regular Excel formulas are recalculated. Any formatting that is applied on the embedded sheet is retained.
To add a POV (point of view):
First insert the workbook into the PowerPoint presentation or Word document. The workbook should contain Excel Reporting formulas from only one model.
Notice that this report has no POVs.
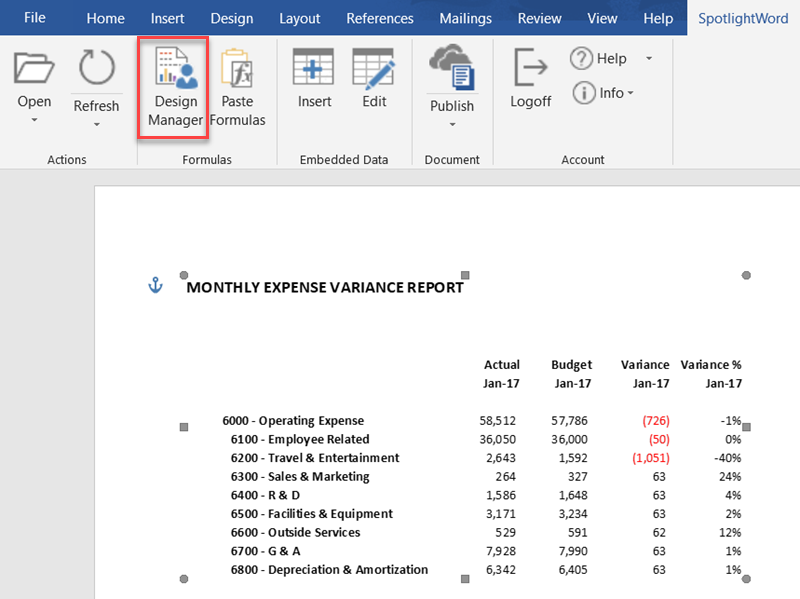
Click Design Manager.
Click the POV button.
Select the model and dimension from the list boxes. The model must be the same model that is used in the embedded workbook. In the example above, we want to look at the Expense Variance for different departments, so we will add the Department dimension.
Select a member of the dimension to display first. By default, the root of the dimension is displayed.
Click Update to insert the POV into the document.
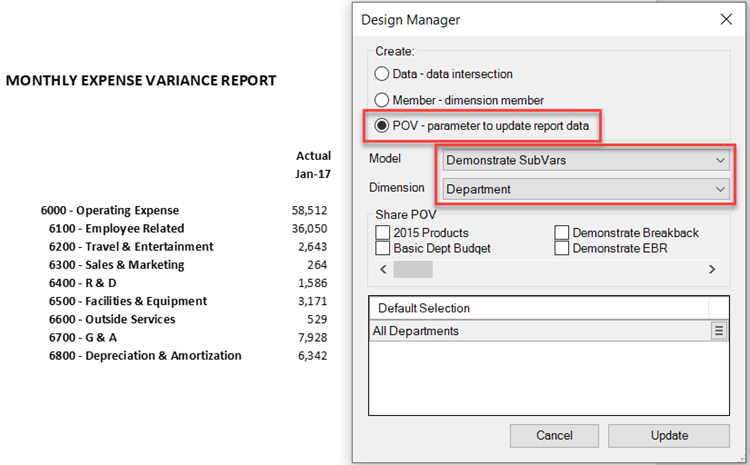
The POV is inserted near the top of the embedded worksheet. Use the mouse to place the POV above or to the left of the worksheet. Use the native formatting options in PowerPoint or Word to set the font and size.
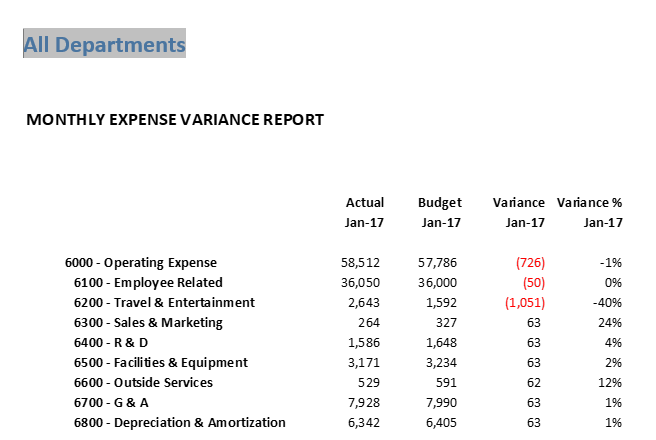
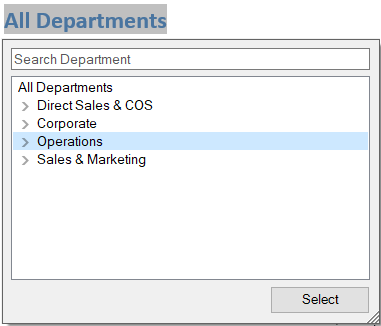
Double-click the POV to open the member selection box. Select a department from the Department dimension and click Select.
Click Refresh. Notice that the data in the embedded workbook changes to display the data for the selected member.
To embed a workbook in Word:
Click Insert and select the workbook you want to embed. The worksheet appears with a box around it.
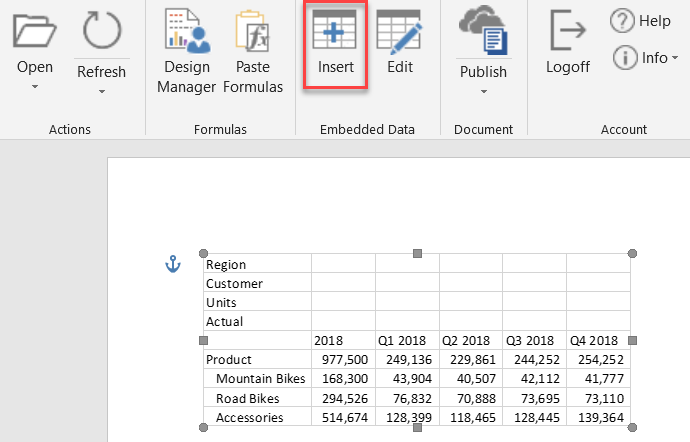
Double-click the box to manipulate the data formatting or add formulas.
Use the word processing features inside Word to add headings, commentary, or callouts to the data for a polished summary.
Modeling 2.8: Direct Access to PCR Improvements
This release includes the following improvements to Direct Access to PCR models.
Direct Access to PCR: Metadata Dimension Security for the Scenario Dimension
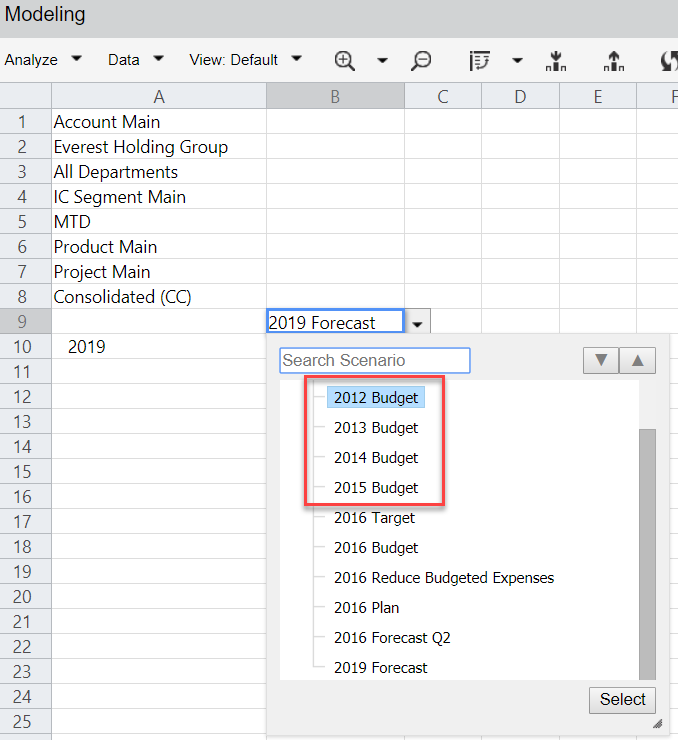
For models defined with Direct Access to PCR, all data dimension security defined in PCR is honored in Spotlight. However, before now, all metadata for the Financial cube is visible to the users in Spotlight. In this release, we are adding metadata security for the Scenario dimension only. Users will only see the scenarios that they have been given access to in PCR.
For example, if a user has access only to the East region, they will see all the other regions in the Dimension list boxes but will see only data for the East region. For the Scenario dimension, users will only see the metadata for the scenarios they have access to in PCR.
To enable Scenario metadata dimension security for Direct Access models:
Login to PCR.
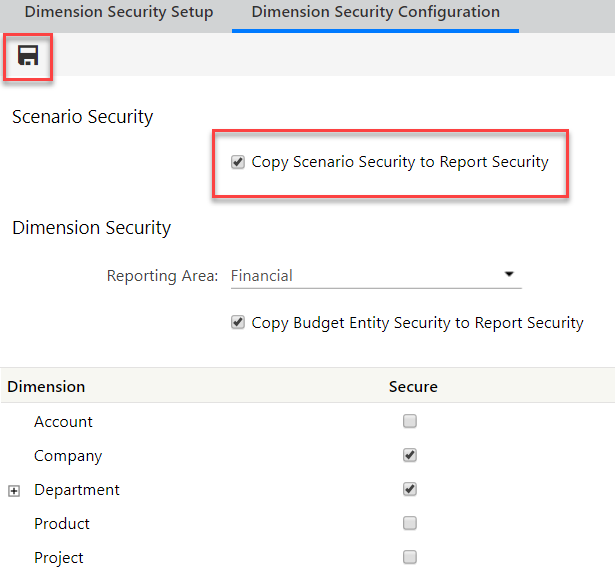
Select Maintenance, Overview, Reports, Dimension Security, Dimension Security Configuration.
Ensure that Copy Scenario Security to Report is checked, then click the Save button.
Select Maintenance, Admin, User Management, then select the user who will be working with Direct Access models.
Edit the user.
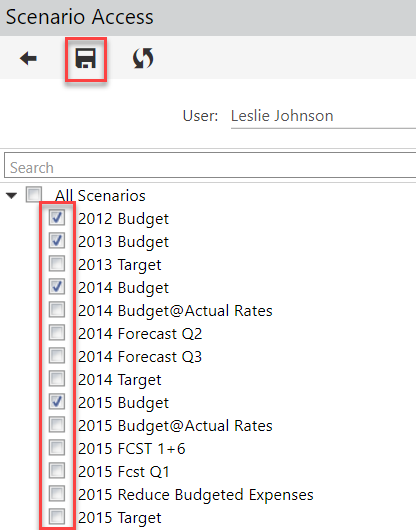
Select the More menu and select Scenario Access.
Check and uncheck items the user should or should not have access to, then click the Save icon.
Repeat steps 4-7 for each user who will be working with Direct Access models.
Here is what the user will see in a model to which their Scenario access has been restricted.
Direct Access to PCR: Support for PCR Cube Default Members for System-Defined Dimensions in New Views
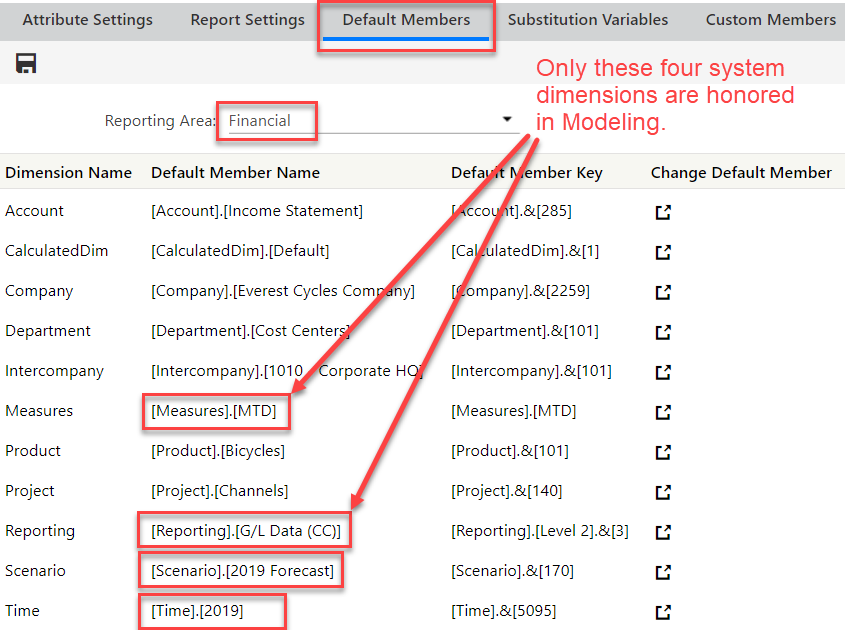
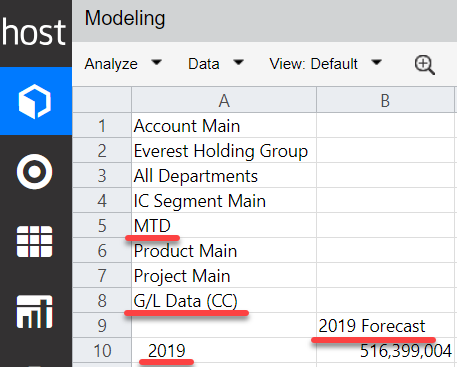
In this release, Modeling now honors PCR Default Members for the four system dimensions in new views (Time, Scenario, Reporting, and Measures). For example, 2019 can be defined as the default member in a Time dimension. Modeling will display the user-defined default dimension members when users create a Default View (Analyze Data) or New View (Design Data) in Views. This feature simply makes it faster to see the dimension members that you are most interested in when creating a new view.
This support applies to both Spotlight and SpotlightXL.
Login to PCR.
Select Maintenance, Reports, Cube Settings, Default Members.
Ensure that the Reporting Area is set to Financial.
For each dimension, select a default member to be displayed in your reports in PCR and new views in Modeling.
In Modeling, although you may have a default member selected for every dimension, only the four system dimensions are used.
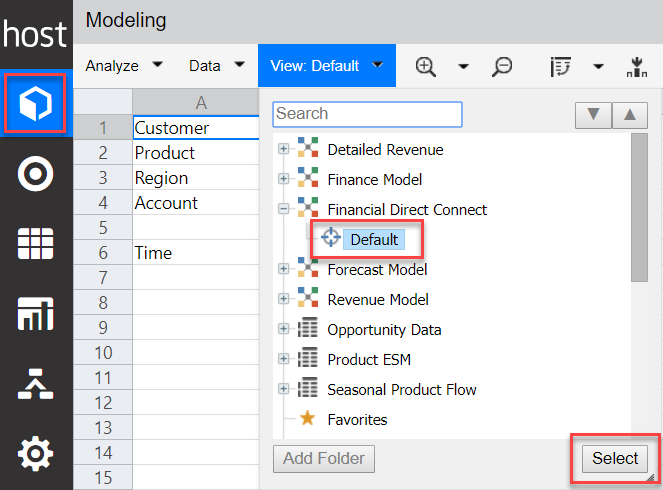
Select Analyze from the Modeling icon.
Select the Direct Access model from the drop-down, and the Default view.
When the Default view appears, notice that the four system dimensions show their Default members. The other dimensions show their root member.
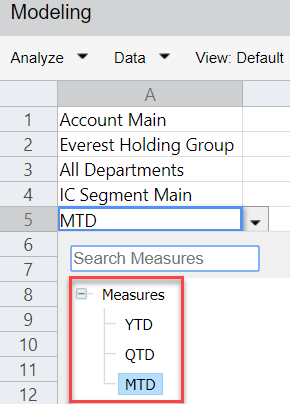
Note that default members do not limit visibility to the rest of the dimension. If you click on the dimension member, the rest of the dimension is still accessible.
Limitations
This support is only for models with Direct Access to PCR.
This support applies only to creating a new view. From Analyze Data, select the Default view. From Analyze Design, select New View. Default members are not honored in formatted reports or Excel Reports.
If there are existing views on the DAP model, Modeling assumes you laid out the view the way you wanted it and will not modify it to use the default members for any dimensions on the view.
This support applies only to the four system dimensions: Measures, Reporting, Scenario, and Time.
Modeling 2.8: External Source Model Improvements
This release includes the following improvements to External Source Model functionality:
Support for Loading Data into External Source Models using PCR Data Load Rules
Support for Exporting Data via the API - Was Released in January
Support for Loading Data into External Source Models using PCR Data Load Rules
In this release, we added support for loading data into External Source Models using the Data Load Rules feature in PCR.
Using External Source Models in the Data Load Rule Definition Screens
Example of Creating a Data Load Rule for an External Source Model
Quick Summary
This support is provided for customers who have updated the Modeling application to ESM 2.0, which was released in November 2018.
In PCR, External Source Model is now provided as a Load Item in Data Load Rules. When ESM is selected, all the ESMs are listed in the Load Sub-Item drop-down. These items are found in Maintenance, DLR, Data Load Rules.
This support is applicable to File, Web Services, and Copy/Paste Load Types. Existing Web Services APIs (Boomi), Load Data & Transfer Data are extended to External Source Models.
Data Integration User security for users and user groups is honored for ESM data load rules. If a user or group does not have access to a DLR, they will not see it in the grid.
ESM data loads support Comma & Dot for Thousand & Decimal separator, respectively.
The Number of Source Columns and their mappings are automatically updated in the Data Load Rule based on the external source model selected. A maximum of 100 columns can be loaded via Data Load Rule.
Formula and Constant type of fields are not included in the Data Load Rule because they are derived automatically during the data load.
Maximum of 4000 characters are allowed on each field when loaded via Data Load Rule.
We have also introduced the Include in Clear Data functionality with External Source Models. You can choose include or exclude specific fields and based on the clear data definition, any existing data in the model is cleared prior to loading the updated data.
The Data Load Audit Log is updated at the conclusion of the data load. Select Maintenance, Audit, Data Load Audit Log.
Details and Limitations
Data Manipulations in a Data Load Rule are currently not supported for External Source Models.
The Data Load Rule & the External Source Model are locked during the processing. The ESM cannot be updated/deleted, data cannot be loaded or moved from the same or any other Data Load Rule, and calculations cannot be triggered on a locked model. Similarly the Data Load Rule cannot be updated or deleted while it is locked.
A data integrity check happens prior to the actual data load and in case of any exceptions, the data load is aborted.
Existing Web Services APIs (Boomi) viz., Load Data & Transfer Data are extended to External Source Models.
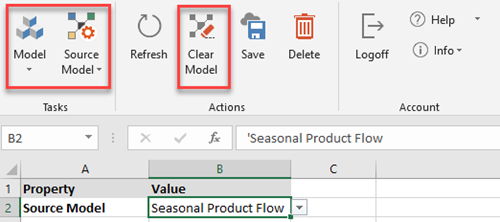
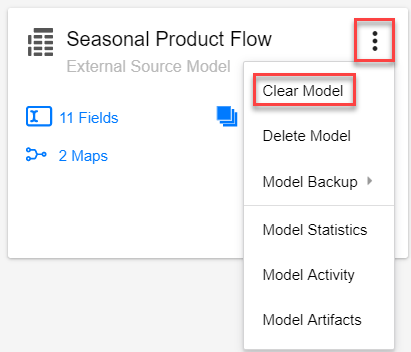
Clear Data on the Data Load Rules screen is currently not supported for External Source Models. Use the Clear Model menu command from the specific ESM in Model Manager, or use SpotlightXL to clear all the data in an External Source Model.
Best Practice Recommendations
We recommend to use only one DLR per ESM. Loading data to an ESM via multiple DLR’s should be avoided.
If the admin would like to reload the data by clearing all the data in the ESM then we would recommend leveraging the Clear Model functionality for the specific ESM from Model Manager or from SpotlightXL.
Loading data via DLR is not supported if the Modeling application is not integrated with PCR application. Please contact Host Analytics support for additional info on this.
Using External Source Models in the Data Load Rule Definition Screens
To create a new Data Load Rule for an ESM, you must have an already existing external source model.
In PCR, select Maintenance, DLR, Data Load Rules.
New Data Load Rule:
Click New Data Load Rule.
Select a Load Type: File Load, Web Services, or Copy/Paste.
Select the Load Item: External Source Model.
Under Load Sub Item, select the name of the ESM.
Select Sample Input File:
If you are loading from a file, specify its file type.
Select the file under File Information.
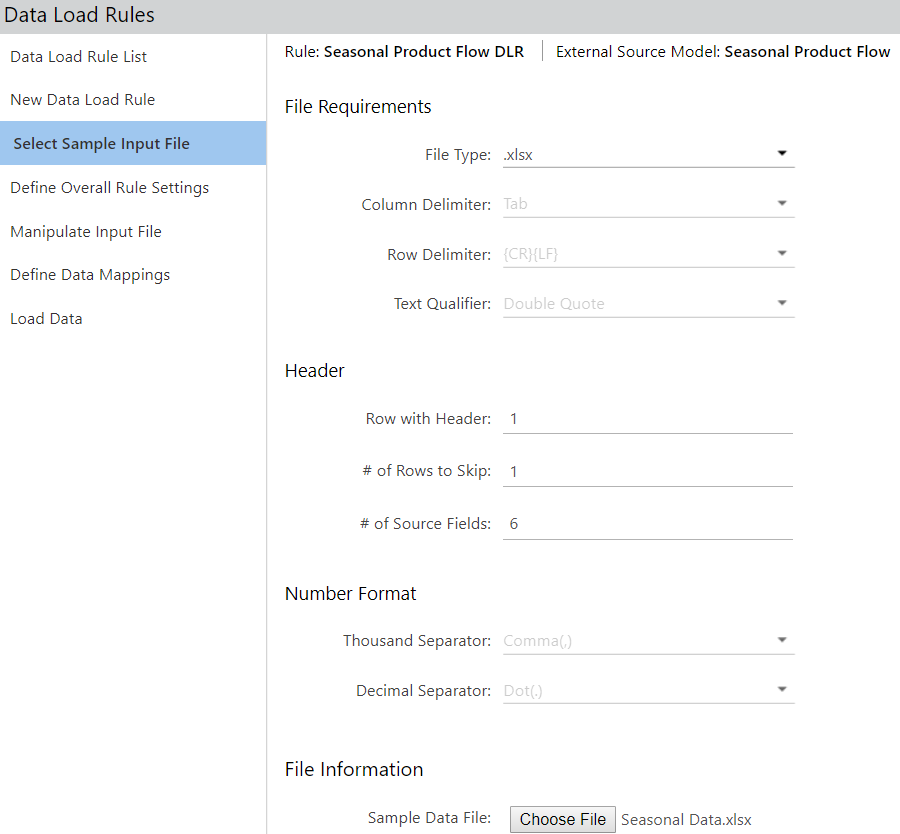
Notice that the Header section is pre-populated with information about your external source model and the number of fields it expects.
Define Overall Rule Settings:
The DLR populates this screen with the fields in the ESM that are not formulas or constants. (ESM fields of type Formula and Constant are not displayed in the DLR mappings and they cannot be loaded as source data. Instead they are derived automatically during the data load.)
Use the Include in Clear Data column to choose how you want the DLR to handle clearing the existing data and loading the new data. In previous releases, using the Copy and Paste functionality in SpotlightXL, the system always cleared all existing data before loading the new data. With the Include in Clear Data, you can customize which data combinations should be cleared.
For example, if you check Season and Product Type, you will clear the data for all the Seasons and Product Types that you supply in your data load file. It will not clear all combinations of Seasons and Product Types unless your data load file includes data for all combinations of Seasons and Product Types.

If you leave everything unchecked, the system will retain everything in your ESM and append the additional data in your load file.
For Clear Data use cases, see Examples of Include in Clear Data Loads.

If you want to clear all data prior to the load, use the Clear Model command from SpotlightXL External Source Model menu, or Clear Model from the More menu in Model Manager.
 |  |
Manipulate Input File:
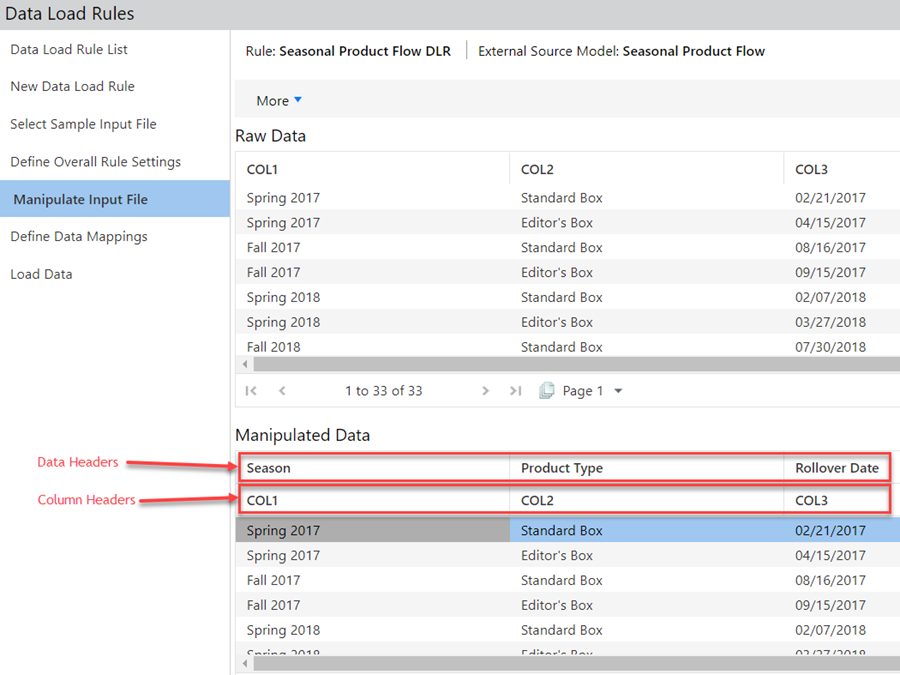
This screen pulls in the data from the load file and displays it as Raw Data and Manipulated Data. Click More to see the manipulations available. Note that the Raw Data contains only the input fields. Formula Fields are not shown.
Define Data Mappings:
This screen lets you map columns from the load file to field names in the External Source Model.
As a best practice, label the header row of your load file to match the input fields in the External Source Model.
Use the drop-downs under Maps To in order to set the mappings.
Click Next.
Load Data:
This screen asks you to select the load file and confirm that you want to load the data now.
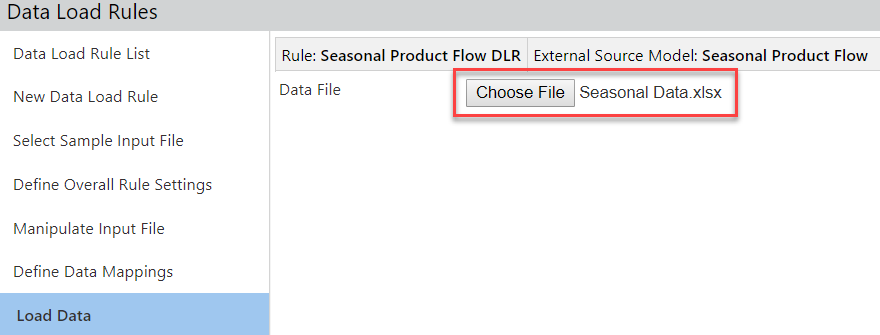
Click Choose File to select the load file.
Click Finish.
The Data Load Status appears.
Example of Creating a Data Load Rule for an External Source Model
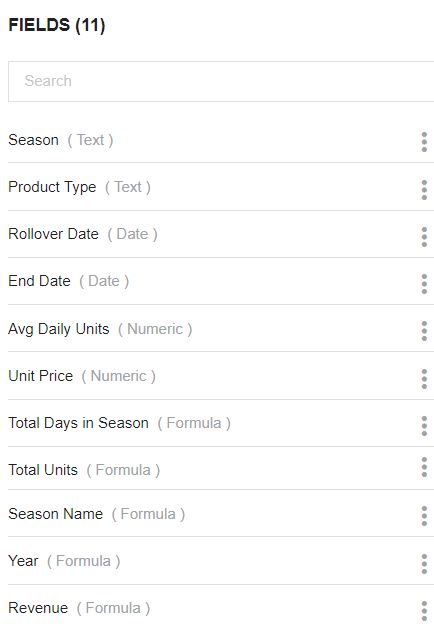
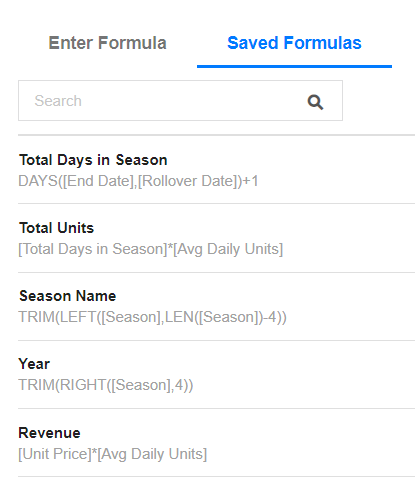
The external source model called Seasonal Product Flow contains 11 fields: 6 input fields and 5 formula fields. We will use Data Load Rules to load data into the fields required by the formulas.
 |  |
In PCR, select Maintenance, DLR, Data Load Rules.
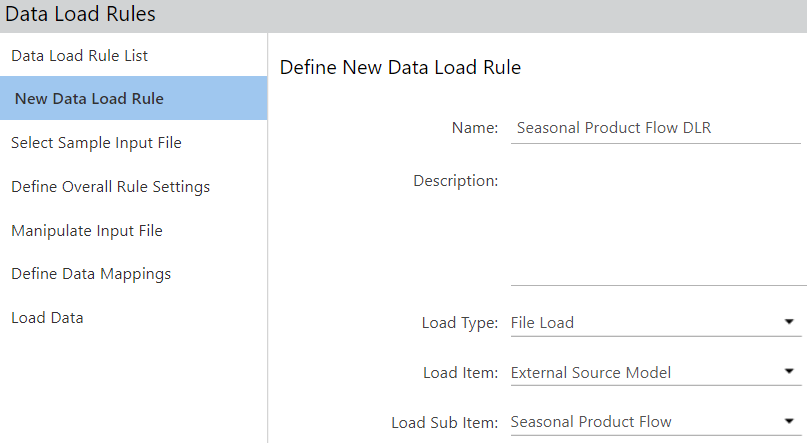
Click New Data Load rules and make the following selections.
For Select Sample Input File, specify the file type, Header information, and Sample Data File.
For Define Overall Rule Settings, click the checkbox for Include in Clear Data for Season and Product Type.

For Manipulate Input File, click More to see options which clarify what you are seeing on the screen. Click Data Headers to pull in the names of the columns from your load file.

For Define Data Mappings, select the field names in the ESM that map to the columns in the load file. If you selected Data Headers on the previous screen, they appear in the Source Column.

For Load Data, click Choose File to select the data load file.
Click Finish to load the data.
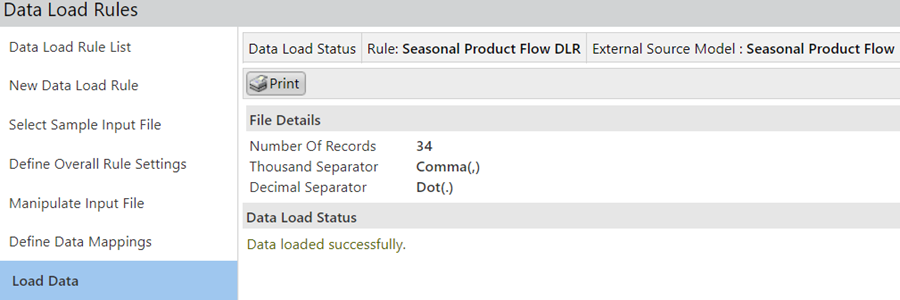
After loading the data, the formula fields in the external source model are calculated and populated.
Examples of Include in Clear Data Loads
Here are some examples of what happens with your existing data when you load new data into an External Source Model, using the Include in Clear Data checkboxes on the Define Overall Rule Settings section of the Data Load Rule.
Before the data load, here is the existing data.

Here the new data to be loaded.

Example 1: Include in Clear Data is checked for the Department column
When the Department field is checked, the DLR examines the new data load file to see which Departments are in it. In this case, the load file uses only one department: FIN. All data in the existing ESM with Department FIN is then cleared before the new data is loaded.
The resulting data is as follows.

Example 2: Include in Clear Data is checked for the Department and Company columns
When the Department and Company fields are checked, the DLR examines the new data load file to see which combinations of Department and Company are in it. In this case, the load file uses the following combinations: 1010 FIN. All data in the existing ESM with Company 1010 and Department FIN is then cleared before the new data is loaded.
The resulting data is as follows.

Example 3: Include in Clear Data is checked for all columns
When all fields are checked, the DLR examines the new data load file to see which fields have common values amongst all the rows. In this case, the load file has two rows, and the fields that have the same value for both rows are: Company, Department, Product, Project, Intercompany, Scenario, Fiscal Year, and Fiscal Month.

Thus any data in the existing ESM with the same values as the common values in the load file is cleared.
Company: 1010
Department: FIN
Product: Default
Project: Default
Intercompany: Default
Scenario: Actual
Fiscal Year: 18
Fiscal Month: 1
One record is found that matches the criteria. It is cleared.

Then the two new records are loaded. The resulting data is as follows.

Support for DimensionFilter in External Source Model Maps
In this release, we are adding support for a mapping type of DimensionFilter in External Source Model maps. ESM maps are used for being able to copy data from an ESM to a Master model. The DimensionFilter map type is useful for identifying how to map external source models to Master models in situations where there is not a one-to-one mapping between fields and dimensions. Master models may have more dimensions than fields in the ESM, but all dimensions in the Master model must be represented in the map.
For example, assume you have an external source model with three fields: Company, Department, Account; and you have a Master model with four dimensions: Company, Department, Account, Time. Since the Time dimension is not available in the external source model, you can still map the ESM to the Master model by using the DimensionFilter map type to identify which leaf-level member of the Time dimension all the data in the ESM relates to.
In previous releases, to load data into a Master model, you had to create dummy fields of type Constant in the ESM so that every dimension was represented.
To use DimensionFilter:
Open the external source model map.
Identify which dimensions are not represented in your external source model.
In a blank row in the map, select the dimension in the Target Dimension column. You can use the drop-down.
In the Target Member column, type the name of the leaf-level member that all data in the ESM relates to. (In this release, you must type in the member name because the drop-down is not yet available.)
Select DimensionFilter in the Maps To column.
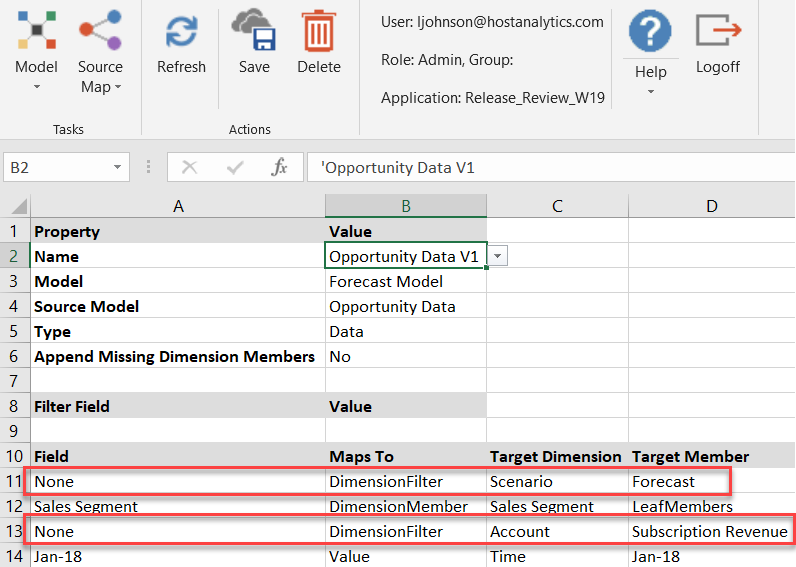
- When using DimensionFilter, there can be only one row in the map for that Target Dimension. Data that is copied will be associated only with that particular Target Dimension and Target Leaf-Level Member.
- Migration: If you have already created ESM Maps that specify a Constant field mapped to dummy column(s) in the source data, you can remove those columns or fields and change the Constant field(s) to DimensionFilter row(s) in the map.
Support for Backup and Restore of External Source Models
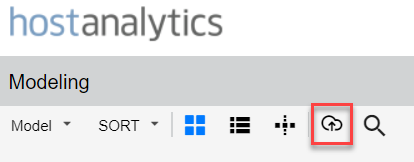
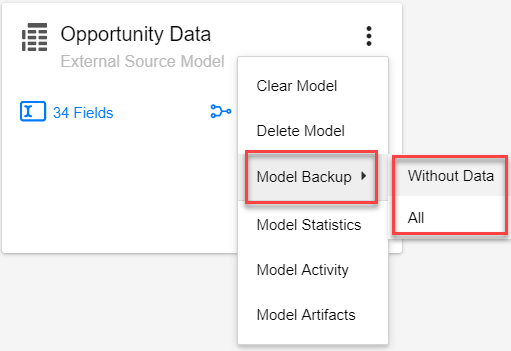
In this release, you can now Back up and Restore External Source Models and their artifacts. The Model Backup menu item is available only to Administrator users and can be found on the More menu of the External Source Models listed in Model Manager. The Model Restore icon is on the menu ribbon and is available only to Administrator users.
This feature is available only in Spotlight on the Web.
All backup and restore operations are recorded in the Audit Log.
You can back up the ESM two ways:
Without Data: backs up the model metadata, ESM model definition including fields and formulas, ESM maps, and view artifacts.
All: backs up the same items as Without Data and also backs up all of the data. If you do not have the option to backup All, then you need to request Backup Data to be enabled on your application.
Modeling creates a .ZIP file and saves it to the Downloads folder locally. The maximum size of the .ZIP file is 200MB or as configured for your application.
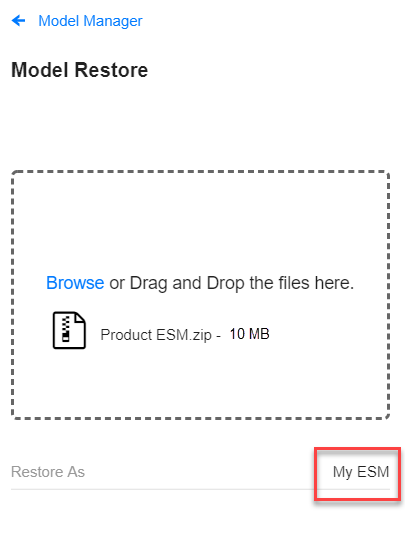
As with analytic and master models, you can restore the model as is or restore it with a different name. Restore is available on the menu ribbon. It restores all related artifacts and creates the external source model. The ESM will be in a generated state.
