- 17 Minutes to read
- Print
- DarkLight
- PDF
Winter21 Release Notes
- 17 Minutes to read
- Print
- DarkLight
- PDF
Structured Planning: Copy Option in Compensation Items Window
Now, in the Workforce Planning Setup > Compensation Items window, a new Copy option has been added. You can use the new option to copy any existing Compensation item and add a new Compensation item.
The following image shows the Copy option in the toolbar of the Compensation Items window.

How does the functionality work
When you copy any Compensation item and add a new Compensation item, all details available in the original Compensation item, such as Compensation Group, Account, and so on are automatically copied to the new Compensation item.
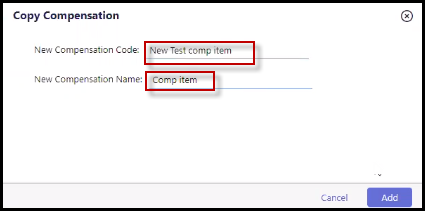
While copying any Compensation item, you can specify the required New Compensation Code and New Compensation Name in the Copy Compensation pop-up window. By default, the value for the New Compensation Code field is copy_code and for the New Compensation Name field it is copy_name.
You can copy all the 14 Basis available to create Compensation items using the new Copy option.
For example, if you copy the Allowance compensation item and specify Target Allowance as the value for New Compensation Code and New Compensation Name fields in the Copy Compensation pop-up window, then a new Compensation item named Target Allowance is added to the Compensation Items list. The Target Allowance compensation item will contain the same information available in the Allowance Compensation item.
Business Value
This functionality provides you the flexibility and ease of copying an existing compensation item’s data with just one click. You can conveniently use the data from any existing Compensation item and quickly create a new Compensation item; thereby significantly reducing the time and effort required previously to create a new Compensation item.
In Practice: Selecting the Copy Option
Go to Maintenance > Workforce Planning Setup, and then click the Compensation Items tab.
Select a Compensation item and click Copy.
In the Copy Compensation pop-up, enter the New Compensation Code and New Compensation Name and click Add. A message is displayed once the new compensation item is successfully copied.
Dynamic Planning: Change Constant Field Values without Clearing External Source Model Data
In SpotlightXL, you can now directly change values for the Constant fields available in the External Source Model (ESM) without clearing the model data. For example, if you have four constant fields along with other fields in your ESM and you want to change the values for two Constant fields, then you can directly change the values in the Expression column for these constant fields without clearing the model. You can view all the updated values in the Constant fields in SourceDataLoad.
In addition, with this new functionality, you can view all the changes made to the Constant fields and Formula fields in the Audit Log, thereby easily tracking all changes made to the model data at one place.
Let us take the following example to understand the details.
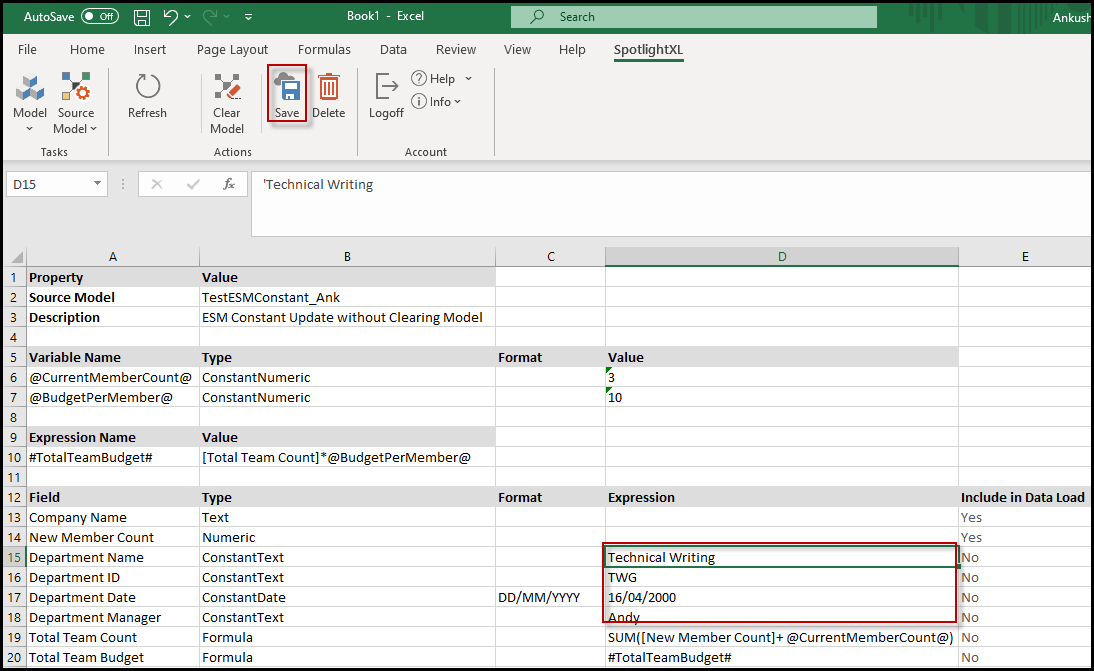
In any Source Model containing fields of ConstantText, ConstantNumeric, ConstantDate type, you can change the existing cell values with new values. For example, in the following image, you have a Source Model containing
Department Name, Department ID, Department Date, and Department Manager fields that are of type ConstantText, ConstantNumeric, ConstantDate, and ConstantText respectively.
Now, with this new functionality, you can change the value of any Constant fields based on your requirement and update the fields with new values.
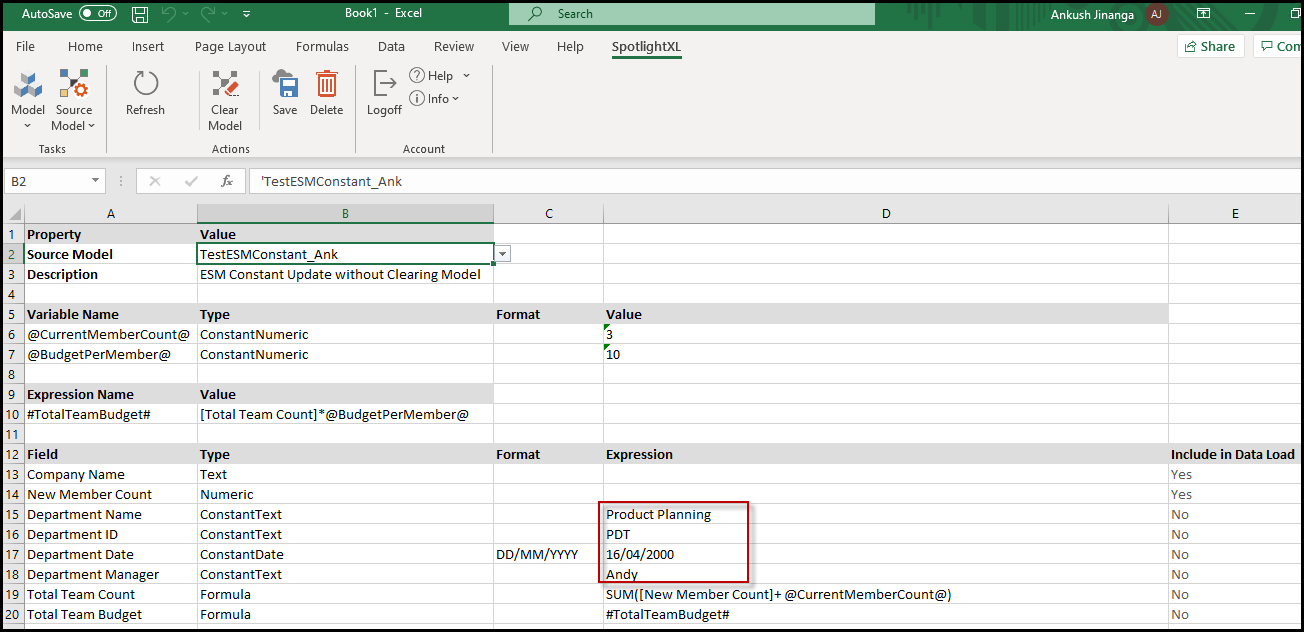
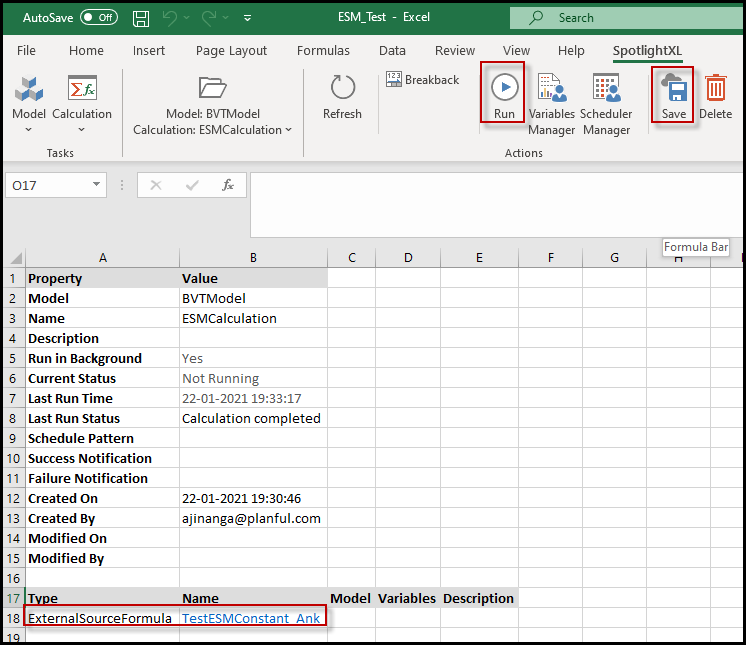
Once you change the required values in your source model, you can create a new calculation for your ESM and run the calculation to view the changes in the Source Data Load page.
While creating a new calculation, you must select ExternalSourceFormula as the value in the Type column and select your source model as the value in the Name column. After creating the new calculation, you must Save and Run it.
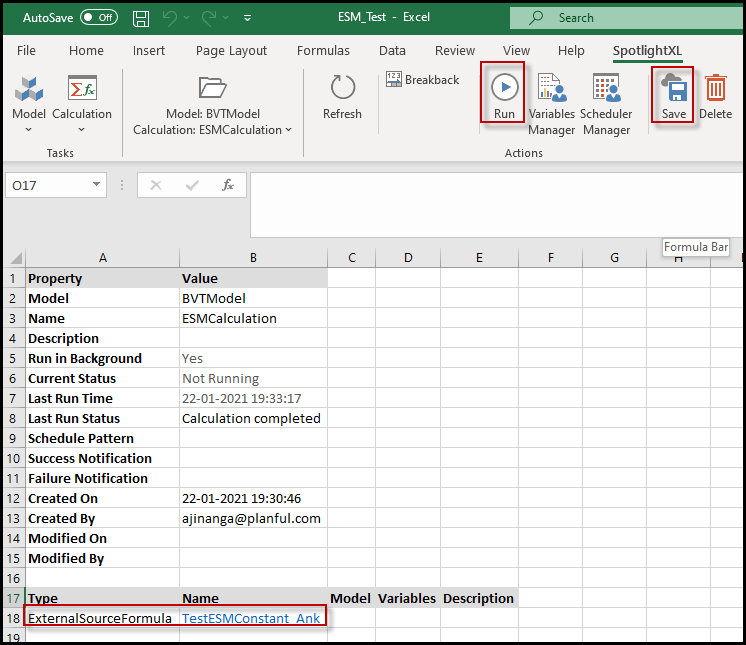
Once you run the calculation, to verify the updated values you can navigate to the Source Data Load page. You can view all the new values updated for the Constant fields in the Source Data Load page when you enter values in the respective Data Load fields, and click Refresh.
You can also view all the new values updated for the Constant fields in the Source Data Load page without creating a calculation. You can click the Load Data option and then click Refresh to view the updated values.
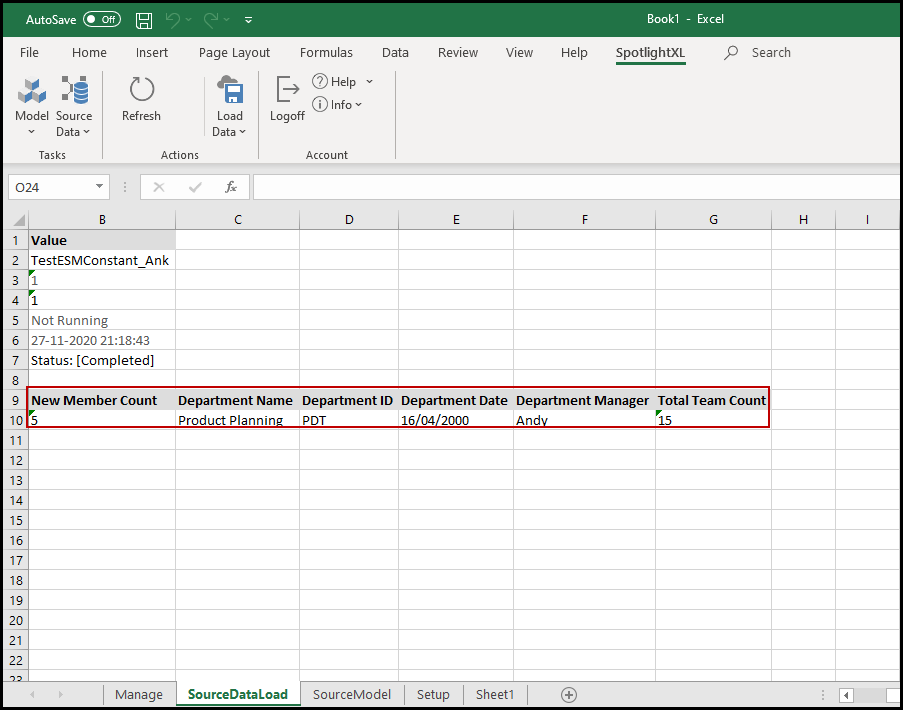
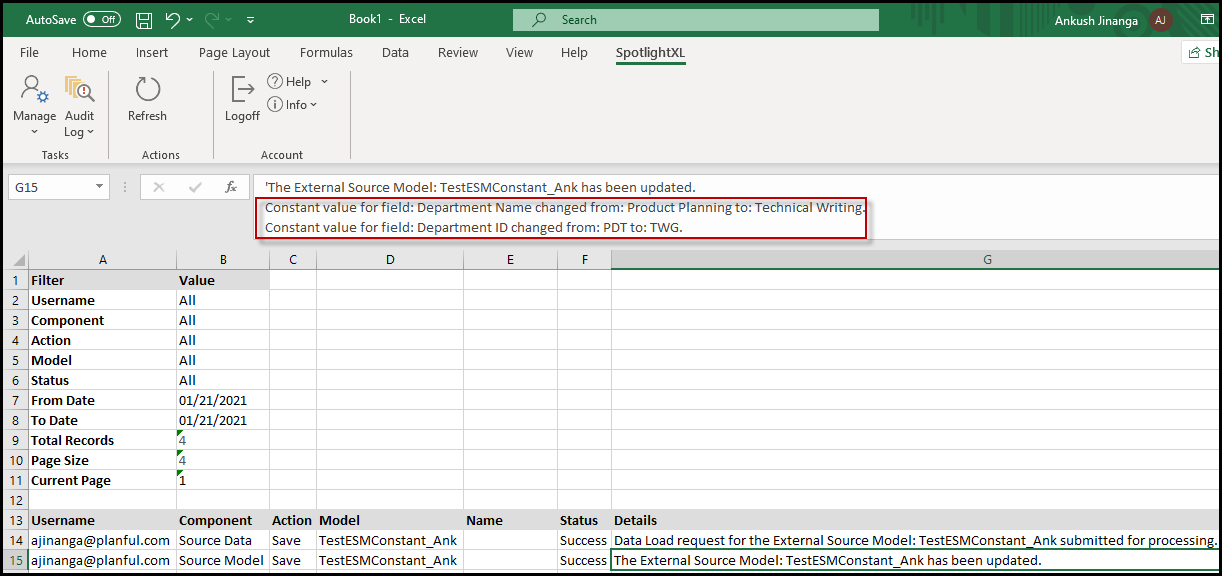
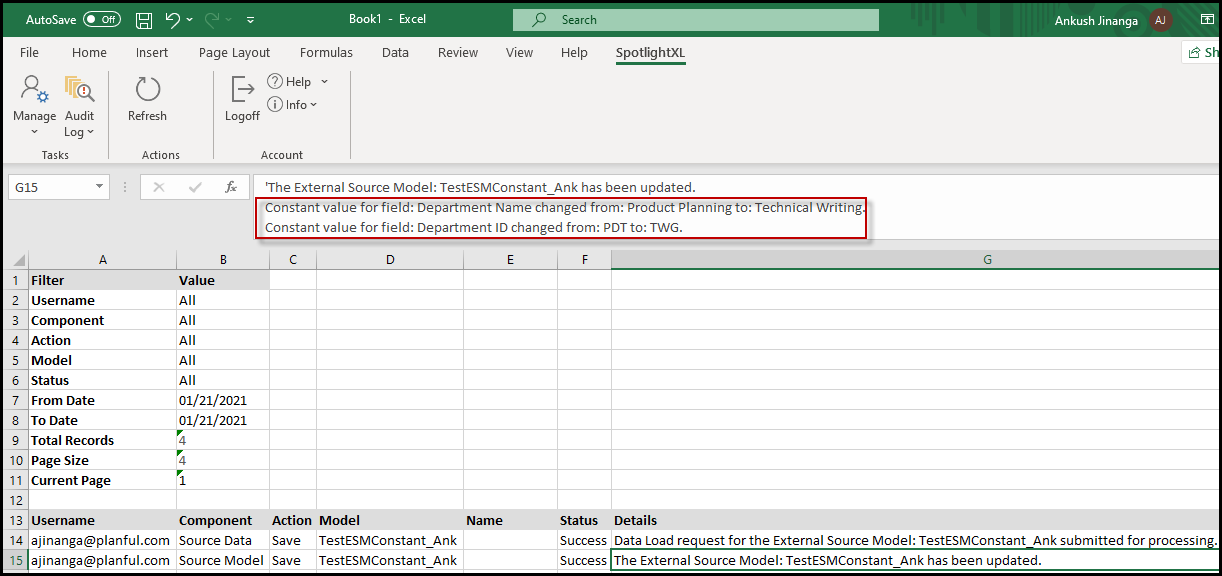
Whenever you update any value for the Constant fields, you can track all the changes made to your model in the Audit log as shown in the image below.
Business Value
This functionality provides you the ability to quickly change the values of your Constant fields on the go, thereby remarkably reducing the time consumed previously to update the values for the same fields after clearing the model. In addition, this functionality provides you an option to view every single update made to your external source model data at one place in the Audit log.
Prior to this release, you did not have any option to change the values of your Constant fields without clearing the source model.
In Practice: Change Constant Field Values in the External Source Model Page
In SpotlightXL, select the Model task and the External Source Model > Source Model subtask.
Select a model and navigate to the available Constant fields.
Select a Constant field and enter a new value in the Expression column.
Note:You can update values in the Expression column for multiple Constant fields.Click Save.
In Practice: Create a new Calculation for your ESM
In SpotlightXL, select the Model task and the Source Model > Calculation subtask.
Select any model and specify the required calculation name in the Name field.
In the Type column, select ExternalSourceFormula from the drop-down list.
In the Name column, select your source model name from the drop-down list.
Click Save, and then click Run.
In Practice: Verify Changes to Constant Fields in the Source Data Load page
In SpotlightXL, select the Model task and the External Source Model > Source Data subtask.
Enter required values in the Data Load fields and click Refresh.
Note:If you have not created a calculation for your ESM, then you can click the Load Data option, and then click Refresh to view the updated values.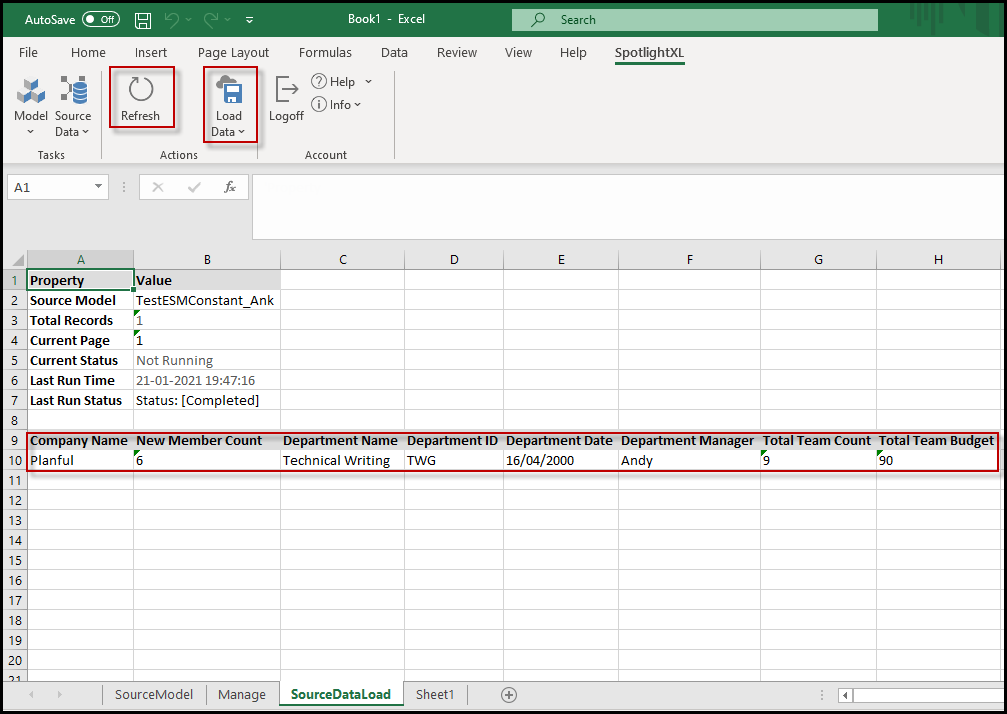
In Practice: Track Changes Made to the Model
In SpotlightXL, select Manage > Application Administration > Audit Log.
Click the required cell in the Details column and navigate to the formula bar.
Verify all the changes made to the values of the Constant fields.
Limitations
You cannot add new rows to the existing model or delete existing rows without clearing the model.
You cannot change the Field column values from the existing model without clearing the model.
Dynamic Planning: View Formula in External Source Model
Now, in your External Source Model data, you will be able to view the formula associated with a calculation at a cell intersection in the formula bar of Spotlight Web and SpotlightXL. If your External Source Model data has formula in the form of an expression, you can view the resolved formula associated with that expression in the formula bar.
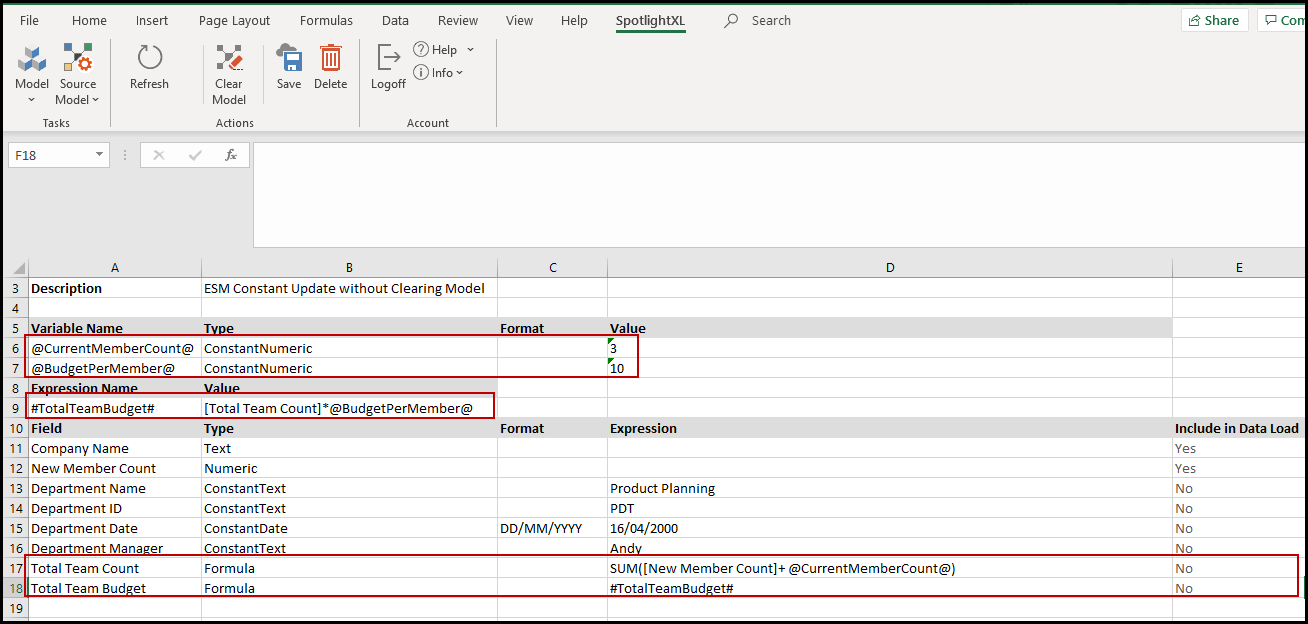
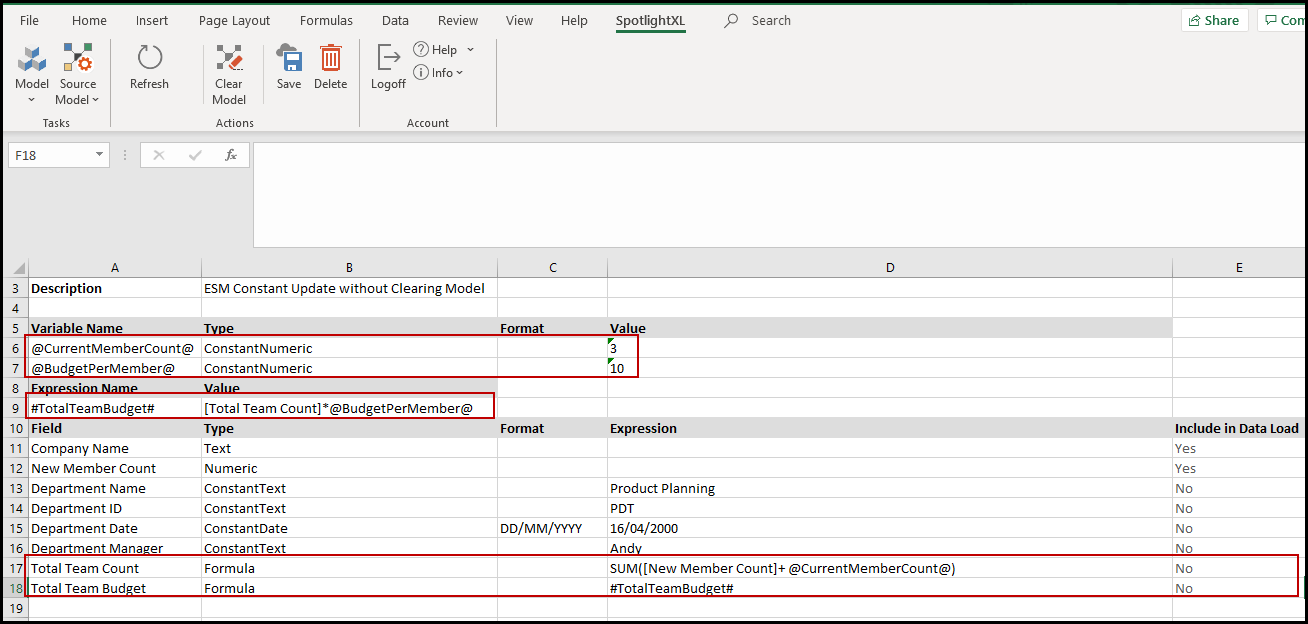
Let us take the following example to understand the details. In any Source Model containing a formula or a formula with an expression, you can view the complete formula in the formula bar of Spotlight Web or SpotlightXL. For example, in the following image, you can see two formulas configured for the ESM model, Total Team Count and Total Team Budget, where Total Team Count is using a variable “@CurrentMemberCount@” in the formula, while Total Team Budget has an expression “#TotalTeamBudget#” associated with it.
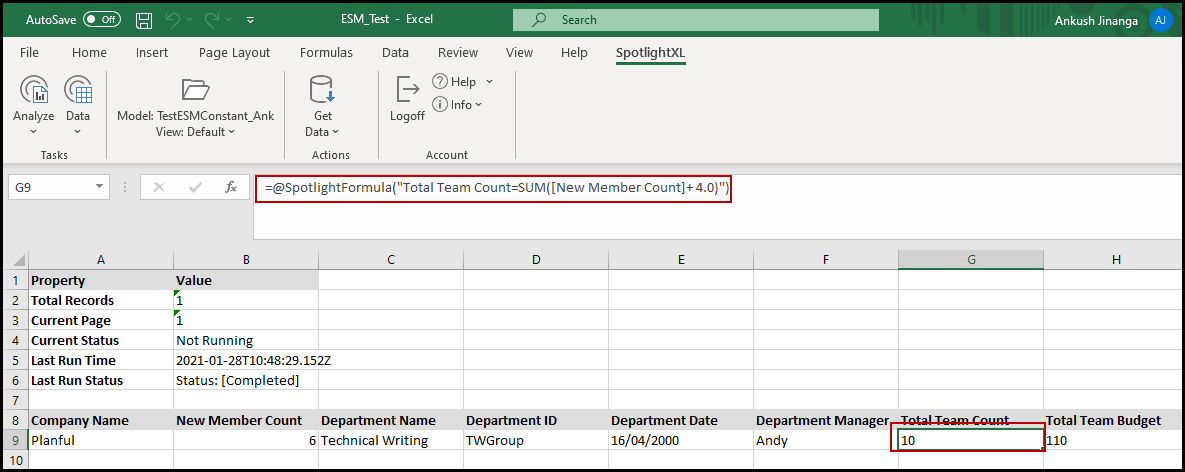
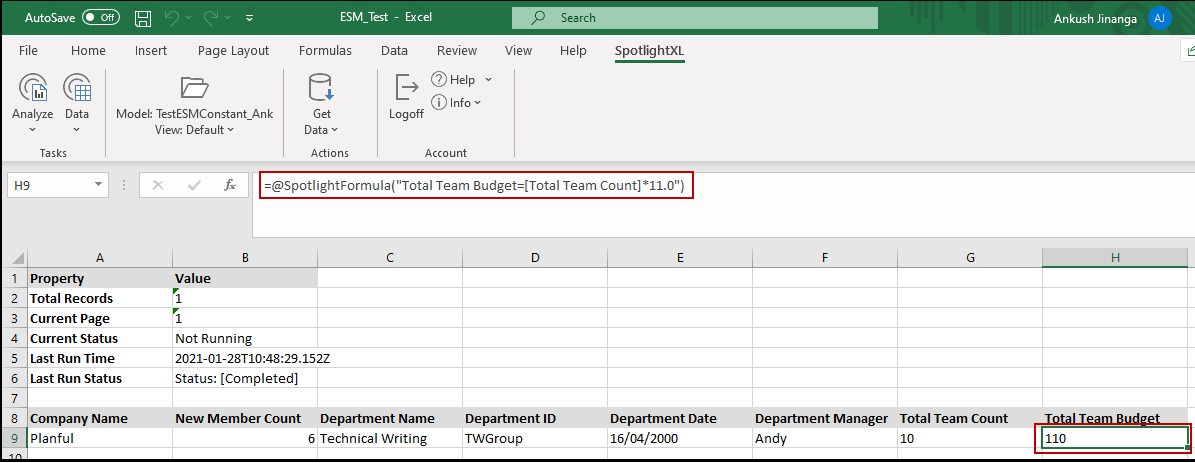
Now with this new functionality, when you view this ESM model in the Spotlight Web or SpotlightXL, you can view the complete formula details including the resolved variable for Total Team Count in the formula bar as shown in the image below.

The following is the image in SpotlightXL.
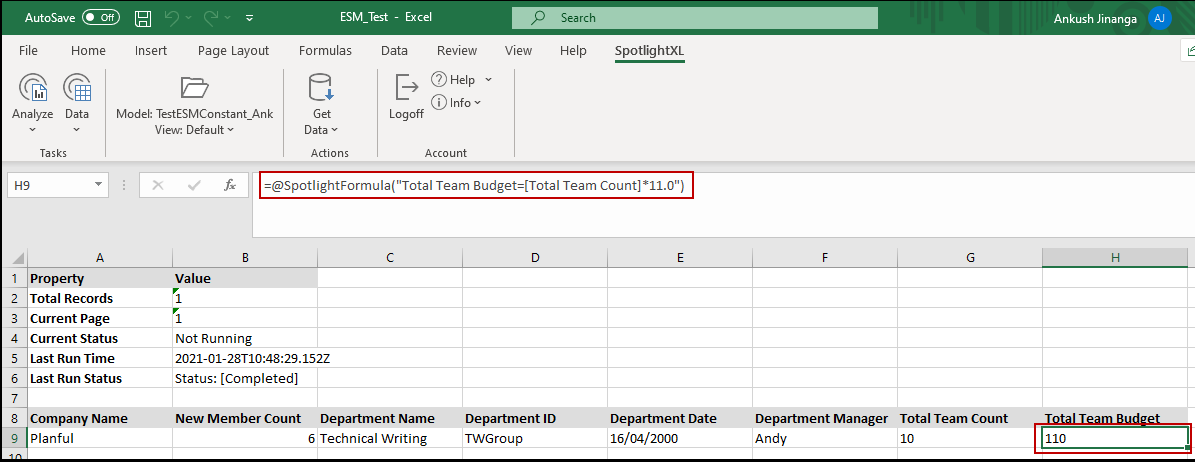
Similarly, for Total Team Budget, the application validates the value configured for the #TotalTeamBudget# expression and displays the complete formula including the resolved expression in the formula bar instead of the expression name as you can see in the image below.

The following is the image in SpotlightXL.
Business Value
This functionality provides you the flexibility and ease of viewing a formula defined within the calculation directly in the formula bar of Spotlight Web and SpotlightXL. You can conveniently view a formula on the go while you are working on any External Source Model. This functionality significantly saves time and reduces the effort previously required to understand how a value at a cell intersection is being calculated.
Prior to this release, you did not have an option to view how a value at any particular cell intersection was calculated.
In Practice: Verify Formula Fields in the External Source Model Page
In SpotlightXL, select the Model task and the External Source Model > Source Model subtask.
Select a model and navigate to the available Formula fields.
Verify the formula details in the Expression column. For example, variables, expression, and individual formula.
In Practice: Validate Formula in the Formula Bar
In Spotlight Web or SpotlightXL, select a View and navigate to any cell intersection that has a calculation associated with it.
View the formula in the formula bar.
Limitations
If the Enable Save property is set to Yes and the Calculation on Save property is configured with a calculation, then the formula configured in the calculation will be displayed in the formula bar. For any other calculation where the Enable Save property is not set to Yes, then the formula will not be displayed.
If the Enable Save property is set to Yes and the Calculation on Save property is configured with a calculation. Still, if the application runs a different calculation, then the formula displayed in the formula bar and the formula configured in the calculation will not match.
If multiple formulas are configured for any intersection, then the application will display only one formula in the formula bar.
The way in which the formula is displayed in the SpotlightXL varies slightly with the way in which it is displayed in the Spotlight Web. The formula in the SpotlightXL starts with an additional =@SpotlightFormula in SpotlightXL.
Dynamic Planning: Update to the SpotlightXL Add-In
If you have automated installation for SpotlightXL, then there is nothing you need to do as the update will be done automatically.
If you manually install SpotlightXL and related updates, then you must access the Installation Guide and download the latest update.
Spotlight Reporting: Repeat Outer Dimension Members Automatically in Cascade Reports
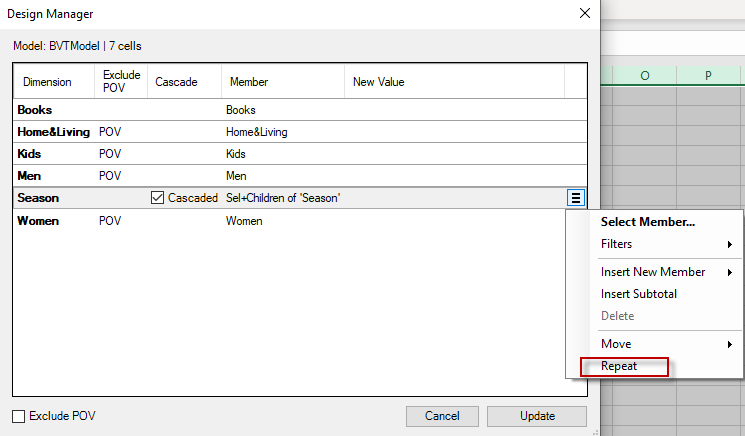
In SpotlightXL, you can now repeat outer dimension members automatically in cascade reports by selecting the new Repeat option available in the Selection menu.
When you select the Repeat option while creating a Cascade report, you can view the outer dimension members repeating automatically for all inner dimension members.
The following image shows the new Repeat option:
Let us take the following example to understand the details.
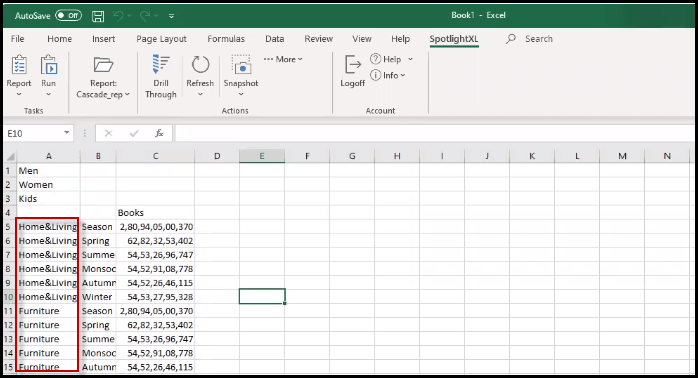
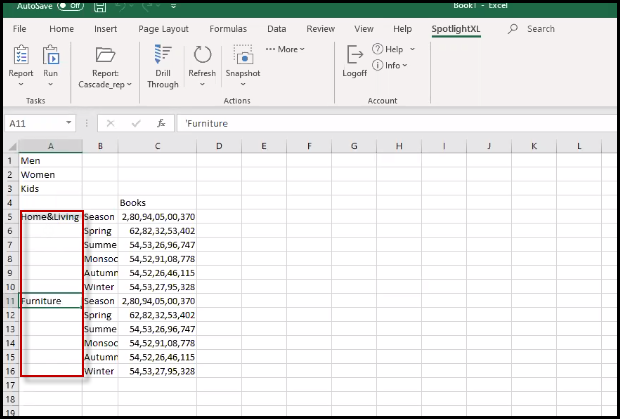
Suppose you have a Report containing 2 dimensions on rows(ex:- Furniture_Type and Season dimensions). Home & Living and Furniture as outer dimension members and different Seasons as inner dimension members. For this report, when you create a cascade report and select the Repeat option, then the outer dimension members, Home & Living, and Furniture, will repeat automatically for all inner dimension members.
The image below shows the outer dimension members repeating themselves for all inner dimension members:
Prior to this change, you had to copy all outer dimension members for the inner dimension members as shown in the image below.
Business Value
This functionality provides you the capability to automatically update outer dimension members for all inner dimension members in a cascade report with just one click, thereby significantly reducing the time and effort required previously to update outer dimension members by copying them manually. In addition, this functionality provides enhanced user experience and flexibility to view the necessary data quickly.
In Practice: Selecting the Repeat Option
In SpotlightXL, select the Analyze task and the Data subtask.
Select the View.
Select Design With > Report.
Select the entire spreadsheet as shown below.
Note:It is important when using Cascade Reports to select the entire spreadsheet before selecting the Design Manager to ensure the dimensions are represented correctly if the cascade option is used.Select all cells in the report.
Click Design Manager.
For the dimension that you want to use Cascade, click the Cascade check box.
On the Cascaded dimension, click the Selection icon and select Repeat.
Spotlight Reporting: Delete a Member from Cascade Report and Re-Add
In SpotlightXL, when you delete any member from a cascade report, you can now add the same member back to the report. When you add a deleted member back to the report, you have the Cascade check box available in the Design Manager window.
Prior to this change, you were not able to add a deleted member back to a cascade report.
Let us take the following example to understand the details.
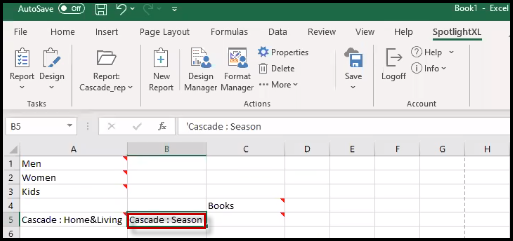
Suppose you have a cascade report containing Home & Living and Season as dimension members as shown in the image below.
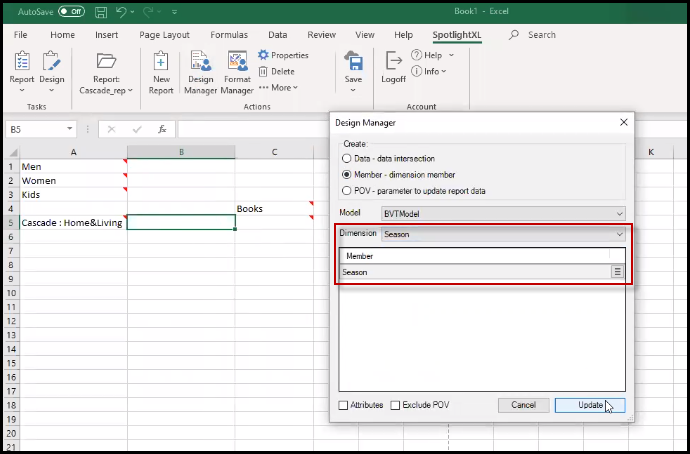
For this report, you can delete the Season dimension member and add this member back to the report as shown in the image below.
While generating the report, you will have the Cascade check box available in the Design Manager window for the re-added member as shown in the image below.
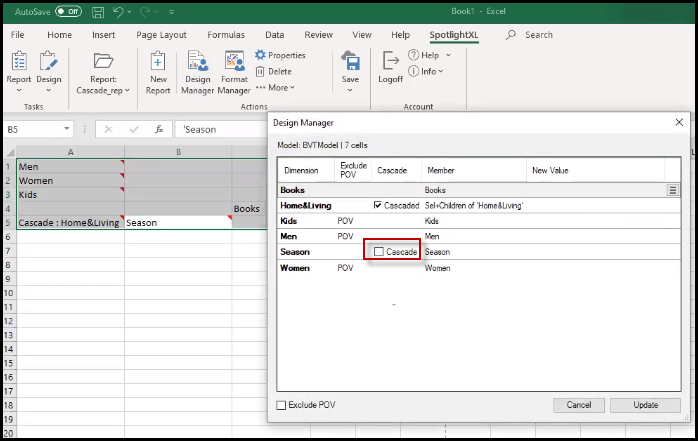
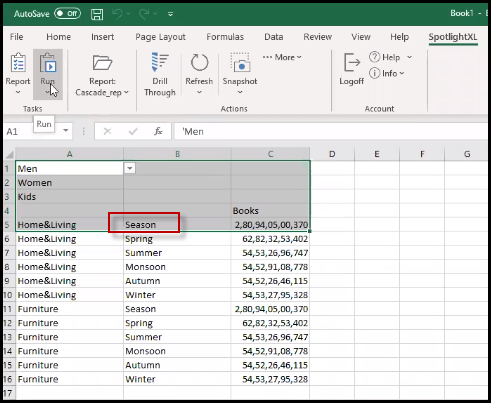
You can select the Cascade check box for the Season dimension member and generate the cascade report.
The following image shows the generated cascade report:
Business Value
This functionality now resolves the issue of not being able to re-add a deleted dimension to the cascade report.
In Practice: Adding a Deleted Dimension Member to the Cascade Report
In SpotlightXL, select the Analyze task and the Data subtask.
Select the required view.
Select Design With > Report.
Delete the required dimension member.
Click Design Manager, select the dimension member to add, and click Update.
Select the entire spreadsheet.
For the added dimension, click the Cascade check box and click Update.
Run the report.
Spotlight Reporting: Delete Blank Rows or Rows with Zeros from a Cascade Report
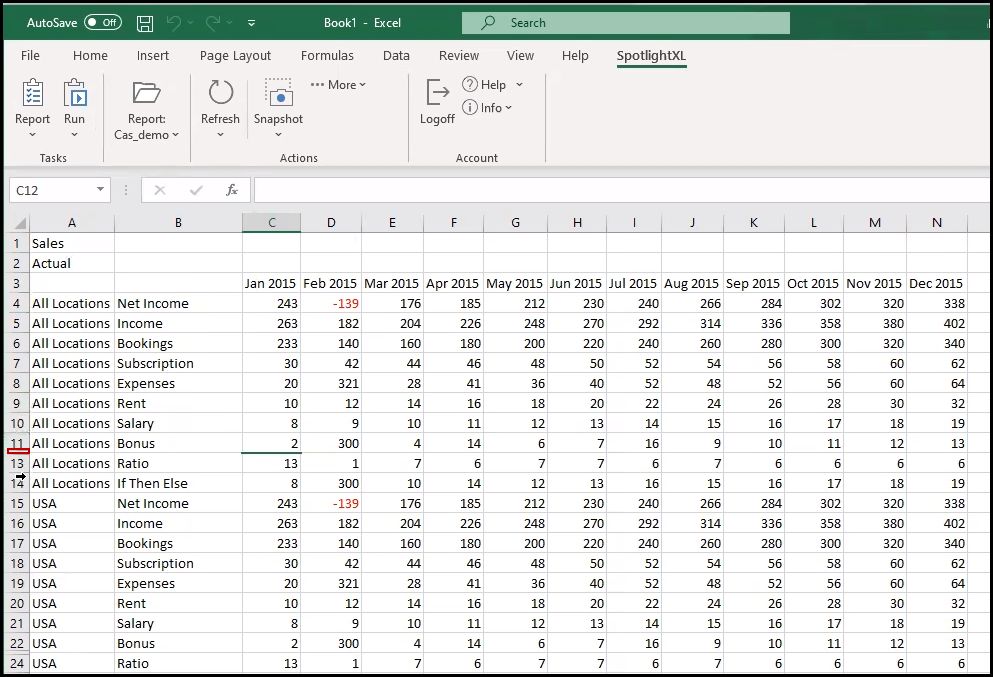
Now, in a Cascade report, when you Suppress Rows with blanks or zeros and run it, all the blank rows and rows containing zeros will be deleted.
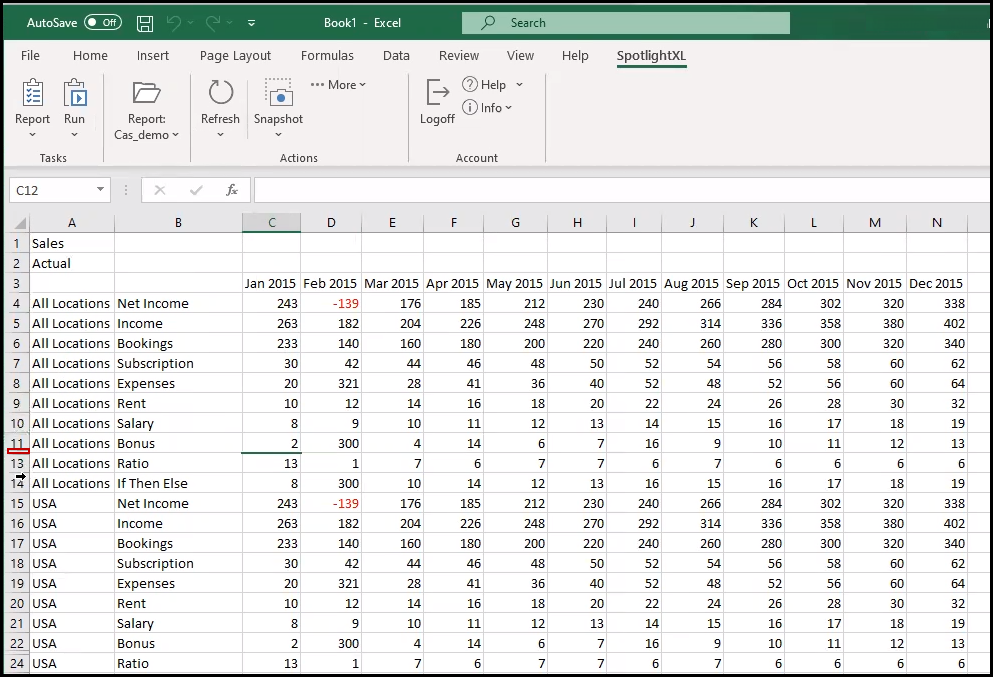
Previously, when you Suppressed Rows with blanks or zeros and ran the cascade report, all the blank rows and rows containing zeros were hidden but not deleted, as shown in the image below. For example, in the image below, the empty row 12 was not deleted but was only hidden.
For example, if your cascade report has a blank row 12 and you run the report after selecting “Blank” as the value for the Suppress Rows property, then row 12 will be deleted, and the rows below it will be moved up by one place, instead of hiding the row 12.
Business Value
This functionality improves the usability of a cascade report by providing you the capability to automatically delete blank rows or rows with zeros instead of hiding the suppressed rows. In addition, this functionality provides enhanced user experience and flexibility to view all the rows accurately, instead of incorrectly numbered rows due to the hidden rows.
Spotlight Reporting: Retain Member Selection in Alternative Hierarchies
In the Analyze task, if you have common members in your Product Main Hierarchy and Alternative Hierarchy; and you click Get Data after selecting the common member from Alternative Hierarchy, the Search Account member drop-down menu shows the Alternative Hierarchy member as the selected member.
For example, if you have “Net Income” as a common member in your Product Main Hierarchy and Alternative Hierarchy, and you select “Net Income” from your Alternative Hierarchy. When you click Get Data, the Search Account member drop-down menu shows the member selected as “Net Income” from the Alternative Hierarchy. The image below shows the details.
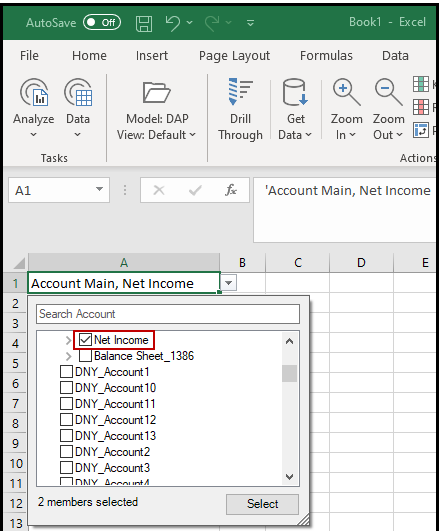
Previously, irrespective of the member selected from the Alternative Hierarchy, the Search Account member drop-down menu displayed the member selected as the Product Main Hierarchy member.
Business Value
This functionality now improves the usability of Account member selection and resolves the issue of not being able to view the correct member selected from the Alternative Hierarchy in the Search Account member drop-down menu.
In Practice: Selecting a Common Member from Alternative Hierarchy
In SpotlightXL, select the Analyze task and the Data subtask.
Select the required View.
From the Search Account drop-down menu, navigate to the required Alternative Hierarchy.
Select the member common to Product Main Hierarchy and Alternative Hierarchy.
Click Get Data and navigate back to the Search Account drop-down menu.
Dashboards: Extended the Reporting Administrator Functionality to Dashboards
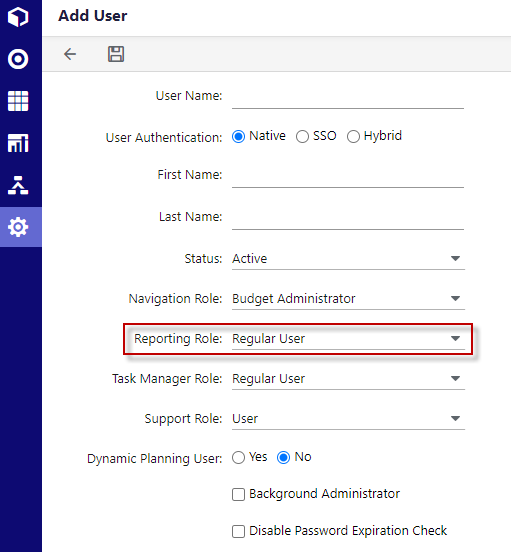
Now, in the User and Role Management > Add User window, if the Reporting Role is Reporting Administrator, you can access all the Dashboards (existing and new) available in Planful. You can perform the following actions on any Dashboard:
Edit
Duplicate
Delete
Share
Upload Thumbnail
In Practice: Accessing the Reporting Role Option
Go to Maintenance > Admin > User and Role Management, and click Add. The Add User window appears.
You can view the Reporting Role option along with other necessary parameters needed to add a new user.
Select an appropriate Reporting Role from the list. Following are the options available:
Regular User: When you assign this role to anyone, they can access the Reports or Dashboards which they have created on their own or when someone has shared the Report or Dashboard with them.
Reporting Administrator: When you assign this role to anyone, they can access any Report or Dashboard (existing and new) available in Planful.
Business Value
This functionality provides Reporting Administrators the flexibility of accessing all Dashboards along with Reports and gives them the convenience to perform any task, such as Edit, Duplicate, and so on. Prior to this release, this functionality was only limited to Reports.
Platform: Enhanced the ability to Delete a row in Currency Exception
You can now delete single or multiple rows in a Currency exception table for an account using the Delete Rows icon. Previously, you could only delete single or multiple rows by using the Delete key on the keyboard. This enhancement enables you to select only the row/rows you want to delete and remove them from the rest of the exceptions.
Simultaneously, we have removed the Delete icon from the top toolbar to avoid the confusion of two delete icons. The now obsolete, Delete icon was used to delete the entire list of exceptions across accounts.
Business Value
This functionality provides you the flexibility and ease of deleting only selected rows from a list of exceptions from the user interface. It helps in avoiding the loss of the entire list of exceptions that occurred previously by the usage of the Delete icon.
In Practice
Go to Maintenance > Currency > Currency Exceptions.
Select a row or multiple rows of exceptions that you want to delete. The Delete Rows icon is enabled.
Click the Delete Rows icon. A confirmation message appears.
Click Delete.
The selected rows are deleted from the list of exceptions.

Platform: Heads Up! Support Admins can auto login to Support & Community Portal in Salesforce
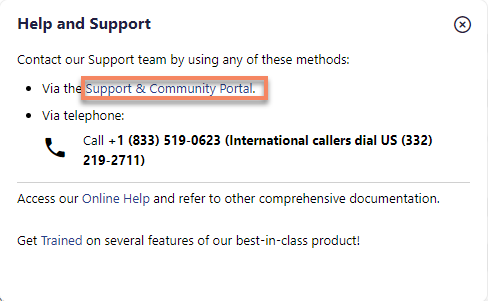
With this release, all Support Administrators can automatically log in to the Support & Community Portal by clicking the Customer Support icon > Support & Community Portal link and contact the Planful support team.
Platform: Added Arabic and Chinese character support for ESM Data Load
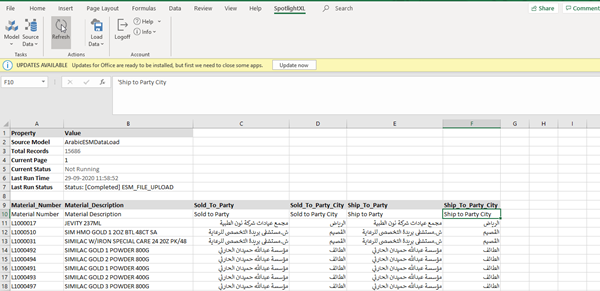
With this release, you can now enter Arabic and Chinese characters in an external source model (ESM) Data Load Rule (DLR) and upload it to Dynamic planning.
Business Value
This functionality provides you the flexibility and ease of using Arabic and Chinese data sets to fill in Dynamic Planning models.
If you are unable to use this feature, please do not hesitate to reach out to your Planful Account Manager or Support.
Platform: Heads Up! Transactions V2 for Data Load Rule Available for New Customers
With this release, the Transaction Data Version 2, which provides fast and more efficient processing of the Data Load Rule will be available to all new customers by default.
The Transaction Data Version 2 will come bundled with the platform. If you are an existing customer with the Transactions Data V2 option available in the Load Sub Item drop-down list for Data Load Rules and have the setting enabled, then this change does not apply to you.
For more information about this feature, refer to Data Integration Admin Guide.
Platform: NetSuite Tab Integration Deprecation
With Winter 21 release, the feature using which you could access the Planful application in a tab from within the NetSuite ERP application will no longer be available.
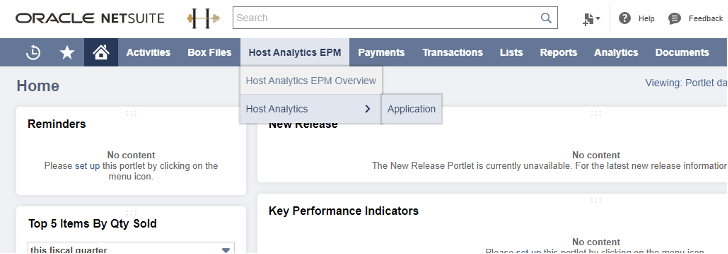
If for any reason, you are using this functionality, please reach out to your Planful Account Manager or Support.

