Dynamic Report Output Functionality
- 19 Minutes to read
- Print
- DarkLight
- PDF
Dynamic Report Output Functionality
- 19 Minutes to read
- Print
- DarkLight
- PDF
Article summary
Did you find this summary helpful?
Thank you for your feedback
Once you run a Dynamic Report, additional menu ribbon options become available. This section discusses those options.
Snapshot
Take a snapshot of your Dynamic Report so you can export it to Excel and save it to your desktop or in a folder in the File Cabinet.
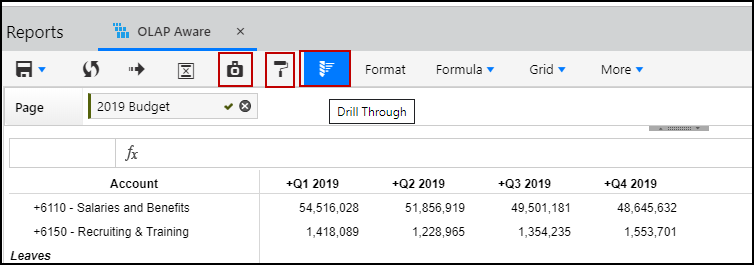
Drill Through
Click the icon to view the drill through report.
Note:
The Drill Through icon is enabled only if Drill Through is enabled for the Dynamic report.
The icon is visible in the toolbar across all Dynamic Reports on Financial reporting area where Drill Through is enabled in the report. Additionally, the icon is enabled only for those cells where drill through is applicable. It is disabled for header, excel, row title, Insert Formula, formula exception, and advanced formula cells.
You can view the drill through report in the following ways:
Click the Drill Through icon.
Double click the cell on the grid.
Format Painter
Use Format Painter to copy the formatting of text or cells in your report output.
- Open a Dynamic Report.
- Select the test or range of cells you want to copy the format of.
- In the toolbar, click Format Painter.
- Select what you want to paste the formatting onto.
Note:
Copy Format copies both text and data format.
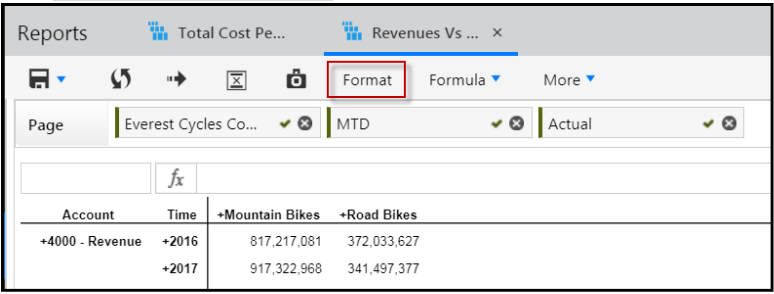
Format
Click Format to launch the Format pane where you can format negative numbers, choose number scaling and separators (i.e. comma or period displayed for numbers), and more.
The format bar will appear differently based on if you have opted in to Cell Level Formatting, a feature that allows you to format Dynamic report output down to the individual cell level, or have Standard Formatting functionality.
Standard Formatting Functionality - You Have NOT Opted In to Cell Level Formatting
A description of all fields is provided below:
Display as - The format in which you want your report numbers displayed.
Decimal Places - Choose up to 6 decimal places for numbers. Decimal places are displayed in Dynamic Reports based upon whether Report Sets are used or not. When Report Sets are not used in a Dynamic Report, decimal places displayed in quick functions are identical to those in the Dynamic Report. When Report Sets are used, decimal places in quick functions allow for the maximum number of decimal places allowed for a selected range.
Negative Numbers - Determines the format of the negative number. You can display negative numbers in parentheses, in color, or both. If you choose Absolute as the format, negative numbers will be displayed as positive numbers without any formatting.
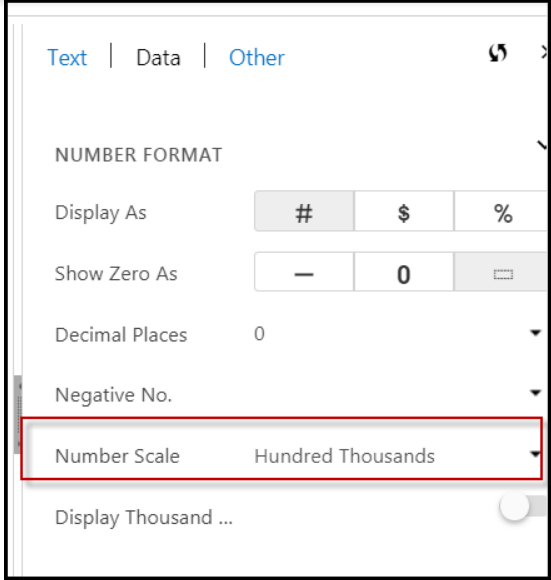
Number Scale - Defines a value that the numbers displayed in the Dynamic Report must be multiplied by to get the actual number.
Display Thousand Separator - Determines whether a comma is to be placed to separate thousands.
Preview - Displays the format for negative numbers based on your selections.
Some options are disabled if report sets are used in the report.
Suppress: Suppress empty rows, columns or headers from view in the report.
Drill Through: Drill through translation and transaction details. Expand (drill down) and collapse (drill up) report detail.
Transaction and Translation data is not stored in the OLAP Cube from which the Dynamic Reports pull their data, which is why drill-through is required. This means that you cannot run a Dynamic Report to output Transaction or Translation data. For example, lets say you have a travel line item in your report that shows up as a number. You have to drill down to see what transaction data makes up that number. You cannot generate a report to open and display at the transaction level.
Note:
Once you start drilling down, some functionality becomes disabled such as Pivot and Sort.
Cell Level Formatting
With Cell Level Formatting, you to control the look and feel of report output down to the cell level. Apply formatting to the entire report, a row/column, a range of cells, or an individual cell. Additionally, you can:
apply formatting when using the insert formula row/column in a report
format a formula exception value
vertically top/center/bottom align headers and numbers in a report
Note:
Header and Footer rows honor the formatting applied from the Header & Footer section
If you opt-in, this functionality applies to all existing and new Dynamic Reports across all browsers. It is available for all reporting areas (Financial, Sales, Workforce).
Cell Level Formatting is enabled only for Dynamic Reports that are designed using dimensions or attributes. Dynamic Reports where Report Sets are used are not supported.
The default format for a Dynamic Report is:
Column headers are center aligned and bold
Row headers are left aligned and bold
Drill down members are shown with indents
Numbers are right aligned
Font = Arial, size = 8, color = black, fill color = no color
Formatting is applied to all cells within the body of the report and:
Applies to row and column headers, numbers/data values in the report
Applies to merged cells (when multiple dimensions are used on the column axis)
Notes, Insert Formula row/column, Formula Exceptions
Formatting is retained when exporting a Dynamic Report, when it is included as an email attachment, linked report, and when used in a Report Collection or FPP.
When the structure of the report is modified by adding or removing dimensions from the row or column axis, formatting has to be readjusted for accuracy.
In Practice
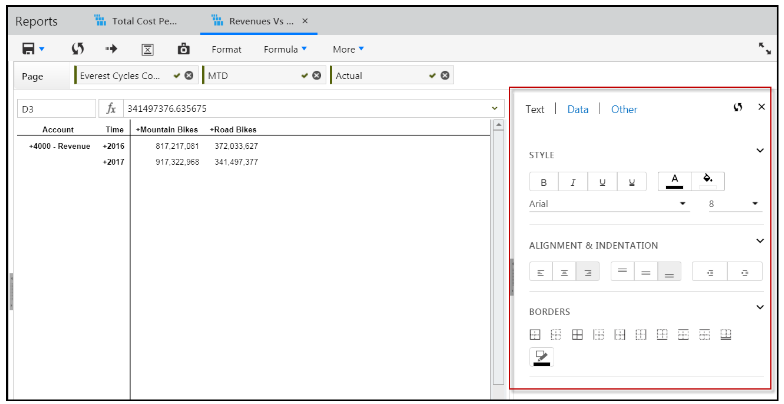
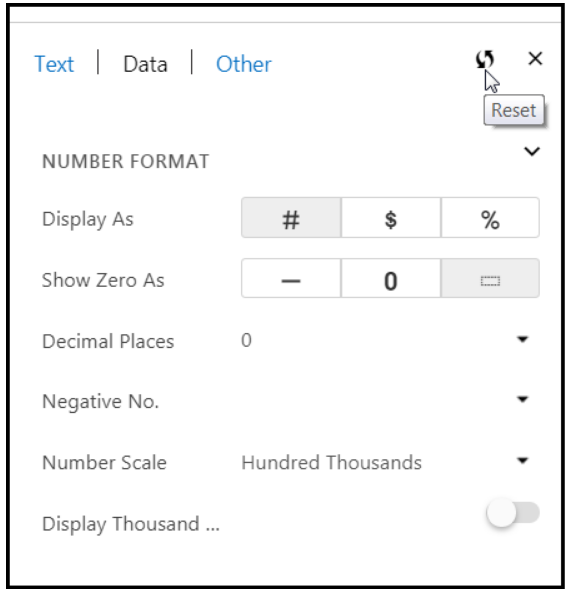
To apply cell level formatting to a Dynamic report, open the report, and click the Format icon (an example is shown below).
The Format pane appears as shown below. There are 3 tabs; Text, Data, and Other. Ensure the Text tab is selected.
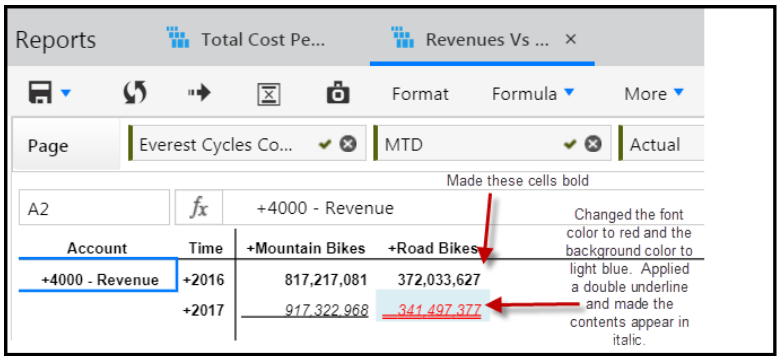
Select a cell and apply different styles. The same report shown above has been modified and is shown below.
To select a range of cells as shown below, drag the cursor as you would in Excel.
Change the font type and size. In the report below, 2016 font size is increased.
Planful supports a range of font types, which are enabled in Static Report Sets. Select the list-box to view all supported font types. Fonts size 8 through 32 px are supported. The default is set to 8 for all existing and new Dynamic Reports across all the lines. Based on the font size the row height automatically adjusts.
Select alignment and indentation options. In the report shown below selected cells are vertically aligned to the bottom of the cell. Select horizontal alignment (left, center or right). Select vertical alignment (top, center or bottom). Select to indent left or right. Indents, horizontal, and vertical alignment also applies headers and data values.
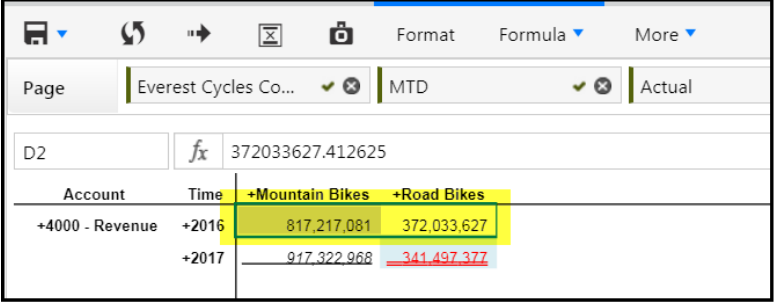
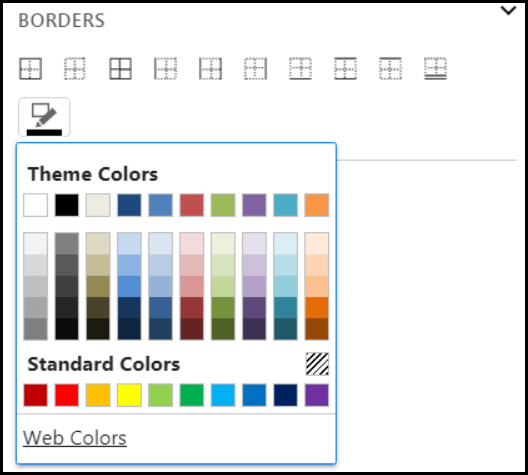
Apply borders to the report. Select a cell or cells, select a border color and click the border type to be applied. In the image below, a yellow border is applied to a cell.
Here is the border color and border type selection pane. There are many options to choose from including, no border, left and right border, and top and bottom border.
Click the Data tab.
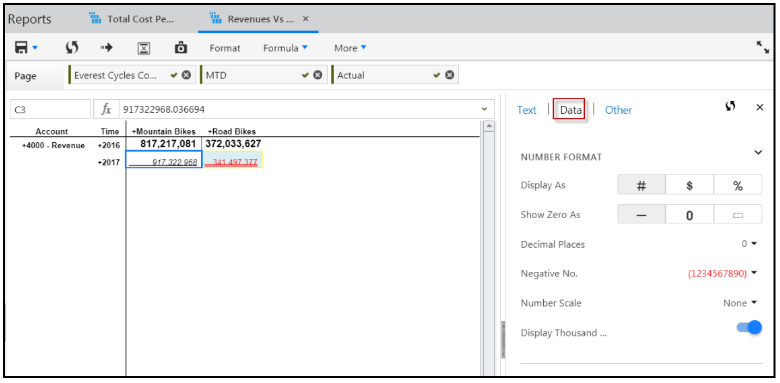
For Display As, select to display the cell contents in number, currency, or percentage format. When currency is applied to a cell or cells, the Currency Alignment options displays as shown below.
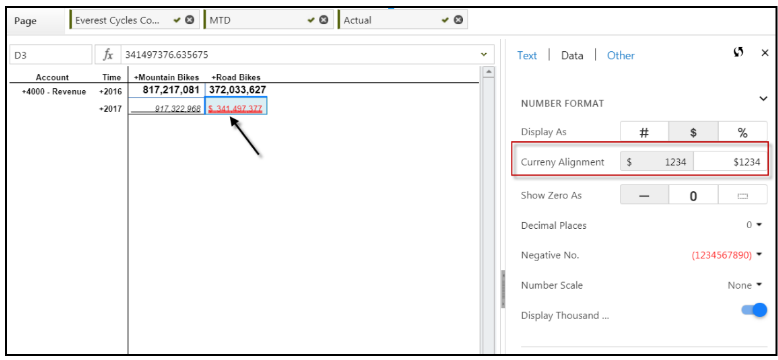
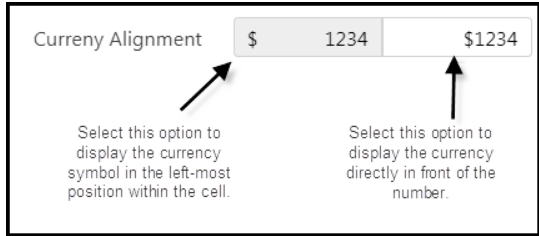
Select how you want the currency symbol displayed in the cell. There are two formats; Accounting and Currency. With the Accounting format, the currency symbol is displayed in the left-most position within the cell. With the Currency format, the currency symbol is displayed directly in front of the number in the cell.
When multiple formats are applied to the report, only the most recently applied format gets applied to each cell in the report. When multiple cells with different formatting are selected, format of the first cell is displayed in the pane. Formatting is not supported when Properties are added to the report.
The Currency symbol displayed is based on your location settings.
For Show Zero As, select how you want to display zero values (as dashes, empty, or as 0) for a selected cell, cell range, or the entire report. Selecting 0 applies to all data values in the report including Excel calculations, insert formulas, and formula exceptions.
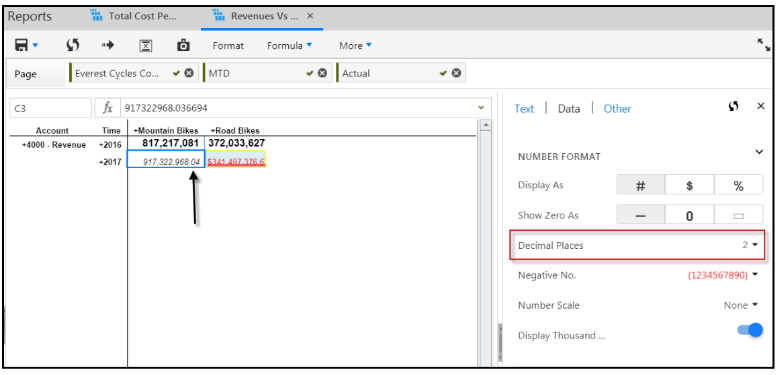
Select the number of decimal places for a selected cell, cell range, or report. In the example below, 2 decimal places is selected for a cell. You can select 0 to 6 decimal places.
Select a Thousand Separator option. Display of the thousand separator is driven based on user location settings.
Finally, click the Other tab and select to hide or display empty rows and columns.
Don’t forget to click Apply and Save!
Resetting Formatting Selections
If you want to return to the default formatting, click the Reset icon. The Reset icon on the top of the Format pane resets the format values to the defaults.
Tip!
Use the Ctrl+A shortcut key to select the entire report and apply Text and Data formatting. Alternatively, use the Format button available on right click menu of a cell.
Situations When Formatting is Disabled or Can't be Applied
In certain situations, formatting might become disabled or has to be reapplied. The remainder of this topic discusses these situations.
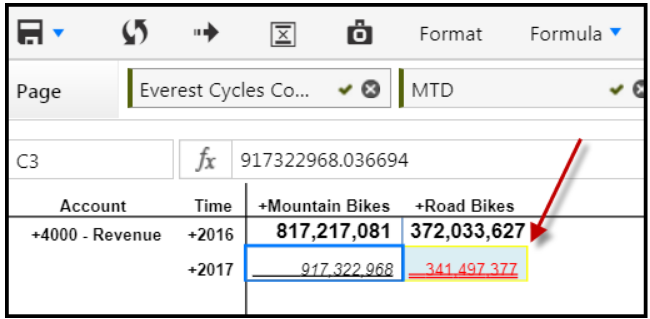
Drill Down Rows and Columns
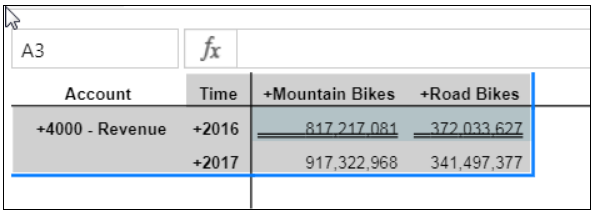
Formatting is disabled for drill down rows and columns. The images below depicts the behavior.
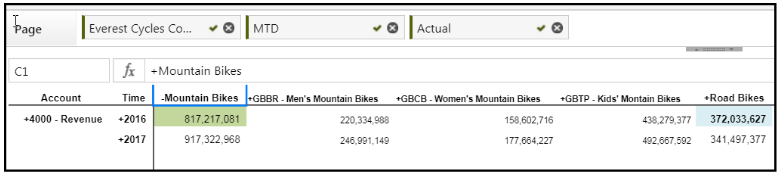
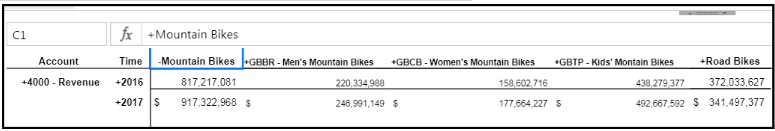
Prior to Drill Down Formatting is Applied to Cells
Click the Mountain Bikes Drill Down and Formatting is Not Applied to Members
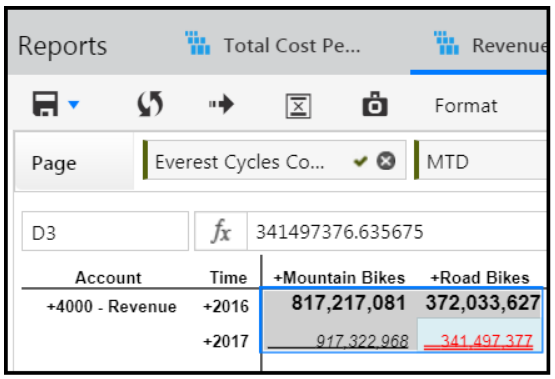
Running Borders and Currency Format
Running borders and data formatting is inherited from the parent member and applied to the drill down rows and columns. The images below depicts this behavior.
Running Border and Currency Format Applied
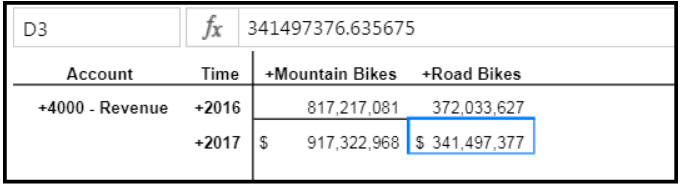
Running Border and Currency Format Also Applies to Drill Down Members
Number Scale
Number Scale is disabled when you SELECT ALL or do a CTRL+A. In the image below, a CTRL+A was performed.
Then, a number scale was selected, but is not applied to the report when all report cells are selected.
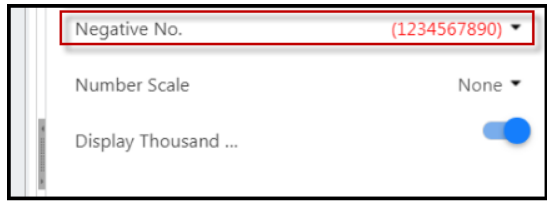
Font Color When On a Mac
The drop down for negative numbers does not apply a Red font color in the drop down (shown below) on a Mac.
Substitution Variables
See Also: Setting Up and Using Substitution Variables
Applying Substitution Variables on the Members Pane
Substitution variables are available for selection on the Members pane and can be applied to the page, row, or column.
Note:
The Members tab is not available when a Report Set is selected and variables will not be available for selection.
This feature is available in Dynamic Reports only and is not available when a Dynamic Report is used in the Financial Package Publisher.
In Practice
A dimension is added to the page axis and the @CURBDGT@ substitution variable is selected and added to the Mapped Members pane, which means that the substitution variable is applied as a page axis member.
When substitution variables are selected in the member selector for a row or column axis, the values are displayed as row or column headers in the report output. When you run the Dynamic Report, you are prompted for variable values.
Substitution variables can be added to the Pick List. All report functionality (drill through, formatting, and grid actions) is available for substitution variables values when applicable.
Substitution Variable Report Output Indicators
Once report output is generated, there are indicators to represent where in the report the variables are used .
R - represents that a substitution variable is used in the report set lines applied to the Dynamic Report.
H - variables have been added to the report header.
F - variables have been added to the report footer.
Formula Exceptions
Click Formula and select Formula Exceptions from within the Dynamic Report interface. Use formula exceptions to override the calculations performed on report results.
Add formula exceptions by clicking on the Add Row… link.
Once a new blank row is added, enter a cell or a range of cells and the formula that the exception will apply to. The range of cells must be entered as follows: E1:E26. Formulas must start with an = (equal) symbol.
Formula Bar
You can show or hide the formula bar by selecting Formula, Hide/Show Formula Bar. Use report results to further manipulate data.
Formula - Insert Row/Column
A column or row with the Excel Formula function can be used to write advanced or complex Excel formulas in the report.
Each cell can have a different set of formulas.
Available functions are:
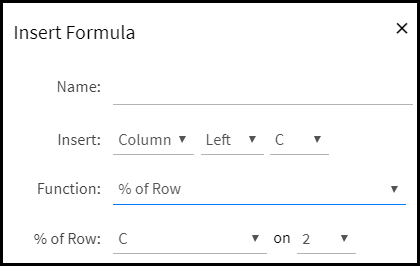
% of Row – Select a row and column intersection as the basis for percentage of all other rows on the spreadsheet. For example, select Column B, Row 3 which contains 100 dollars. And you want to insert a new column with % of Row function. A new column will be added based on the selections made on the Insert Formula page. The new column will result in 100% for Row 3 with 100 dollars. But, if Row 2 only contains 50 dollars. A percentage of 50% will be displayed.
Average – Average the amount of two rows or columns.
Comments – Add a row or column where you can add comments.
Count – Add a row or column that totals the count of columns or rows.
Max Value – Find the maximum value of a column or row.
Min Value - Find the minimum value of a column or row.
Q&A – Add a row or column where you can add questions and enter answers.
Column Total – Add a row or column that provides the summed amount for the selected row or column.
Sum – Find the sum or two rows or columns.
Variance – Find the difference between two rows or columns.
Variance % - Find the percentage of the difference between two rows or columns.
Custom Formula – Enter a row or column where you can create a custom formula to apply.
Name – Enter a name for the formula you are inserting.
Insert – Select the area of the report where the formula will be inserted.
Function – For example, if you want the sum the total of a column, select this function.
Grid
Show/Hide Gridlines
Select this option to show or hide the gridlines in the report.
Freeze Panes
Select this option for large reports for enhanced scrolling.
Sort Ascending
Select this option to sort a report in ascending order.
Sort Descending
Select this option to sort a report in descending order.
Default Sort Order
Select this option to sort the columns on the grid based on the member sequence selected while creating the Dynamic Report.
Note:
If you apply a sort order to a column and save the Dynamic Report, the selected sort order is retained when you navigate to another page or login to the application the next time.
Note:
When you apply a sort order and save the Dynamic Report, the sort order is retained in Report Collection and Financial Package Publisher.
Pivot
Pivot a column selection to row and a row selection to column.
Show/Hide Row Headers
Displays or hide the row headers.
Show/Hide Column Headers
Displays or hide the column headers.
Resize Column(s) Width
Resize and save the column width to prevent modification.
Default Column(s) Width
Reset the column width to the original setting when the report was created.
Resize Row(s) Height
Resize and save the row height to prevent modification.
Default Row(s) Height
Reset the row height to the original setting when the report was created.
In Practice : To resize the row height or column width
Select the Resize Column(s) Width or Resize Row(s) Height from the Grid list box. A pop-up window is displayed.
Update the width or height.
Click Ok.
Additionally, you can drag and resize the row height or column width using the mouse.
Best Practice
Size of the column or row is specified in pixels.
Size applies to the entire row or column and cannot be changed by a cell.
Use shortcut keys CTRL or SHIFT to select multiple rows or columns and drag to resize them or use the toolbar menu option.
Use double-click to auto-fit the contents.
Set the size to 0 to hide a row or column. Use the Default Column(s) Width or Default Row(s) Height options from the Grid list box to reset the size.
Maximum size allowed is 999. By default, the row size is 20. The column size varies depending on the content.
Select the Show Row Headers or Show Column headers option from the Grid list box to use mouse for adjusting the size.
Limitations
Row height adjustments are not supported for header or footer rows.
When you drill down on a rollup member, row height adjustments are retained with the row where it was originally applied and does not automatically move with the member on the row.
Size cannot be copied from one row or column to another.
More
The functionality available under the More list-box is described below.
Other Settings
Comments Off
Select this option to enable the Comment option. This option is visible on the right-click menu. A visual indicator is displayed if a comment already exists on a cell. When Comments Off is enabled, the Comment option and visual indicators for comments are removed from the Dynamic Report. The setting is retained when you Save, Save As or Copy a Dynamic Report.
Note:
The default is set to Comments Off in all existing and new reports
Apply/Remove POV
Select this option to apply or remove Point of View (POV). You can modify the page level settings to display specific dimension members. If you apply the Point of View (POV) setting to a dimension and save the report, the applied POV setting is retained when you navigate to another page or login to the application the next time.
When you open a shared report with POV settings defined by another user, the report is displayed with the applied POV setting.
Note:
If you are a read-only user, you can change the POV setting while running the report, but when you navigate to another page or login to the application the next time the changes will not be saved.
The Apply/Remove POV setting on the report is retained:
When you Save As or Copy a report.
In a Dimension based report and reports with Substitution Variables on the Page axis.
Rank
Rank dimension members. Select Rank to open the Rank page. For each dimension, select a top or bottom ranking, a measure and count. Ranking methods include; Top, Bottom, Top %, and Bottom %.
Disable/Enable Drill Through
Enable or disable Drill Through functionality. Drill through functionality provides users with the ability to view and analyze all financial, operational, capital, workforce, and transactional data from a single place. For more information, see the Dynamic Reports topic.
Note:
By default, Drill Through is enabled.
Show/ Hide Notes
Show Notes provides you with the ability to view template notes in a Dynamic Reports. Click Show Notes, a Notes column is displayed on the report and notes are displayed for each line in the report. Notes are always vertically bottom aligned like the other cells in the report.
Repeat Labels On/Off -
Labels in report output are for informational purposes.
To turn Repeat Labels Off - In the Dynamic Report output screen, click the More list-box. Select Repeat Labels Off.
To turn Repeat Labels On - In the Dynamic Report output screen, click the More list-box. Select Repeat Labels On.
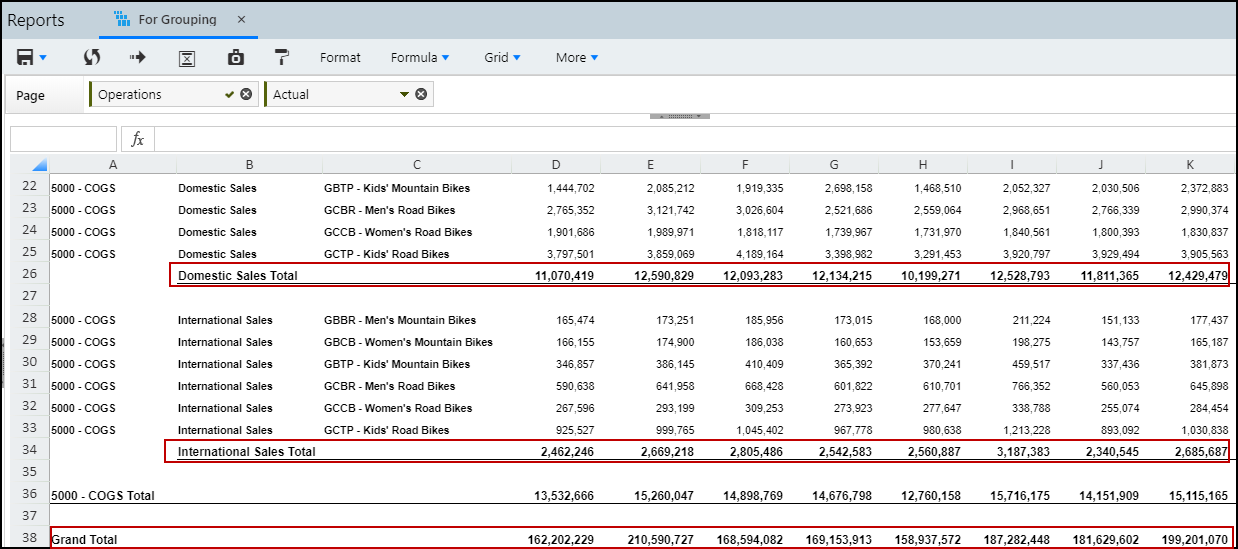
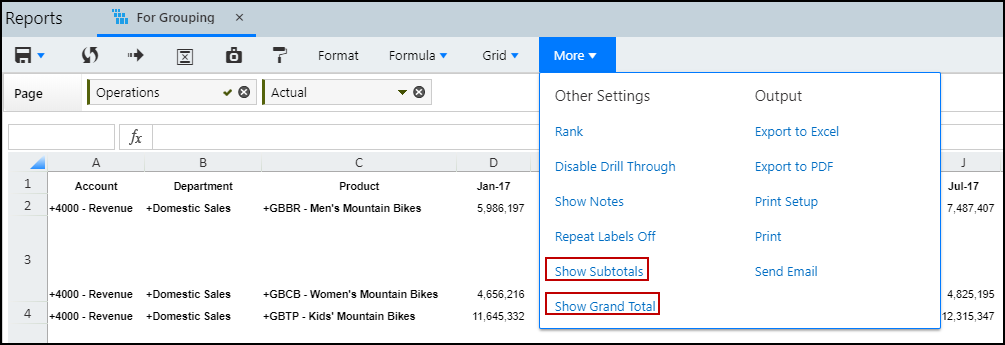
Show/ Hide Subtotals and Show/ Hide Grand Total
You can show or hide the subtotals and grand total functionality in the Dynamic report.
Note:
The subtotals and grand total functionality are enabled in the More list box if Dimensions are mapped to the Row and Column axis, and more than one dimension is mapped in the Row axis.
The subtotals are displayed at the end of each section and the grand total is displayed at the end of the report as shown in the image below.
In Practice: To access the subtotals and grand total functionality
- Open a Dynamic Report.
- Select the More list box.
- Select Show Subtotals or Show Grand Total.
You can change the format of subtotals and grand total if the Format button is enabled in the Dynamic Report toolbar.
The following options are disabled when Show Subtotals or Show Grand Total is enabled:
The Formula Exceptions and Insert Rows / Columns options in the Formula list box is disabled. Only the existing Formula Exceptions on the Dynamic report are applied on the adjusted cells and included in the subtotal or grand total calculations. The existing Insert Rows / Columns are not visible when Show Subtotals or Show Grand Total is enabled in the report.
The Pivot, Sort Ascending, and Sort Descending options in the Format list box are disabled.
Note:
When you drill down on the report, Show Subtotals and Show Grand Total are not displayed in the Dynamic Report.
Note:
When Rank is applied in a Dynamic Report, the subtotal and grand total is calculated on the result set after applying Rank.
Note:
When properties are added to the Row or Column axis, the subtotal and grand total is calculated only for dimensions and not for properties.
Subtotals and Grand Total are retained in the Report Collection, FPP, e-mail attachment, linked reports, PDF, and Google sheet.
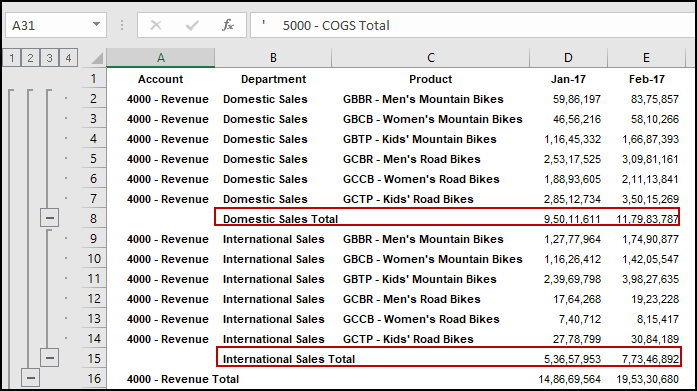
When you export a report to excel:
Grouping of subtotal is retained as shown in the image below.
Pivot and Macros are not supported if the subtotal option is enabled.
Output
Export to Excel
You can export a report to excel using this functionality.
Export to PDF
You can export a report to PDF using this functionality.
Print Setup
You can print a Dynamic Report and apply the required settings from the Print Setup dialog page using this functionality.
Header and footer information will repeat on each page of the PDF or print output. When you print a Dynamic Report, the Print Setup dialog page is displayed. On the Print Setup dialog page, select the Delete all extra Rows & Columns checkbox to remove extra data rows and columns from your Excel export. If the checkbox is not selected, the Row IDs in the Excel output match with the Row IDs within the Excel view of the report. The Delete all extra Rows & Columns setting is carried forward to Report Collection Excel outputs. Extra rows and columns are deleted or retained in the Report Collection based on the source Dynamic Report configuration.
The row and column header are repeated in each page of a Dynamic Report by default. On the Print Setup page, you can deselect Repeat row header on each page and Repeat column header on each page.
Note:
Dynamic Reports exported as Google Sheets always repeat the headers in the print output irrespective of the Repeat Header configuration done in the Dynamic Report Print Setup.
Note:
The option to delete extra rows and columns is not applicable for Financial Package Publisher as hidden/suppressed/extra rows/columns are not displayed in Financial Package Publisher output. Your Excel output will be different if the Delete all extra Rows & Columns option is selected for existing Dynamic Reports. Macros used for Excel output need to be re-adjusted manually.
Google for Work must be configured by your System Administrator in order to enable export for Google Sheets.
Google for Work must be configured by your System Administrator in order to enable export for Google Sheets.
Note:
You can export Dynamic Reports in unprotected view. See, Exporting Dynamic Reports Output in Unprotected View.
Note:
To avoid overlapping headers with report lines when printing, the default top margin in Print Setup is set to 3.5 inches.
You can print a Dynamic Report using this functionality.
Send Email
You can send a report to the selected user through e-mail.
Suppress Indents
This option is available for Report Sets on the Mapped Members pane. Selecting this option will remove indents from the output for the selected member(s), children, all children, the selected member(s) plus the children, the selected member(s) plus all children, leaves, the selected member(s) plus leaves, or the selected member(s) plus the parents.
Ctrl+M
Access the Rule dialog page, which displays the rule(s) used to generate the report.
Quick Functions
Use the Quick Functions to display Sum, Average, Count, Max, and Min. The resulting amounts are displayed when you select the range of cells in Excel mode.
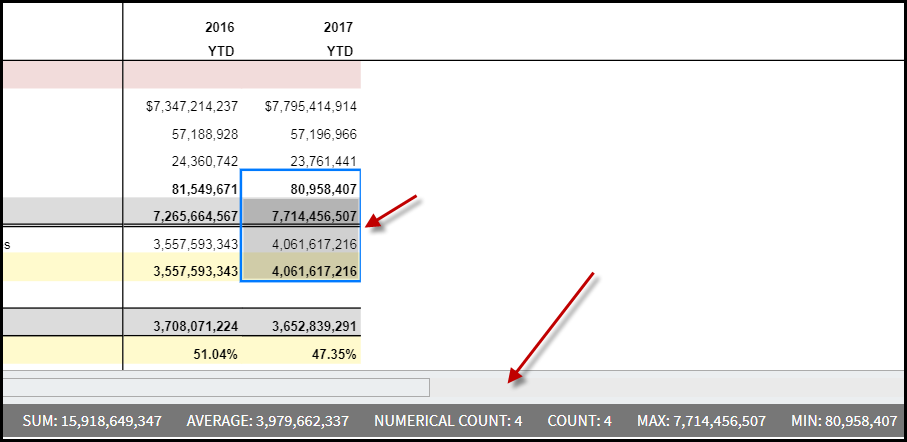
Decimal places are displayed in Dynamic Reports based upon whether Report Sets are used or not. When Report Sets are not used in a Dynamic Report, decimal places displayed in quick functions are identical to those in the Dynamic Report. When Report Sets are used, decimal places in quick functions allow for the maximum number of decimal places allowed for a selected range.
Was this article helpful?