Using Direct Access (aka Direct Connect) to PCR Financial Reporting
- 31 Minutes to read
- Print
- DarkLight
- PDF
Using Direct Access (aka Direct Connect) to PCR Financial Reporting
- 31 Minutes to read
- Print
- DarkLight
- PDF
Article Summary
Share feedback
Thanks for sharing your feedback!
Purpose of Direct Access to PCR
Dynamic Planning users can access Planful Structured Planning, Consolidation, and Reporting (PCR) application data from Spotlight or SpotlightXL without any need to download data or build a map, formula, or calculation.
Note:
Dimension security settings in PCR are carried forward to direct access models. For other models, you must establish security settings in Dynamic Planning only. All users must be set up in PCR security first to access a direct access model.
To use this feature, PCR users must have a license for either Spotlight or Dynamic Planning. (A Spotlight license provides access for reporting and analysis. A Dynamic Planning license provides access to all the features of Dynamic Planning.)
Key Benefits of Direct Access Models
One-time setup to connect from Dynamic Planning to PCR; the Power user must do this step.
Reduced learning curve with two easy steps to set up a model in Spotlight that provides read-only access to the Financial Reporting Area; users with Contributor or Power privilege can do these steps.
All data dimension security defined in PCR is honored in Spotlight. However, all metadata for the Financial cube is visible to the users in Spotlight with the exception of the Scenario dimension. For example, if a user has access only to the East region, they will see all the other regions in the Dimension list boxes but will see only data for the East region. For the Scenario dimension, users will only see the metadata for the scenarios they have access to in PCR.
Full access to Dynamic Planning's robust reporting capabilities, slice-and-dice, and analysis in Views, Reports, Excel Reports, and Snapshots, from the web or Excel.
No need to refresh metadata or data since it is a live connection to the original data; this reduces ongoing maintenance.
Data access from Dynamic Planning is read-only and primarily intended for use with analysis and reporting. For writing data changes back to PCR and also for other Dynamic Planning use cases, users can continue to use the option of downloading metadata and data into other models. For details, see Dynamic Planning: Integration Admin Guide.
Note:
The feature is labeled "Direct Access to PCR" in Dynamic Planning. Please note that you will be accessing the financial reporting area of data.
Setting Up the Connection to PCR
For organizations that are experienced with Dynamic Planning , the Power user should ensure that the Application Settings (Tenant, Horizon and Soap URI, username, and password) are up-to-date and working correctly to connect to Planful applications; then run a Metadata Download. There is no need to create a map or define calculations to connect to PCR.
For organizations that are new to Spotlight and Dynamic Planning , your Power user must set up access to PCR from within Dynamic Planning and download metadata from PCR.
In Practice
Install SpotlightXL. See Dynamic Planning: SpotlightXL Installation.
Contact Planful Support for assistance in getting your Horizon and Soap URI and Tenant names set up.
Login to SpotlightXL. See Accessing SpotlightXL.
Select Manage > Application Administration > Application Settings. Notice the Horizon and Soap URI and Tenant names are grayed out. These fields are populated by Planful Support.
Enter the Horizon and Soap username and password provided to you by Planful Support.
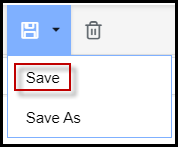
Click Save.
Logoff of SpotlightXL then login again for the settings to take effect.
Select Manage > Application Administration > Metadata Download.
Click Run. When the cursor stops spinning, the operation is complete. This operation creates the model HACPM_Financial.
Creating Users
For organizations that are experienced with Dynamic Planning , the Power user should ensure that your users have logins. Contributor privilege is required for users who will create the model and design views and reports. Reviewer privilege is required for users who will use the views and reports.
For organizations that are new to Spotlight and Dynamic Planning , the Power user must create user logins in Dynamic Planning. In a future release, we will eliminate the need for creating user logins in both PCR and Dynamic Planning.
In Practice
Login to SpotlightXL.
Select Manage > User Management.
Add usernames for the users that will be accessing the PCR data. Contributor privilege is required for users who will create the model and design views and reports. Reviewer privilege is required for users who will use the views and reports. See Dynamic Planning: User Setup and Security Guide.
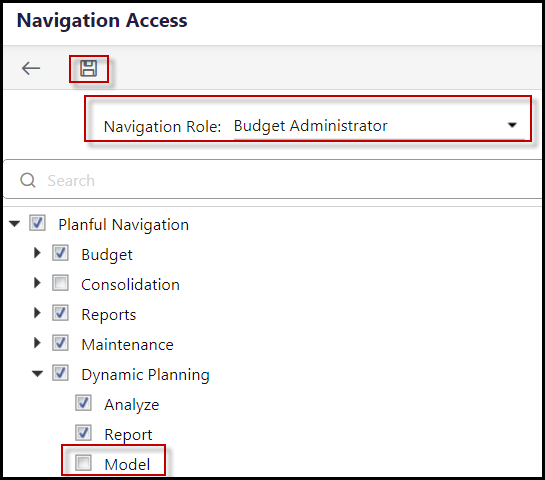
Ensure that the Model menu option is available to users in your organization. See Model Manager, Setup in Planful Applications.
Creating a Direct Access to PCR Model
A user with Contributor or Power privilege can do the following steps. A Direct Access to PCR model provides an automatic connection to the Financial Reporting Area in PCR.
In Practice
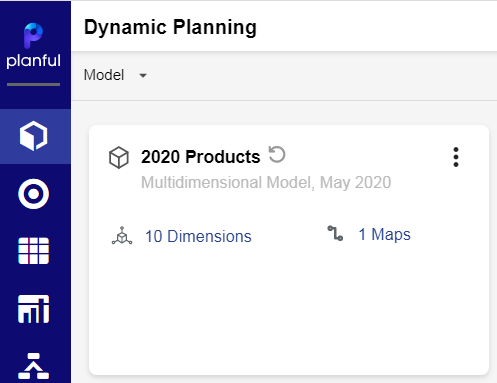
While logged into Planful applications, select Model from the Dynamic Planning icon.

Click the + Circle icon to create a new model.

Click the cube icon to indicate that you want to create a model. (The tabular icon creates an External Source Model.)

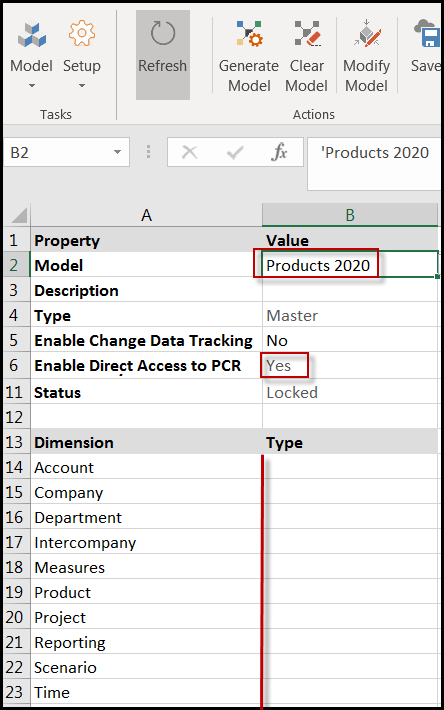
Give the model a name.
Click the option for Direct Access to PCR.

A list of dimensions appears.Scroll down and click Save.

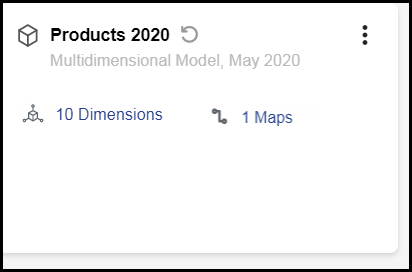
Now you see the model in the Model Manager window.

Click the More menu, and select Generate Model, then confirm Yes.
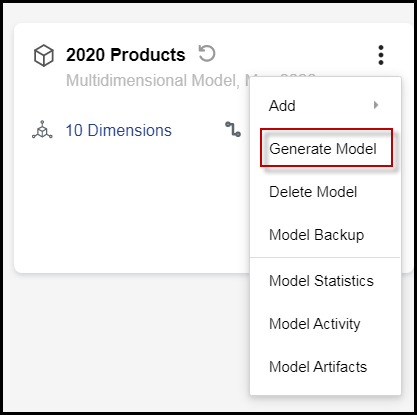


You are done, and now you are ready to begin reviewing the data and building reports.
Metadata Dimension Security for the Scenario Dimension
For models defined with Direct Access to PCR, all data dimension security defined in PCR is honored in Spotlight. All metadata for the Financial cube is visible to the users in Spotlight, except for the Scenario dimension. Users will see only the scenarios that they have been given access to in PCR.
For example, if a user has access only to the East region, they will see all the other regions in the Dimension list boxes but will see only data for the East region. For the Scenario dimension, users will only see the metadata for the scenarios they have access to in PCR.
Enabling Scenario Metadata Dimension Security for Direct Access Models
In Practice
Login to PCR.
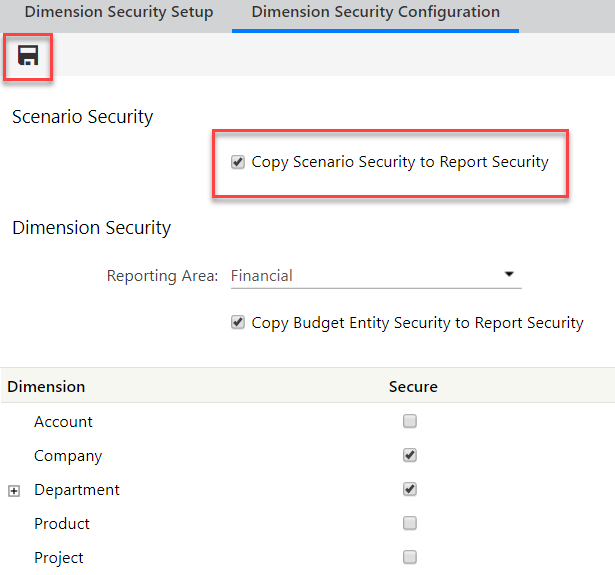
Select Maintenance > Overview > Reports > Dimension Security > Dimension Security Configuration.
Ensure that Copy Scenario Security to Report is checked, then click the Save button.
Select Maintenance > Admin > User Management, then select the user who will be working with Direct Access models.
Edit the user.
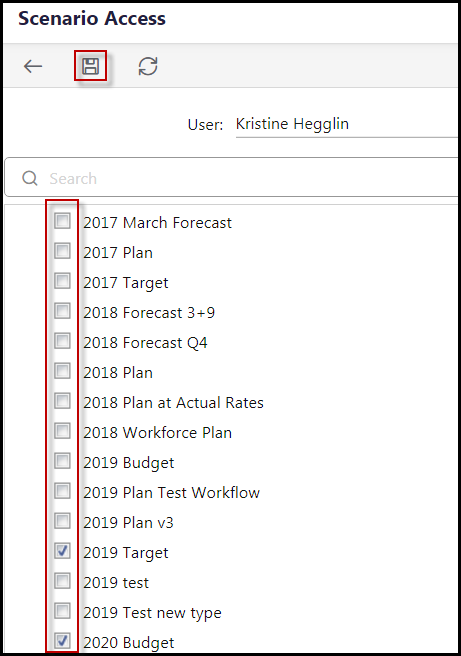
Select the More (three vertical dots) menu and select Scenario Access.
Check and uncheck items the user should or should not have access to, then click the Save icon.
Repeat steps 4-7 for each user who will be working with Direct Access models.
Here is what the user will see in a model to which their Scenario access has been restricted.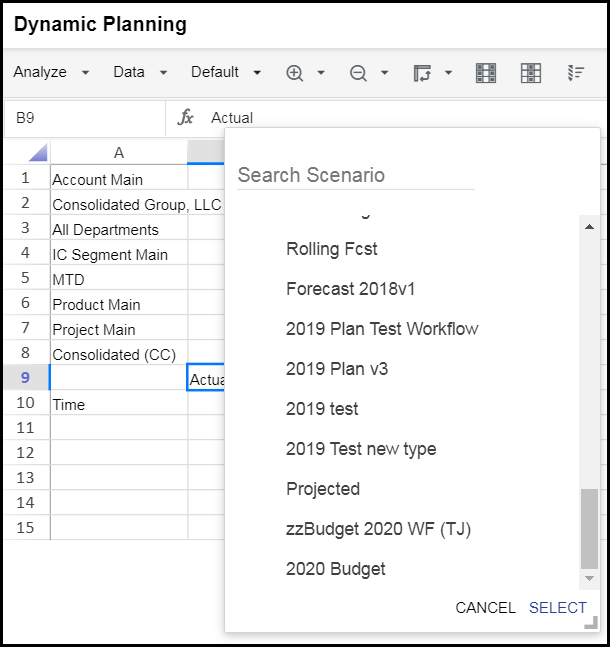


Support for PCR Attributes, Attribute Hierarchies, and Alternate Hierarchies
If you are using attributes, attribute hierarchies, or alternate hierarchies in PCR, you can see them in models with Direct Access to PCR. To learn how to set up a model with direct access to PCR, see Using Direct Access to PCR Financial Reporting.
Adding Attributes, Attribute Hierarchies, or Alternate Hierarchies to Existing Direct Access Models
Creating a Direct Access Model with Attributes, Attribute Hierarchies, or Alternate Hierarchies
Viewing Attributes, Attribute Hierarchies, or Alternate Hierarchies in SpotlightXL Model Setup
Viewing Attributes, Attribute Hierarchies, or Alternate Hierarchies in Spotlight Model Manager
Support for _Attribute_Default in Direct Access to PCR Models
Adding Attributes, Attribute Hierarchies, or Alternate Hierarchies to Existing Direct Access Models
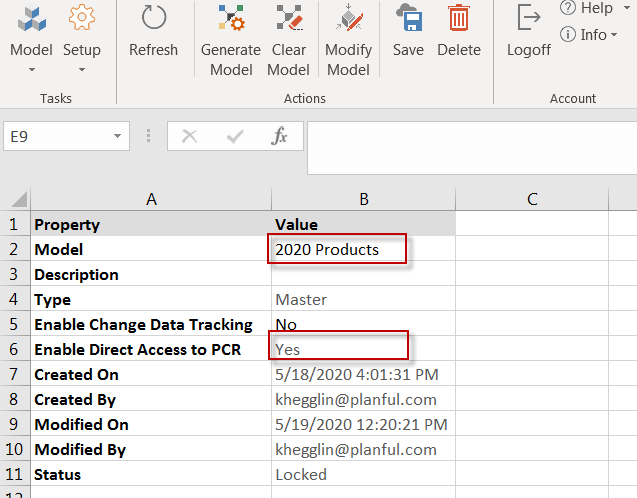
Find the model you previously created that has direct access to PCR. For example, a model named Products 2020. There are two quick steps to add the PCR attributes and alternate hierarchies to the model: Clear Model, then Generate Model. You can do those steps manually or another option is to run the default calculation that was created automatically when you created the model.
In Practice
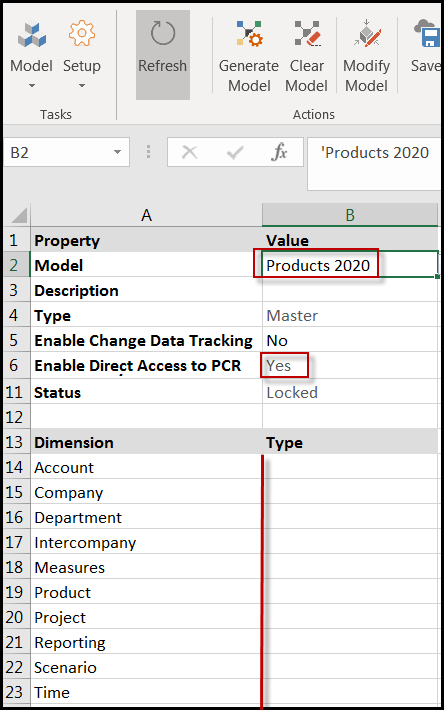
In SpotlightXL , go to Model > Setup and select the model name from the Model drop-down. You see the list of dimensions but no attributes or other hierarchies. The model is generated and locked.
Click Clear Model.
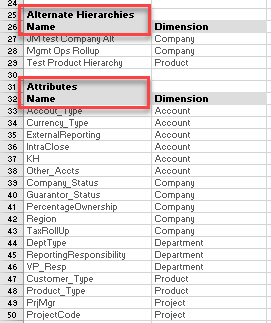
Click Generate Model. The list of dimensions, attributes, and alternate hierarchies appears on the Model Setup screen, and they are now available for your use.
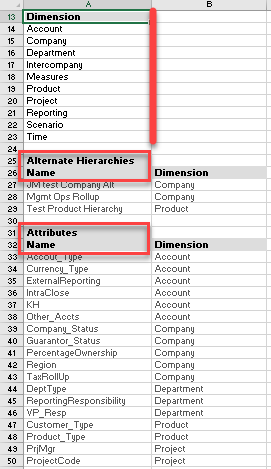


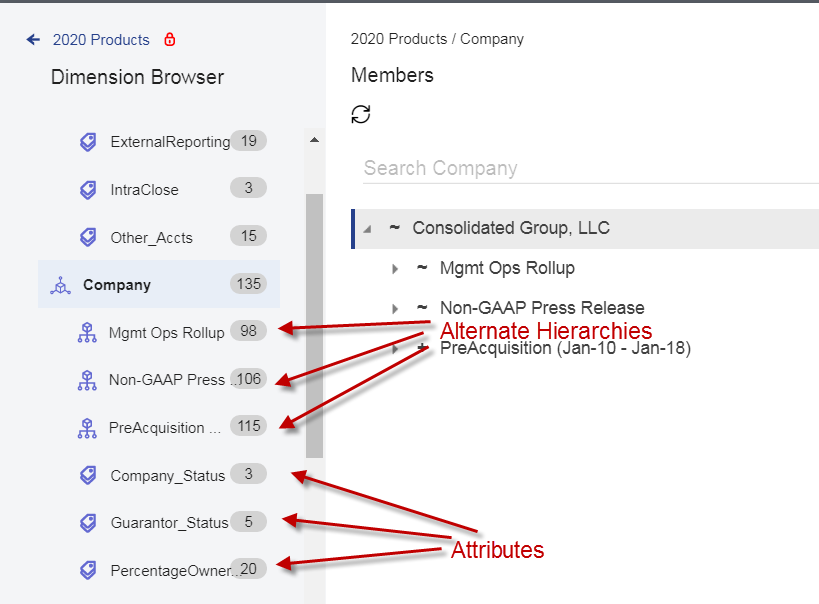
You can view attributes and attribute hierarchies from Model, Attribute. You can view alternate hierarchies from Analyze and Report.
Here is the same procedure in Spotlight on the web.
In Practice
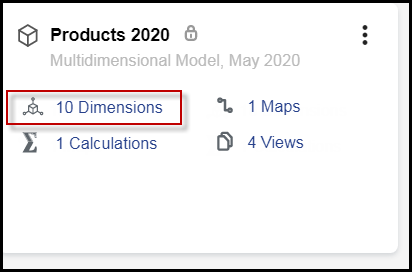
In Model Manager, locate the model from the grid or list view. Notice that there are Dimension artifacts but no Attribute artifacts yet.
Click the More menu, then select Clear Model. The icon next to the model changes to an incomplete circle.
From the More menu, select Generate Model. The screen refreshes and shows the model locked again. Now you have both dimension and attribute artifacts.


Note:
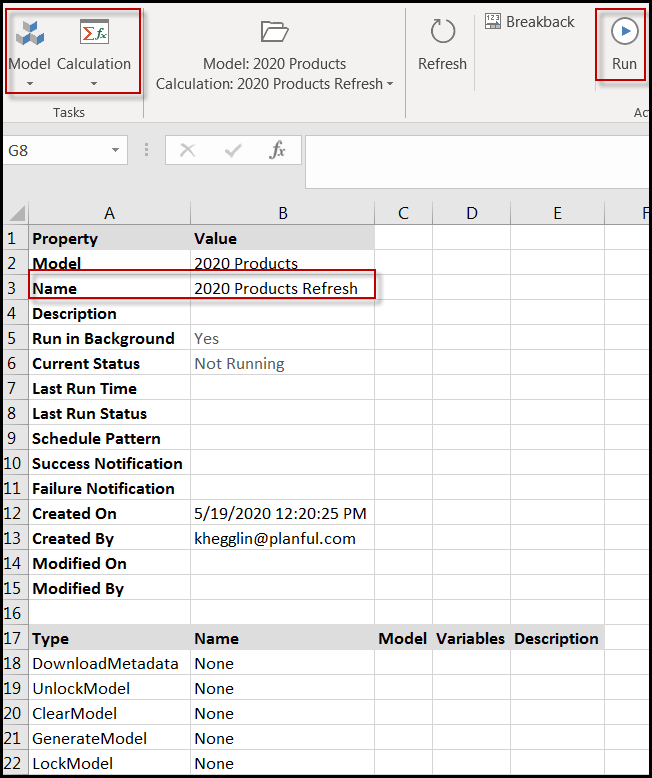
Another way to achieve the same goal is to run the default calculation which was created with your direct access model. The calculation is named <model-name> Refresh and it contains the commands to refresh the model. By refreshing the model, the attributes, attribute hierarchies, and alternate hierarchies are automatically added to the model. To run the calculation, go to Model, Calculation, locate the calculation, and click Run.
Creating a Direct Access Model with Attributes, Attribute Hierarchies, or Alternate Hierarchies
A user with Contributor or Power privilege can do the following steps. When creating and generating a model with direct access to PCR, the attributes and alternate hierarchies are automatically created with the model.
In Practice
While logged into Planful applications, select Model from the Dynamic Planning icon.

Click the + Circle icon to create a new model.

Give the model a name.
Click the option for Direct Access to PCR.
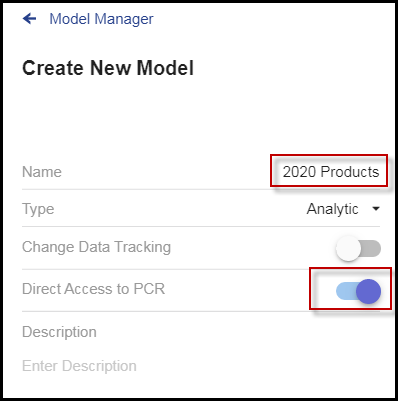
A list of dimensions appears.Scroll down and click Save.

Now you see the model in the Model Manager window.
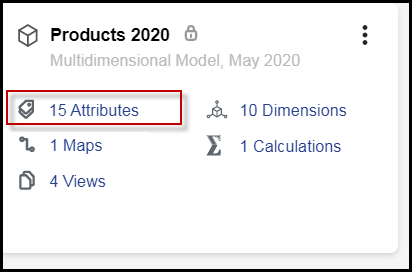
Click the More menu, and select Generate Model, then confirm Yes. Now you see that the PCR Attributes have been added to the model box, and they are now available for your use.


Viewing Attributes, Attribute Hierarchies, or Alternate Hierarchies in SpotlightXL Model Setup
In SpotlightXL, to see the PCR dimensions, attributes, attribute hierarchies, and alternate hierarchies, go to Model, Setup. Select the model from the Model drop-down.
Viewing Attributes, Attribute Hierarchies, or Alternate Hierarchies in Spotlight Model Manager
In Spotlight Model Manager, to see the PCR dimensions, attributes, attribute hierarchies, and alternate hierarchies, go to the grid or list layout view.
In Practice
Select the model or model box.
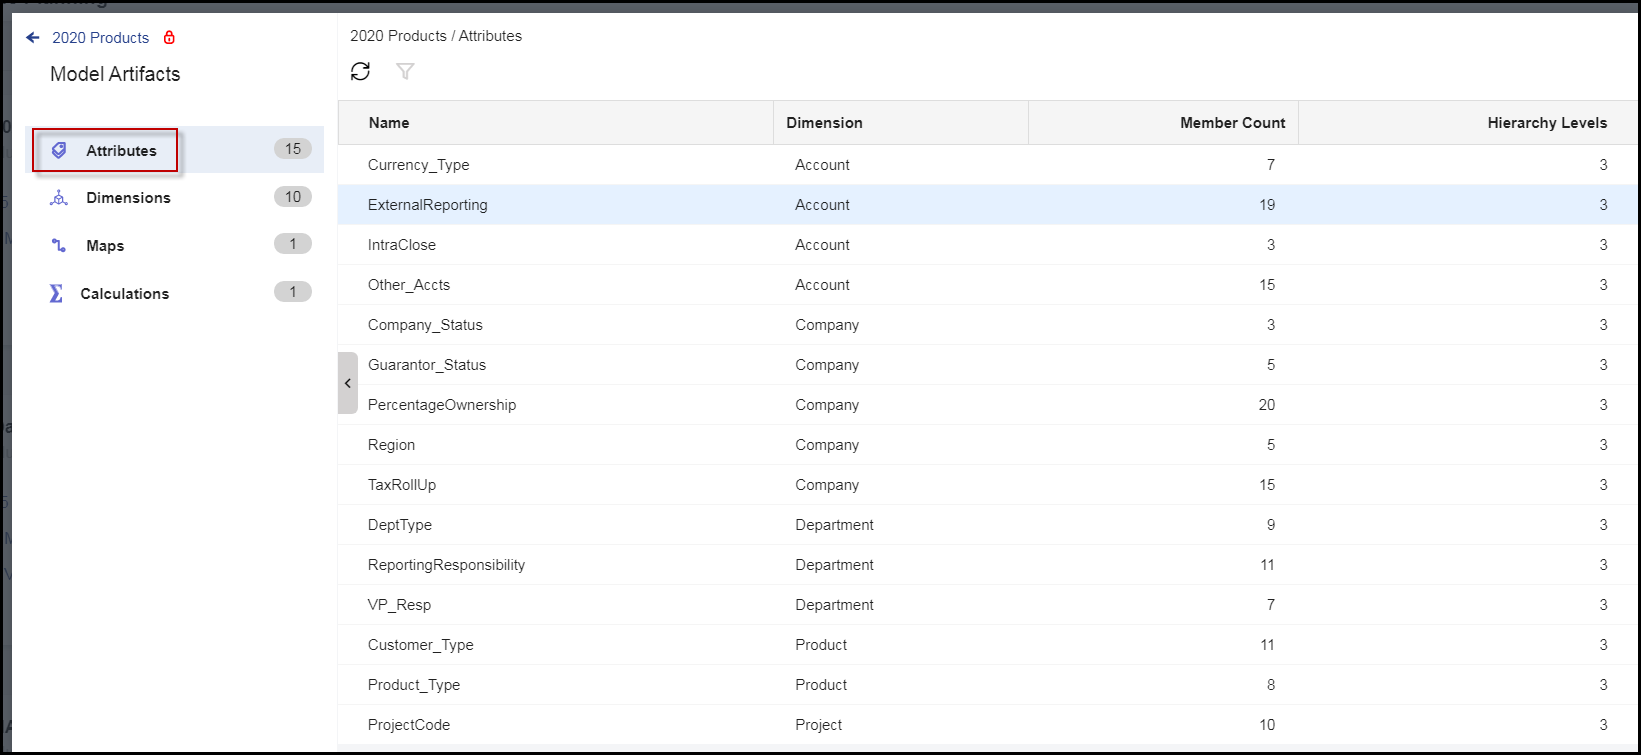
On the More menu, select Model Artifacts.
Click Attributes to see the list of attributes and the dimension they are associated with.
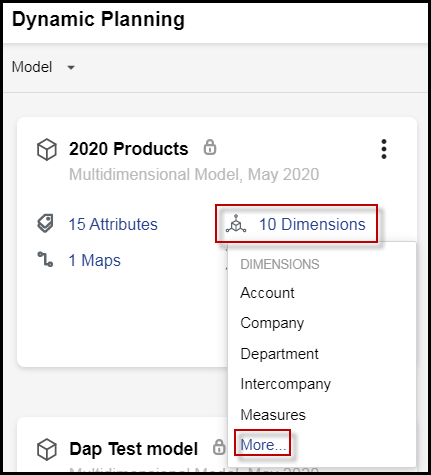
Close the Artifact Browser and click Dimensions from the main layout screen to see the list of dimensions, alternate hierarchies, and attributes.


Support for _Attribute_Default in Direct Access to PCR Models
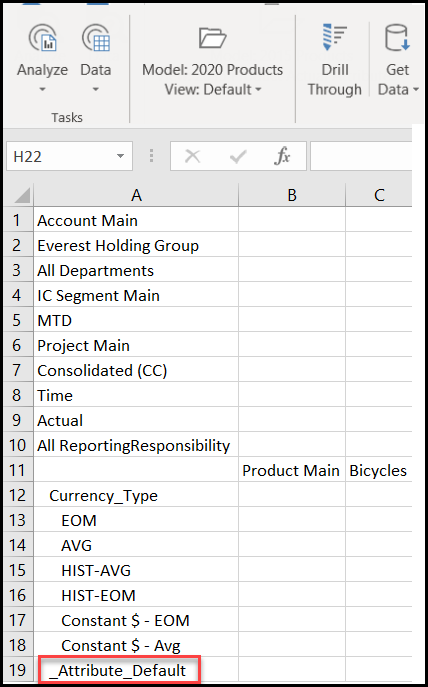
Direct Access to PCR models include support for views and reports that include the _Attribute_Default member of an Attribute dimension. This special member is used to denote members of the base dimension that have not been mapped to an attribute in an Attribute dimension. For example, if a dimension has 100 members, 80 of which are mapped to attributes, the remaining 20 members will automatically be associated with _Attribute_Default. You see _Attribute_Default whenever you expand an attribute dimension or look up an attribute in a member selection box.
Support for PCR Substitution Variables and Derived Variables
If you are using substitution variables and derived variables in PCR, you can see them in models with Direct Access to PCR. To learn how to set up a model with direct access to PCR, see Using Direct Access to PCR Financial Reporting.
To see the Substitution Variables in PCR, go to Maintenance > Reports > Cube Settings, and click the Substitution Variables tab.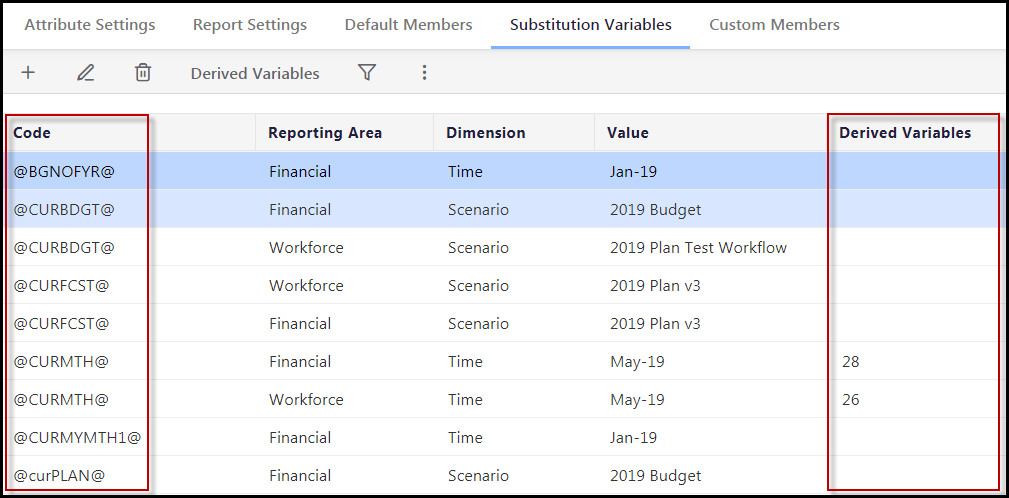
To learn how to set up a model with direct access to PCR, see Using Direct Access to PCR Financial Reporting.
Adding Substitution Variables and Derived Variables to Existing Direct Access Models
Creating a Direct Access Model with PCR Substitution Variables and Derived Variables
Viewing PCR Substitution Variables and Derived Variables in SpotlightXL
Adding PCR Substitution Variables, Derived Variables, and Expressions to Reports
Using PCR Substitution Variables and Derived Variables in Reports at Runtime
Adding Substitution Variables and Derived Variables to Existing Direct Access Models
A user with Contributor or Power privilege can do the following steps. Find the model you previously created that has direct access to PCR. For example, we have a model named 2020 Products. There are two quick steps to add the PCR Substitution Variables and Derived Variables to the model: Clear Model, then Generate Model. You can do those steps manually or another option is to run the default calculation that was created automatically when you created the model.
In Practice
In SpotlightXL , go to Model > Setup and select the model name from the Model drop-down. The model is generated and locked.
Click Clear Model.
Click Generate Model. The list of substitution variables and derived variables now appears on the Model > Model Administration > Substitution Variables screen, and they are available for your use.


Another way to achieve the same goal is to run the default calculation which was created with your direct access model. The calculation is named <model-name> Refresh and it contains the commands to refresh the model. By refreshing the model, the variables are automatically added to the model. To run the calculation, go to Model > Calculation, locate the calculation, and click Run.
Note:
When users make changes to the substitution variables in PCR, those changes are not automatically reflected in Dynamic Planning. To see the changes, the model must be refreshed. In a future release, changes in PCR substitution variables will be automatic in Dynamic Planning so that users have the latest substitution variables and their values in Dynamic Planning.
Creating a Direct Access Model with PCR Substitution Variables and Derived Variables
A user with Contributor or Power privilege can do the following steps. When creating and generating a new model with direct access to PCR, the Substitution Variables and Derived Variables are automatically created with the model.
In Practice
While logged into Planful applications, select Model from the Dynamic Planning icon.

Click the + Circle icon to create a new model.

Give the model a name.
Click the option for Direct Access to PCR.

A list of dimensions appears.Scroll down and click Save.

Now you see the model in the Model Manager window.
Click the More menu, and select Generate Model, then confirm Yes.


The Substitution Variables and Derived Variables are now available for use in reporting and analysis.
Note:
In a future release, the Substitution Variables will be visible in Model Manager.
Note:
When users make changes to the substitution variables in PCR, those changes are not automatically reflected in Dynamic Planning. To see the changes, the model must be refreshed. In a future release, changes in PCR substitution variables will be automatic in Dynamic Planning so that users have the latest substitution variables and their values in Dynamic Planning.
Viewing PCR Substitution Variables and Derived Variables in SpotlightXL
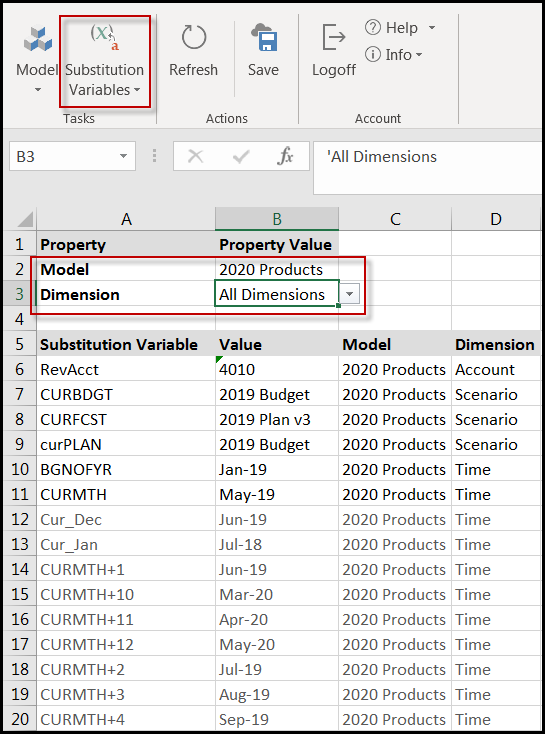
In SpotlightXL, to see the PCR Substitution Variables and Derived Variables, go to Model > Model Administration > Substitution Variables. Select the model from the Model drop-down. Select All Dimensions from the Dimension drop-down.
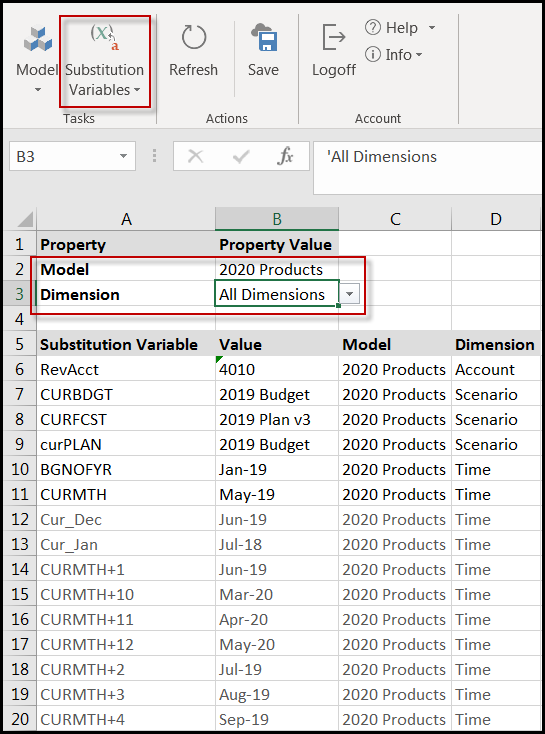
The Substitution Variables and Derived Variables and their default values cannot be changed from Dynamic Planning. To change them, make the corrections in PCR, then refresh the model.
Adding PCR Substitution Variables, Derived Variables, and Expressions to Reports
You can add PCR substitution variables and derived variables to reports, just as you can with substitution variables created in Dynamic Planning. You can also create expressions with the PCR variables to simplify report maintenance.
When running a report that includes Substitution Variables, the user can change the value of the substitution variables at run-time by clicking the Substitution Variables button on the menu bar. Note that users cannot changed derived substitution variables, only the standard variables.
In Practice: Substitution Variables Used in a Report
In a report built from a model with direct access to PCR, go to Report > Design.
Select all cells and click Design Manager.
Scroll down to Scenario and click the member selection icon.
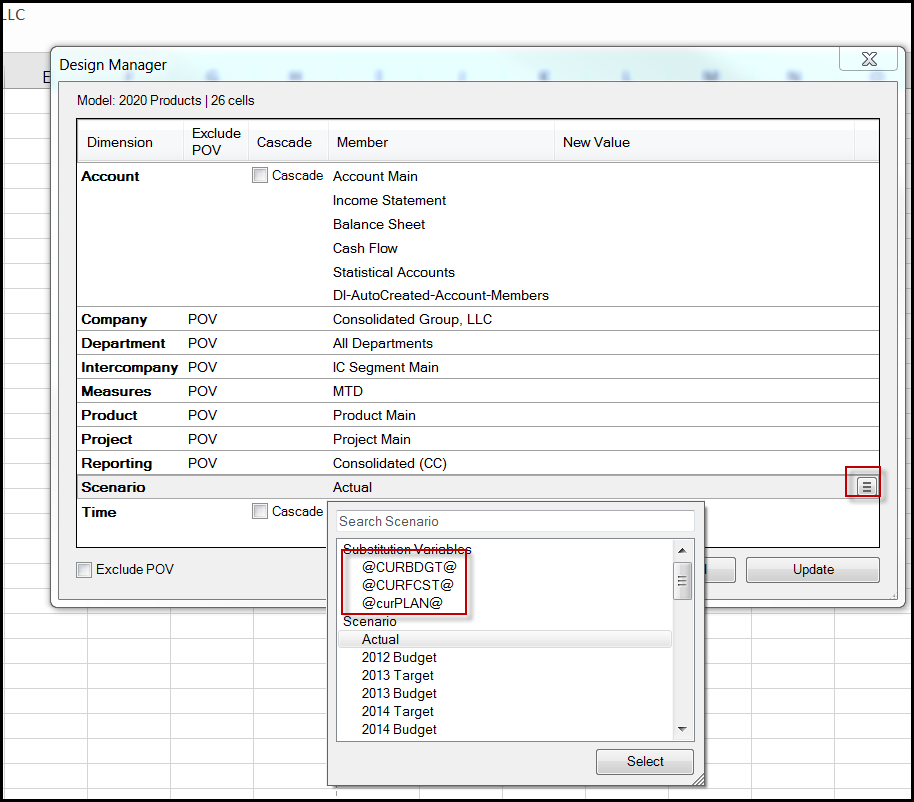
Select a Scenario variable, such as @CURBDGT@ or ACTUAL.
Scroll to the Time dimension and click the member selection icon.
Select a Time variable for the year you want to view, such as @CURYR@.
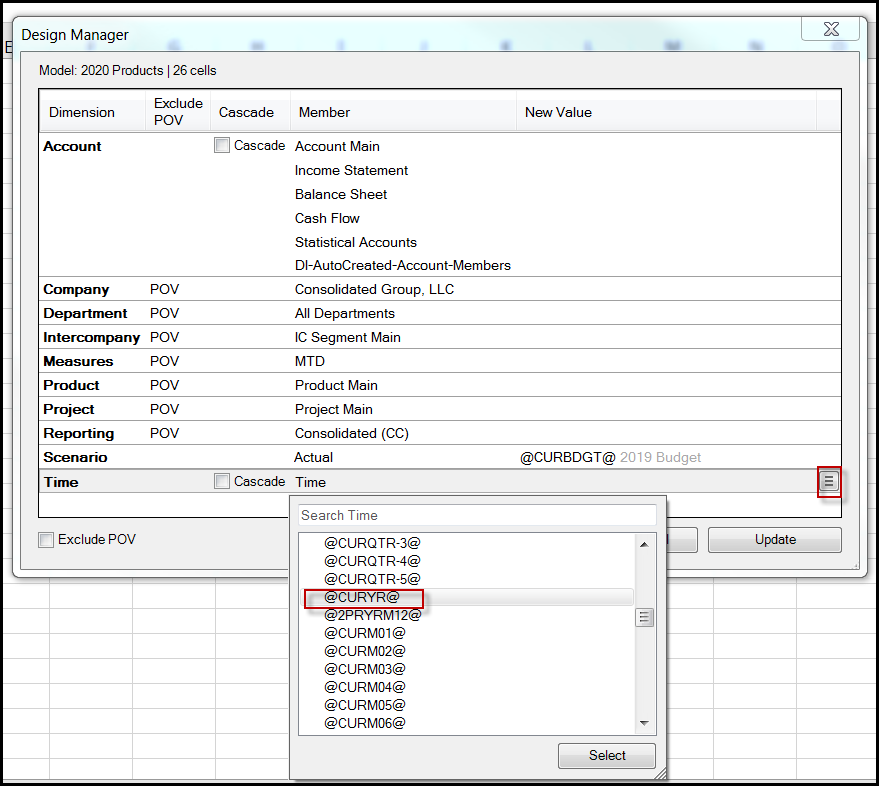
Click Update.
In the spreadsheet, select the column containing Q1 of the year.
Click Design Manager and scroll to the Time dimension. Select the same variable for the year as in step 5.
Before clicking Update, on the Time dimension, click the member selection icon again.
Select Expression.
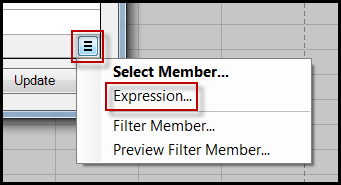
In the Expression box, click Add Function, then First Child.
Click Update.
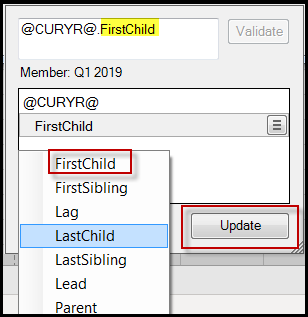
In Design Manager, you see the expression as the new value.
Click Update.
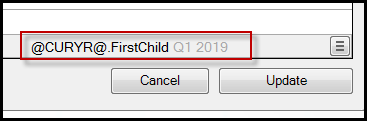
Repeat steps 7-14 for each column in the spreadsheet, modifying the expression as needed for the month and quarter to be represented. For example, @CURYR@.FirstChild.FirstChild for the first month of the year. For more examples of expressions, see Example Substitution Variable Expressions.
When done, save the report design.


Going forward, only the @CURYR@ variable needs to be set for the report to be updated.
In Practice: Derived Variables Used in a Report
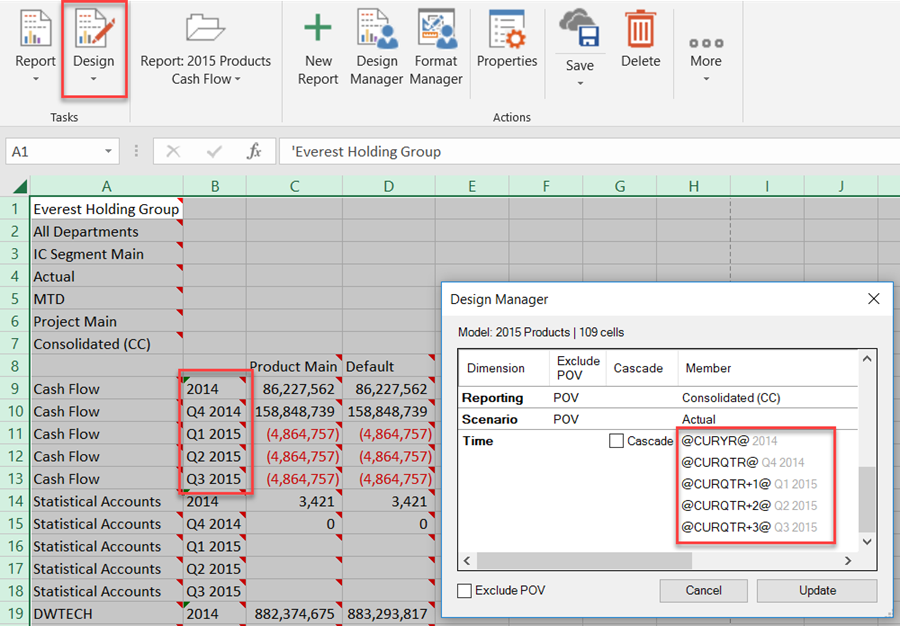
In this example a report is designed using the @CURYR@ and @CURQTR@ substitution variables and several derived substitution variables. Each substitution variable has a default value. For example, @CURQTR@ is Q4 2014. Derived substitution variable @CURQTR+1@ is Q1 2015.
When the user runs the report, they can click the Substitution Variables button to change the current year and current quarter.
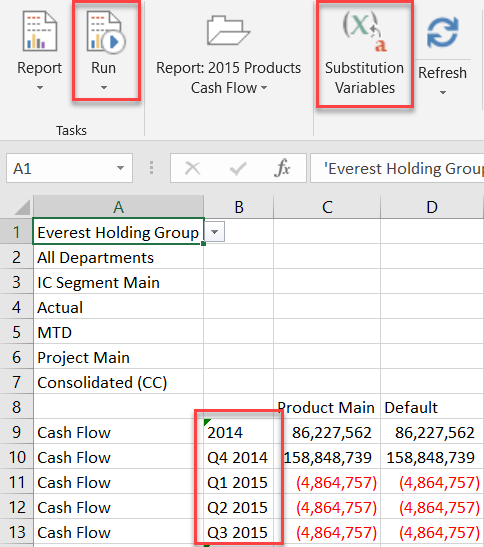
Users are not given the option to change derived substitution variables, such as @CURQTR+1@.
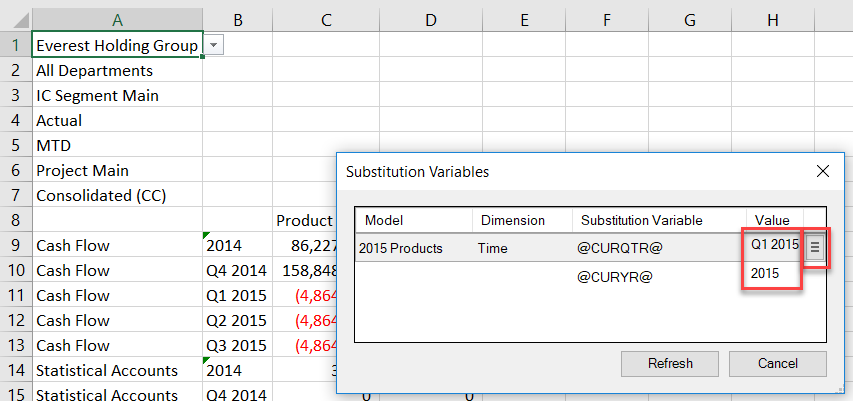
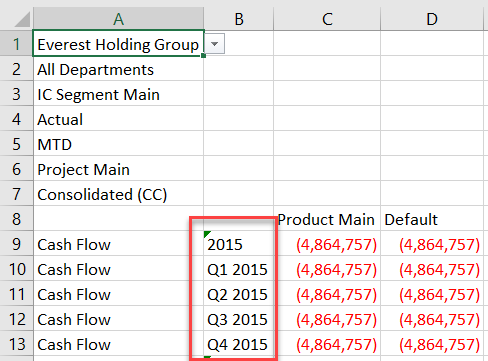
When done, click Refresh to see the changes. By changing @CURQTR@ to Q1 2015, the derived substitution variables automatically change; for example, @CURQTR+2@ is now Q3 2015.
Using PCR Substitution Variables and Derived Variables in Reports at Runtime
Once you have added Substitution Variables to the report design, you are ready to use them while running the report.
Note:
When running a report that includes Substitution Variables, the user can change the value of the substitution variables at run-time by clicking the Substitution Variables button on the menu bar. Note that users cannot changed derived substitution variables, only the standard variables.
In the report designed in the previous section, go to Report, Run. The current value of @CURYR@ is the basis for the Time columns. In the example below, 2017 is the current year. Click Substitution Variables on the ribbon to change the value.
Click the member selection icon, then select a different year.
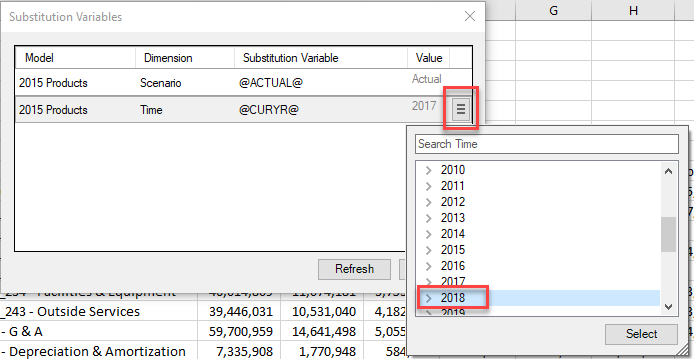
Click Select, then click Refresh. The data is refreshed for the selected year.
Reporting and Analysis Primer
If you have never created views in Spotlight, this section provides a primer.
In Practice
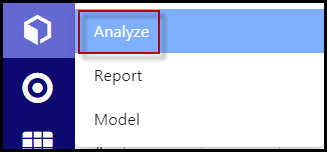
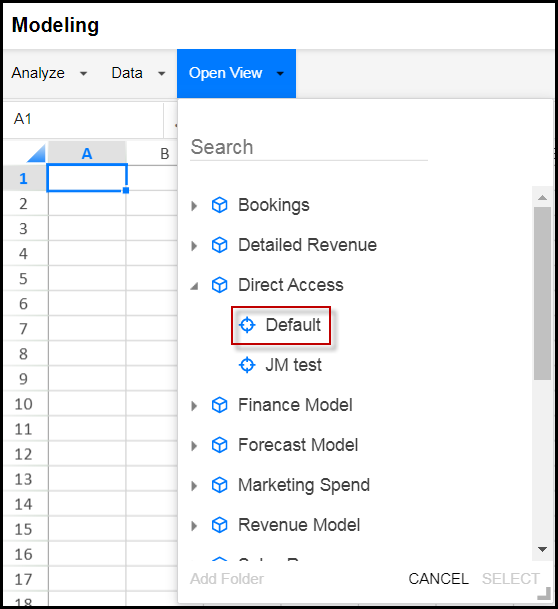
From the Model icon, select Analyze.
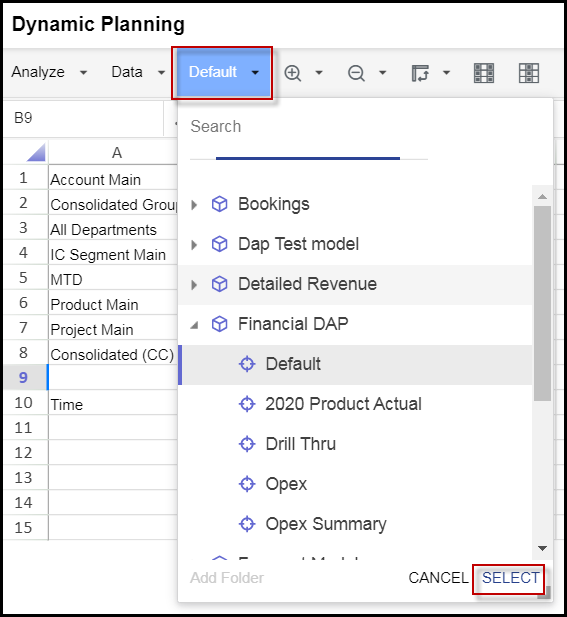
From the View drop-down, look for the model you just created, click the Default view, and click Select.
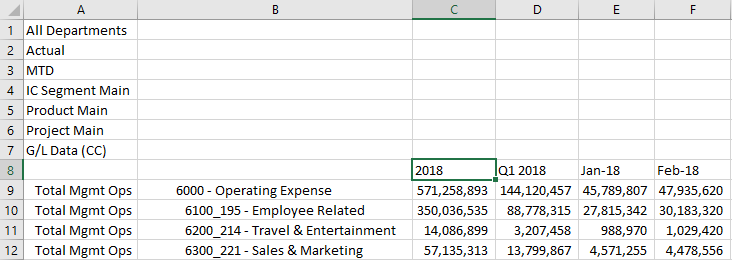
The default view shows all the dimensions in the model. These dimensions should be familiar to you because they come from the Financial Reporting Area.
You can select a dimension name, and then click Zoom In and Zoom Out on dimensions that appear as headings for the rows and columns.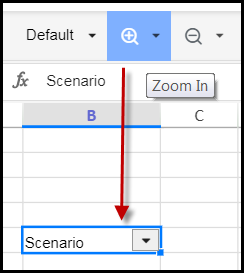
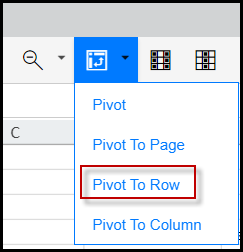
To move a dimension from the upper left into the row and column area, select the dimension, then select Pivot, Pivot to Row, or Pivot to Column.
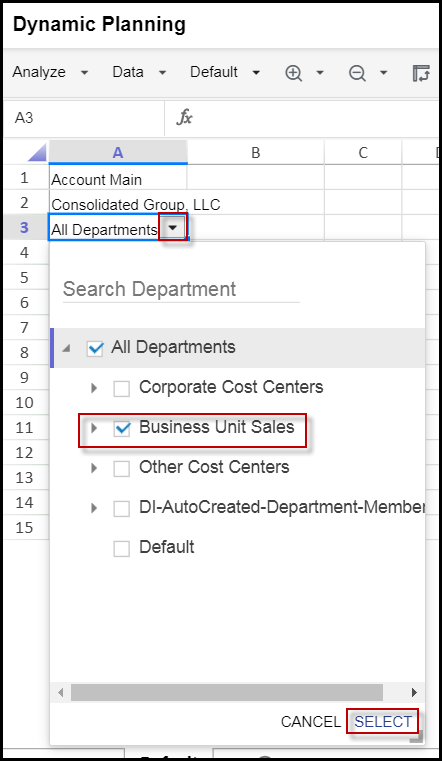
Click the drop-down next to a dimension to select a member of that dimension, then click Select.
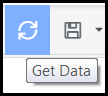
To refresh the data, click Get Data.
Continue placing dimensions where you want them on the report and clicking Zoom In or Zoom Out to refine the look of the view.
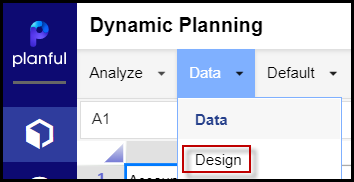
When you are done, click Design from the Data menu.
Click Save and give the view a name.
Click Data from the Data menu to exit Design mode.


You can create as many views as you want and save them as part of the model.
You can also create Reports, Excel Reports, and Snapshots from SpotlightXL.
Note:
There is no option for Save Data, Breakback, Drill-Through, or Calc on Save. This is because the model that connects to PCR is read-only from within Dynamic Planning. However, if you create a report that contains data from multiple models and one of those models is not connected directly to PCR, the data from that model can be saved.
Multiple POV Selections in SpotlightXL and Spotlight for Direct Connect Models
You can select multiple members of page filters for views and reports built on Direct Connect Models.
Note:
Multiple member selection for Direct Connect models works for Office reports (Excel, PowerPoint, and Word) as well.
This feature is available for all main, alternate, attribute and attribute hierarchies added to page filters. There is no restriction on the level or number or combination of members selected on each dimension.
In Practice: Selecting Multiple Members in a View in SpotlightXL
Open a view (Analyze > Data > Select the View).
Select the drop-down for a page filter. In this example it is the Department dimension.
Select all dimension members you want displayed by selecting the checkbox next to each. In this example, FIX and TAX are selected.
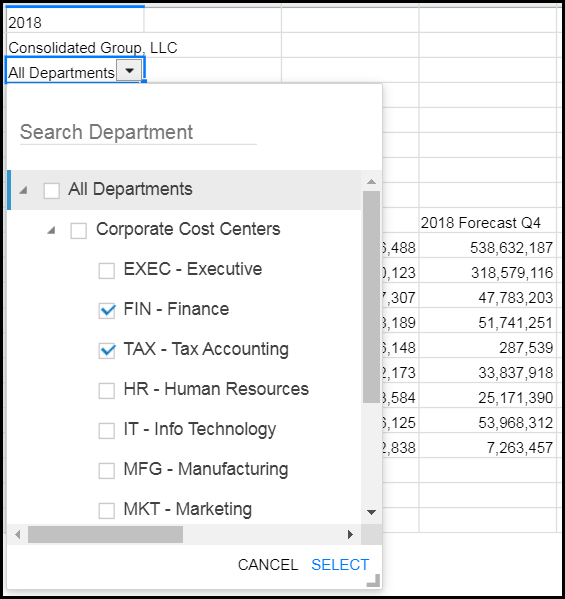
The selected members are displayed as comma separated values (as shown in the image below).
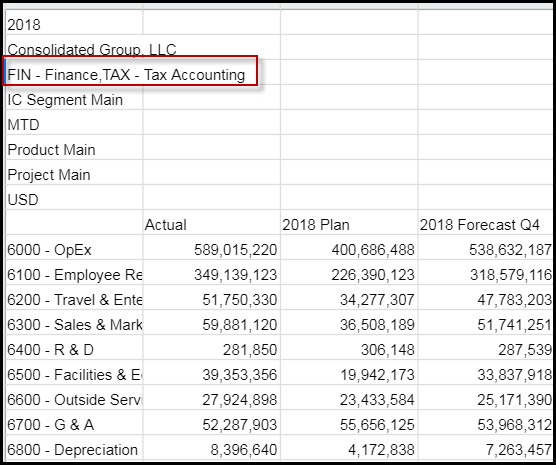


If you decide to move the dimensions from the page to a row or column, the dimension tree is updated intuitively to display the dimensions.
Once you move the dimensions selected from the page to a row or column, you can save the view as a report and run it.
Reporting Dimension Custom Labels Displayed in Direct Connect Models
Optional functionality that must be enabled by Planful! Custom labels created for Reporting dimension members and rollups can be shown in Dynamic Planning reports for Direct Connect models. This ensures consistency in member labels across modules.
Note:
Custom Label functionality is enabled by Planful. If you are interested in this functionality, please contact Support.
With Custom Label functionality, a value can be set for rollup members on the Reporting dimension, consolidated common currency, and consolidated local currency. Once the value is set, the Reporting dimension must be processed so that the updated values are applied in reports. Additionally, the Direct Connect model must be refreshed so that the updated values are applied.
Support for PCR Cube Default Members for System-Defined Dimensions in Views, Formatted Reports, and Excel Reports
Dynamic Planning honors PCR Default Members for the four system dimensions (Time, Scenario, Reporting, and Measures) in views, formatted reports, and Excel Reports. For example, 2019 can be defined as the default member in a Time dimension. Dynamic Planning will display the user-defined default dimension members when users create a Default View (Analyze Data) or New View (Design Data) in Views or when you create a new cell in a format or Excel Report. This feature makes it faster to see the dimension members that you are most interested in.
This support applies when viewing or reporting on models with Direct Access to PCR. It does not apply to Master models with traditional integration with PCR. To learn about converting a model with traditional integration to a Direct Access model, see Converting a Master Model into a Direct Access to PCR Model.
This support applies to both Spotlight and SpotlightXL.
In Excel Reports, this support applies only to SpotlightXL.
Creating Default Members
In Practice
Login to PCR.
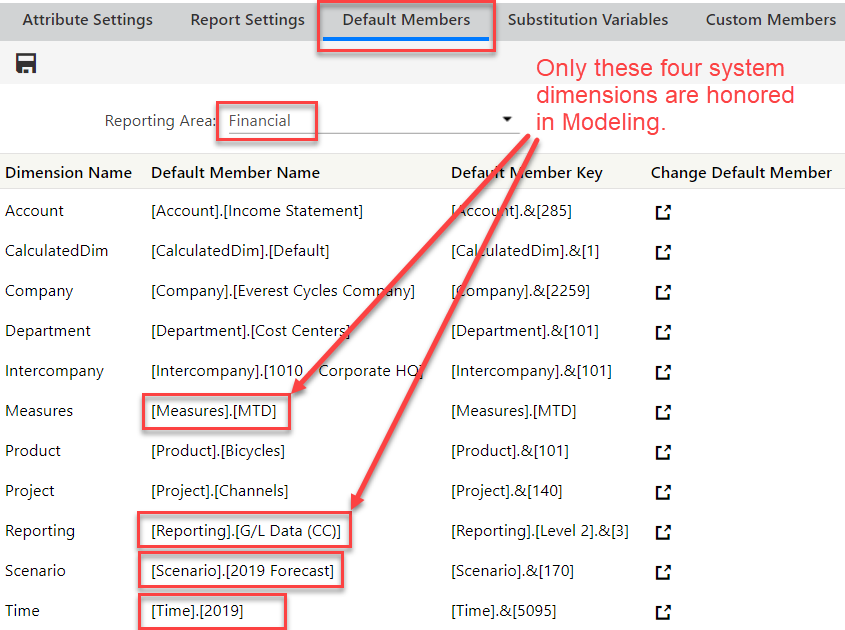
Select Maintenance > Reports > Cube Settings > Default Members.
Ensure that the Reporting Area is set to Financial.
For each dimension, select a default member to be displayed in your reports in PCR and new views in Dynamic Planning.
Although you may have a default member selected for every dimension, only the four system dimensions are honored in Dynamic Planning.

Using Default Members in a View on the Web
In Practice
Login to PCR.
Select Analyze from the Dynamic Planning icon.
Select the Direct Access model from the drop-down, and the Default view.
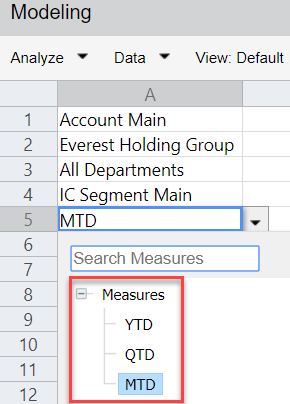
When the Default view appears, notice that the four system dimensions show their Default members. The other dimensions show their root member.
Note that default members do not limit visibility to the rest of the dimension. If you click on the dimension member, the rest of the dimension is still accessible.


Using Default Members in a Report in Excel
When creating a formatted report, typically you begin with a view and then convert the view to a report. In this case, all of the dimensions and members are already selected in the view before it is converted into a report. However, built into the Report designer now is the ability to see the default members when you create a new cell, as described below.
In Practice
Login to SpotlightXL.
Select Analyze > Data, and then select a model that has Direct Access to PCR.
Lay out the view as you wish and save it.
Select the Data menu, Design With, Report.
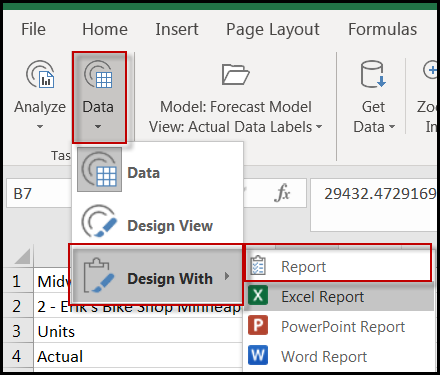
This opens the Report tab and displays the view with comments on each Spotlight cell.
Put your cursor on any blank cell and then click Design Manager. Notice that the four system dimensions have their default member selected by default for a Data cell.
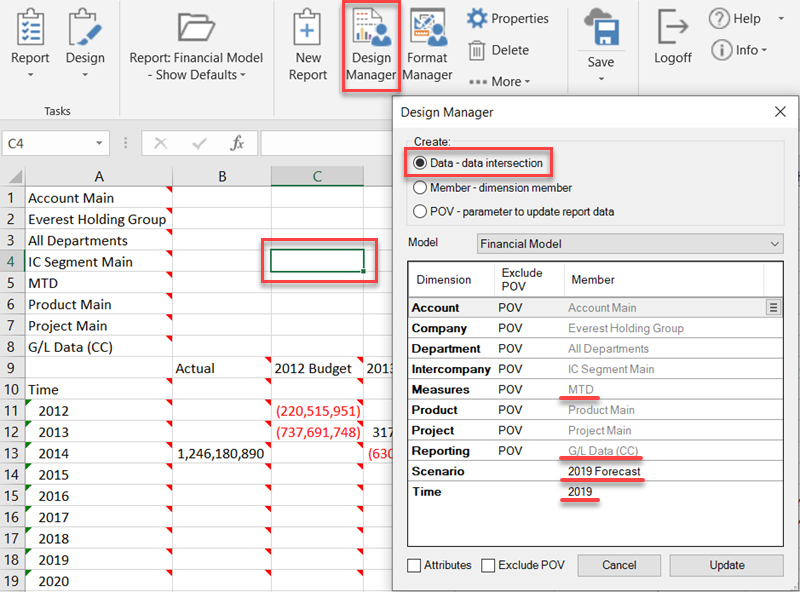
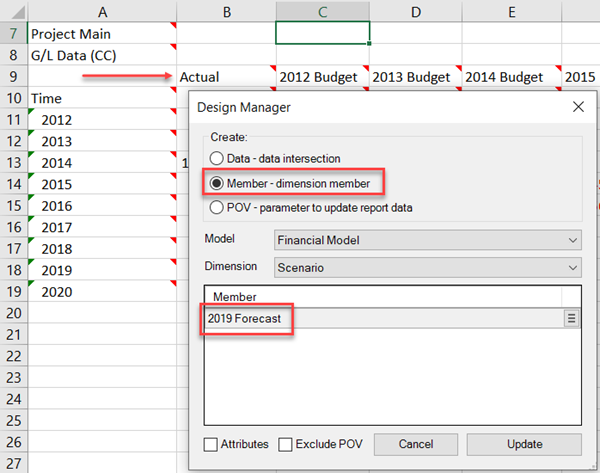
If you select Member, and then select one of the system dimensions on the row or column axis, again you see the default member automatically selected. You can use the member select icon to pick any other member of the dimension that you have access to. In the following example, Scenario is on the column axis and 2019 Forecast is selected by default.
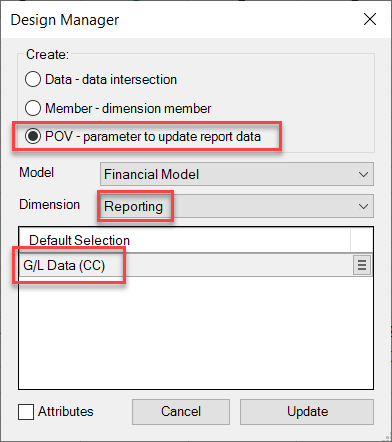
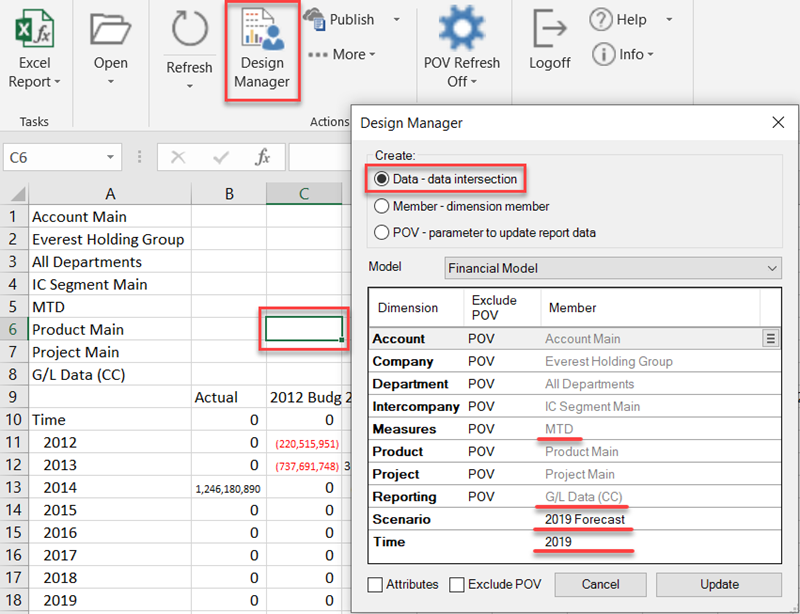
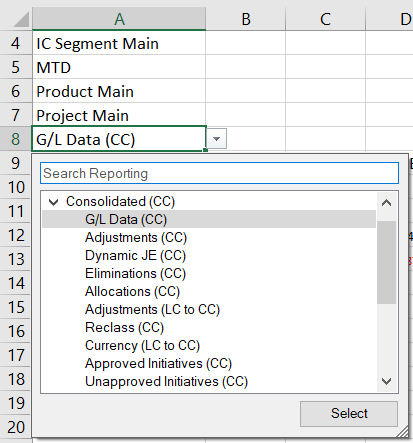
Similarly, if you select POV, and then select one of the system dimensions, you see the default member automatically selected. You can use the member select icon to pick any other member of the dimension that you have access to. In the following example, Reporting is a POV dimension and G/L Data (CC) is selected by default.


Using Default Members in an Excel Report
When creating an Excel Report, typically you begin with a view and then convert the view to an Excel Report. In this case, all of the dimensions and members are already selected in the view before it is converted into the report. However, built into the Excel Report designer now is the ability to see the default members when you create a new cell, as described below.
In Practice
Login to SpotlightXL.
Select Analyze > Data, and then select a model that has Direct Access to PCR.
Lay out the view as you wish and save it.
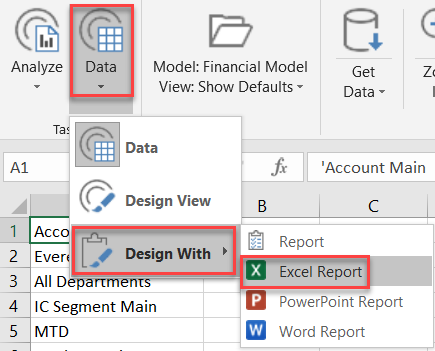
Select the Data menu, Design With, Excel Report.
The view is converted to Spotlight formulas, and a new tab appears, named by the view, which displays the Excel Report with #REFRESH on each data cell.
Click Refresh to update the data.
Put your cursor on any blank cell and then click Design Manager. Notice that the four system dimensions have their default member selected by default for a Data cell.
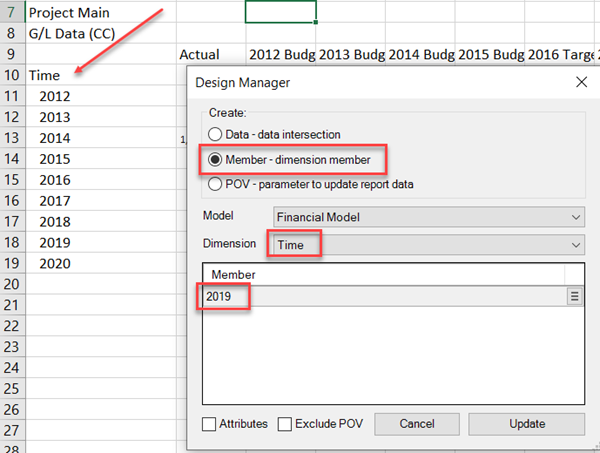
If you select Member, and then select one of the system dimensions on the row or column axis, again you see the default member automatically selected. You can use the member select icon to pick any other member of the dimension that you have access to. In the following example, Time is on the row axis and 2019 is selected by default.
Similarly, if you select POV, and then select one of the system dimensions, you see the default member automatically selected. You can use the member select icon to pick any other member of the dimension that you have access to. In the following example, Reporting is a POV dimension and G/L Data (CC) is selected by default.


Dimension Member Visibility
Default members do not limit visibility to the rest of the dimension. If you click on the dimension member, the rest of the dimension is still accessible.
Limitations
This support is only for models with Direct Access to PCR.
In views, this support applies only to creating a new view. From Analyze Data, select the Default view. From Analyze Design, select New View. If there are existing views on the DAP model, Dynamic Planning assumes you laid out the view the way you wanted it and will not modify it to use the default members for any dimensions on the view.
In reporting, this support applies only to creating a new cell in a formatted report or an Excel Report.
This support applies only to the four system dimensions: Measures, Reporting, Scenario, and Time.
Support for Drill Through in Direct Connect Models in Both SpotlightXL and Spotlight
Drill through a Direct Connect model report to retrieve the following source data:
Transactions
Translations
Operational Planning data
Structured Planning data in shared mode enabled applications
Seeding (preloaded) data for Preloaded & Forecast scenarios
Closed Periods data for Forecast scenarios
Capital and Workforce Planning data
Consolidation data
GL data loaded via Data Load Rules
Drill through is enabled in your reports for a data cell where dimensions, attributes, attribute hierarchies, main hierarchy, alternate hierarchies and substitution variables are used. However, drill through is not supported if multiple Scenarios or multiple members on any other dimensions are selected on the page filters (the ability to select multiple scenarios on the page filter is a feature available with this release). All drill through reports honor Dimension Security with the exception of Workforce drill through data, which additionally honors Budget Entity and Template Access by default.
Drill Through Grid Interaction in Spotlight
When you perform a drill through from a model view, you can interact with the resulting Drill Through report in the following ways:
Drag and drop a single column, a range of columns, or multiple columns to reorder them
Adjust the width of a single column, a range of columns, or multiple columns
Turn filters on or off
Sort column data in ascending or descending order
Select the code, name and label display for members
In Practice
Open a view by navigating to Analyze > Data and selecting a view.
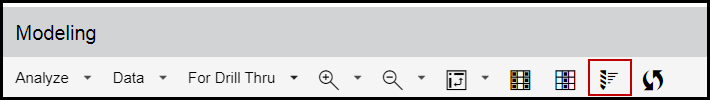
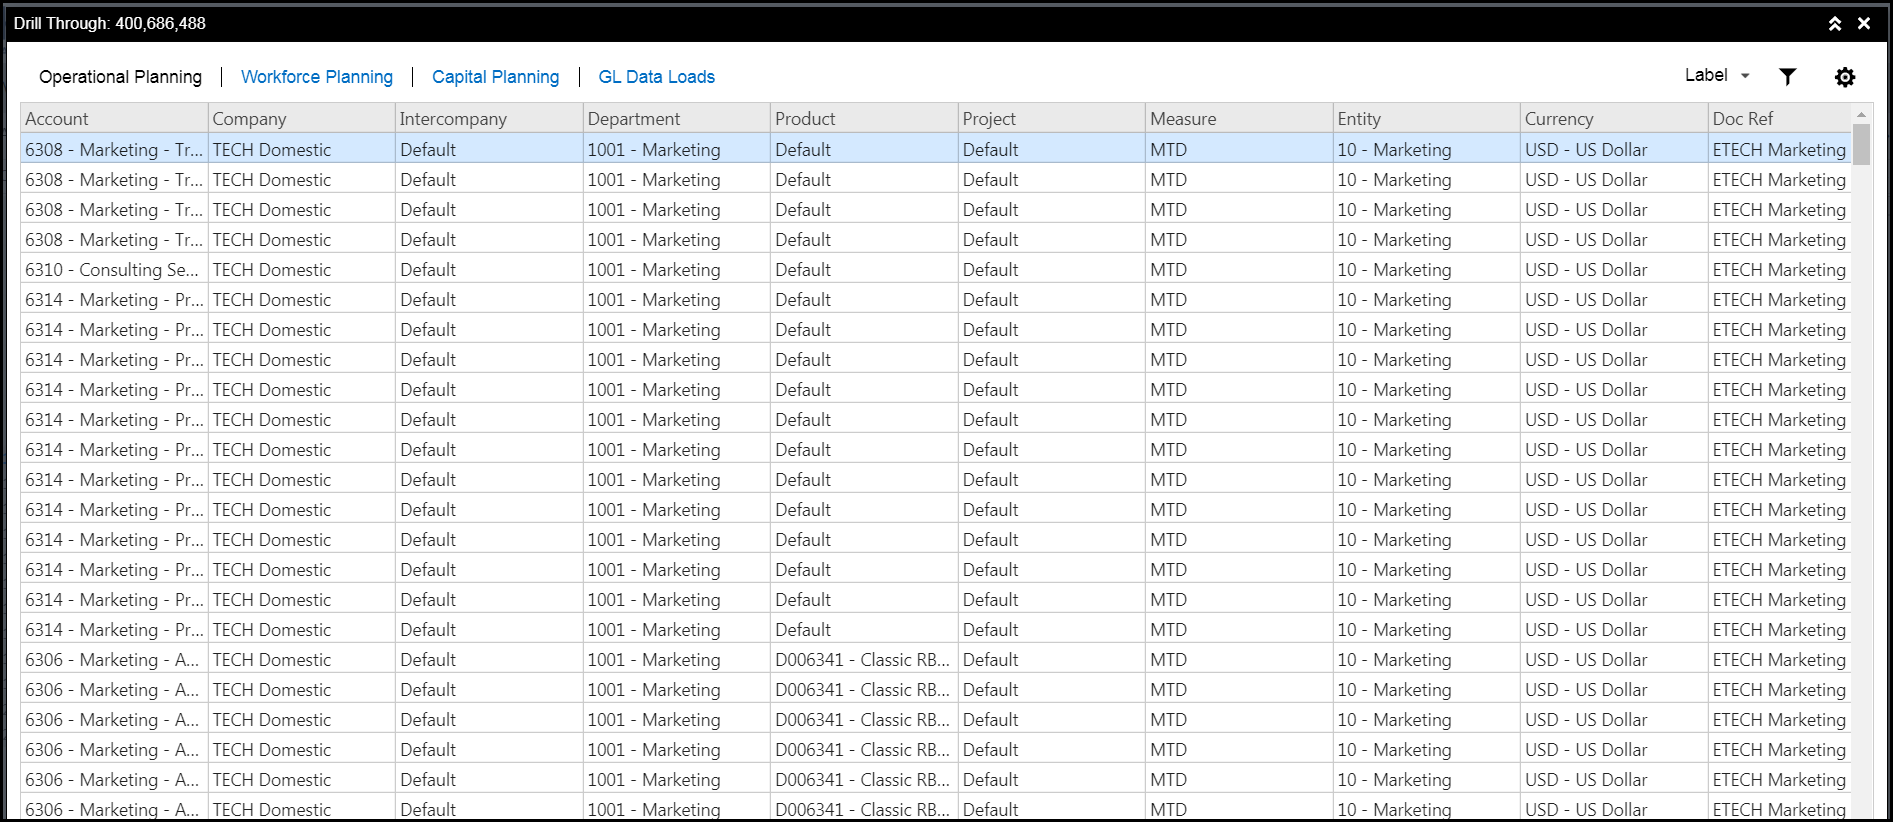
Click the Drill Through icon as shown below. The Drill Through report is displayed.
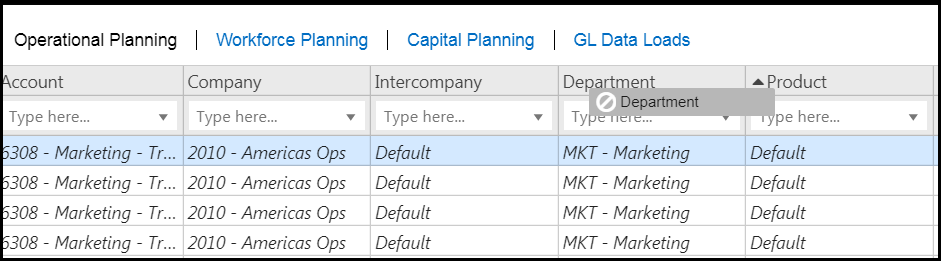
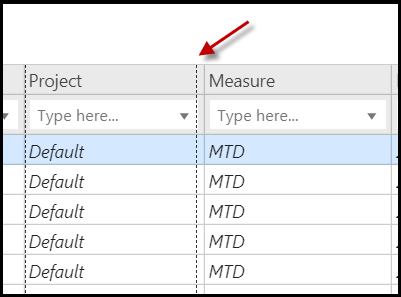
Select a column or columns to reorder and drag and drop as shown in the image below.
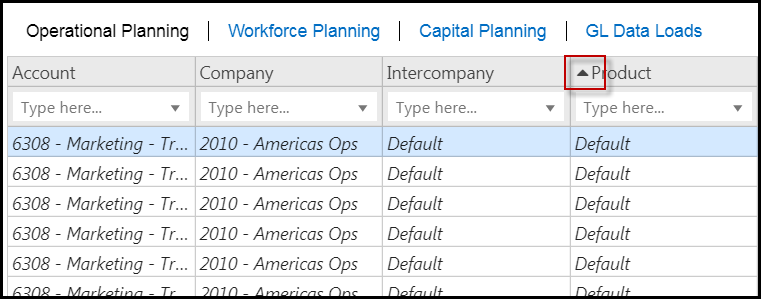
Sort the column in ascending or descending order.
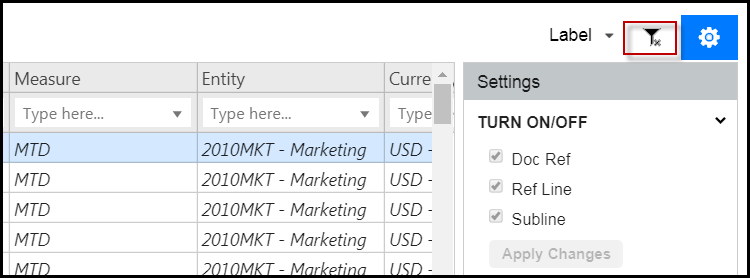
Turn filters on or off.
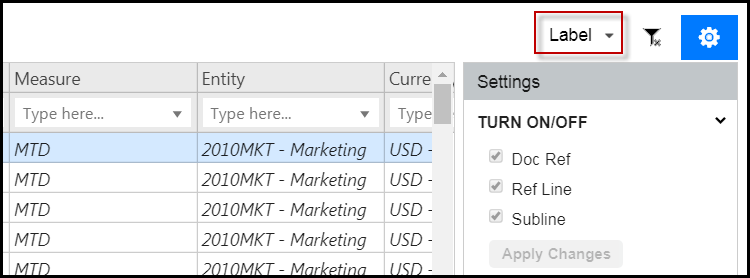
Display dimension members by code, name or label (the default is set to label which is name+code). If you change the default to code in the Reporting module, for example, and save then the setting is retained when accessed via Spotlight. You cannot save the setting from Spotlight.
Adjust column width as needed.
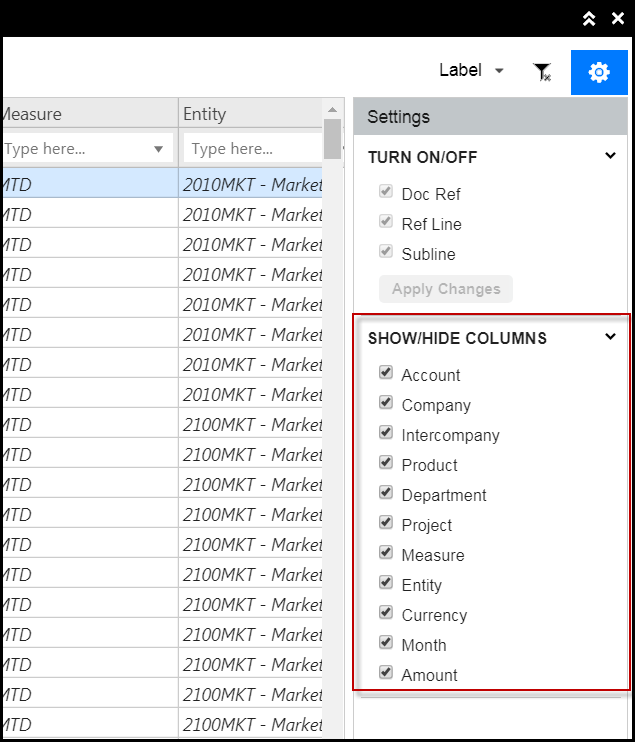
Select to display or hide specific columns.
For information on Doc Ref, Lines, and Sublines, see Dynamic Reports: Enhanced Drilling on Dynamic Report Output


Important Details:
Data is displayed in the same currency and formatted as loaded or upon input into the application for QTD and YTD or multi-currency calculations in Drill Through reports,
Subline amounts are stored in local currency and currency conversions do not exist.
Calculated members, calculations, and Excel formulas, are not supported in Drill Through reports.
All template types are supported except for Template based HR, Actual Data Template, and Initiative templates.
Drill Through is not supported with Multiple POV on a cell.
Maintenance Options
None of the following maintenance options are mandatory. They are provided for your information and convenience.
Backup and Restore
Power users have the option to use Backup and Restore for the model with Direct Access to PCR. Although no data is stored in the model, any views or reports that you create are stored with the model and are included with the backup.
See Dynamic Planning: How to Backup a Model and Dynamic Planning: How to Restore a Model for more information.
See also Converting a Master Model into a Direct Access to PCR Model.
Hierarchy Updates
The hierarchy in your Financial Reporting Area likely changes regularly.
Automatic Updates
Whenever the hierarchy in PCR changes, the changes are automatically pushed to Dynamic Planning. In PCR, when the Power user changes the hierarchy and clicks Save, a refresh calculation is automatically triggered in Dynamic Planning. The next time a view or report is run, the user just clicks Refresh or Get Data to see the changes.
Manual Updates
Power users and Contributors have the option to manually refresh the model in Dynamic Planning with metadata updates from PCR. This is done automatically in the background. However, if you want to refresh manually, you can run the refresh calculation. (This calculation is created automatically when the model is generated and has the same name as the model. You can view it if you want to understand how refresh works, or you can run it.)
In Practice
Login to SpotlightXL.
Select Model > Calculation.
Select the model name from the Model drop-down.
Select the calculation from the Calculation drop-down. There should be only one calculation, named for the model name followed by "Refresh."
The calculation already contains all the commands for refreshing the model.
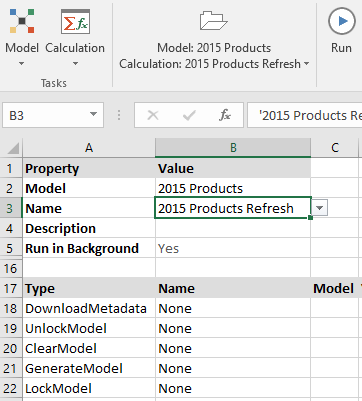
Click Run to run the calculation.
Click Refresh a few times until you see the status as "Calculation completed" in the Current Status field.

Note:
Power and Contributor users can run the calculation from Model Manager in Spotlight also.
Information for Experienced Power and Contributor Users
More details about metadata download:
Before the model with Direct Access to PCR can be created, you must perform a Metadata Download. Note: If you have other models that use traditional integration with PCR, you have probably done Metadata Download before. However, you can ensure that HACPM_Financial is up-to-date with recent metadata by running the Metadata Download.
Metadata Download generates the source model called HACPM_Financial. This is a reserved model that cannot be modified or deleted. You can view its dimensions and members in Spotlight or SpotlightXL.
More details about creating the model:
When you create the model, as soon as you click the option for Direct Access to PCR, the dimensions are automatically populated. There are no options for Key and Value types because the data is not being stored in Dynamic Planning. As a best practice, do not rename any of the dimensions at this time. If you do, the map will not be automatically created for you.
When you click Save after creating the model, a Map is automatically created (as long as no dimension names were changed). The Map is defined by default to download All Members for all dimensions. If you want to limit the amount of data available to the user, you can modify the Map before the model is generated. When you modify the map, you can filter certain dimensions to limit the amount of data being retrieved. You cannot limit the amount of data after the model has been generated for the first time.
See How to Edit a Metadata Map for Direct Access to PCR.
Note:
When you are first working with a model connected to PCR, you can download All Members of all dimensions and then get to know how to use Dynamic Planning. When you begin working on specific business use cases, then you can optionally modify the map to include the metadata only for the slices of data that you want.
You cannot modify the Map Type. The map type is Metadata.
Data dimension security that is defined within PCR is honored by Spotlight. However, all metadata for the Financial cube is visible to the users in Spotlight, with the exception of the Scenario dimension. For example, if a user has access only to the East region, they will see all the other regions in the Dimension list boxes but will see only data for the East region. Users will only see the scenarios that they have been given access to in PCR (Maintenance > Admin > User Management > select user > edit user > More > Scenario Access).
More details about generating the model:
Before the model is generated, the menu options available for the model are the same as for normal models in Dynamic Planning. The available menu options are Generate and Delete Model.
After the model is generated, the menu options available for the model are different than for normal models in Dynamic Planning. The only available menu option is Clear Model. Lock Model is not available because the model is automatically locked after it is generated and cannot be unlocked.
When the model is generated, it is of type Master.
When the model is generated, a calculation is automatically created that serves to refresh the model. The calculation contains commands to Download Metadata, Unlock Model, Clear Model, Generate Model, and Lock Model. Normally, you do not need to use this calculation, but it is created as a convenience in case you want the ability to manually refresh the metadata in the model.
When viewing Application Statistics, the model will have 0 records and 0 bytes of data storage used because the data is not stored within Dynamic Planning. Dynamic Planning stores only the metadata that you want to use, as defined in the map, and any views or reports that you create.
After the model is generated, it cannot be converted back to a regular model without Direct Access to PCR.
More details about modifying models with Direct Access to PCR:
You can use the Model menu commands to view Dimensions, Map, Calculation, Model Lookup, and Model Validation.
There is no need to run an aggregation calculation or any other calculation on the model because the model retrieves all data directly from the PCR financial reporting area.
You cannot save data on the model because the model is read-only and is to be used primarily for analysis and reporting.
You cannot run Breakback on the model because the model is read-only and is to be used primarily for analysis and reporting.
You cannot create or use formulas, maps, scopes, calculations, import/export, data (load), or external data source loads on the model.
You cannot modify model permissions.
You cannot add additional dimensions to the model.
You cannot write back data from Dynamic Planning to PCR.
More details about data retrieval and performance:
When Dynamic Planning connects to PCR for data retrieval, it retrieves data according to the metadata map that was created when the model was created and generated.
Data is retrieved at runtime. Metadata is retrieved when the model is generated, when the refresh calculation is run, or when a user clicks Save after changing the hierarchy in PCR.
The performance of data retrieval will be comparable to the performance when using PCR dynamic reports.
If you want to move data from PCR into Dynamic Planning, use the traditional method as described in Dynamic Planning: Integration Admin Guide.
There is no limitation to the size of reports that can be created. (Views are limited by the Excel Analysis Cells count in Application Settings.) If you create a very large report, however, performance will degrade and users may experience a time out.
Change Data Tracking is not available on this model because the model is read-only and is to be used primarily for analysis and reporting.
More details about limiting the size of the model and deleting the model:
Before deleting a model, consider making a backup, otherwise you will lose any views or reports that you have created. User Manage > Application Administration > Model Backup/Restore.
To delete a model with Direct Access to PCR, go to Model, Setup. First click Clear Model, then Delete. Beware that this operation also deletes all views and reports that the user had created.
If you find that the data in the model is too cumbersome to wade through, you can limit the amount of data that is retrieved. It is helpful to include only the data needed for your business analytic needs. While there is no way to go back and limit the metadata after the model has been generated, it is simple to create another model, specify Direct Access to PCR, and then modify the map to scope the model down to a smaller size before generating the new model. See How to Edit a Metadata Map for Direct Access to PCR.
Converting a Master Model into a Direct Access to PCR Model
Click Converting a Master Model into a Direct Access to PCR Model for information.
Was this article helpful?