Signals Context Pop-up
- 4 Minutes to read
- Print
- DarkLight
- PDF
Signals Context Pop-up
- 4 Minutes to read
- Print
- DarkLight
- PDF
Article summary
Did you find this summary helpful?
Thank you for your feedback
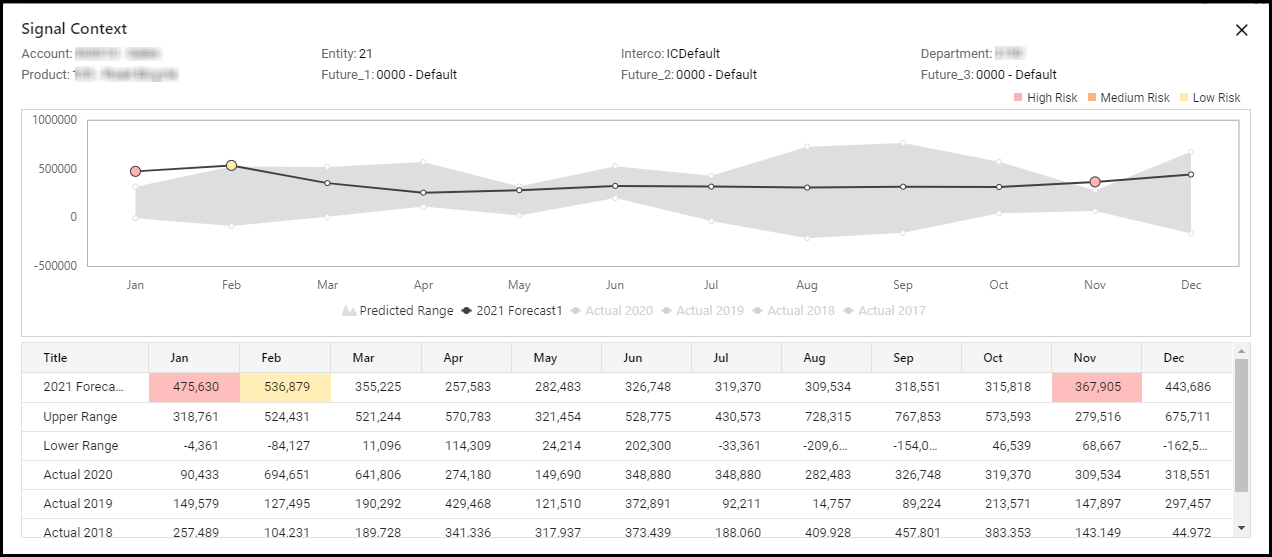
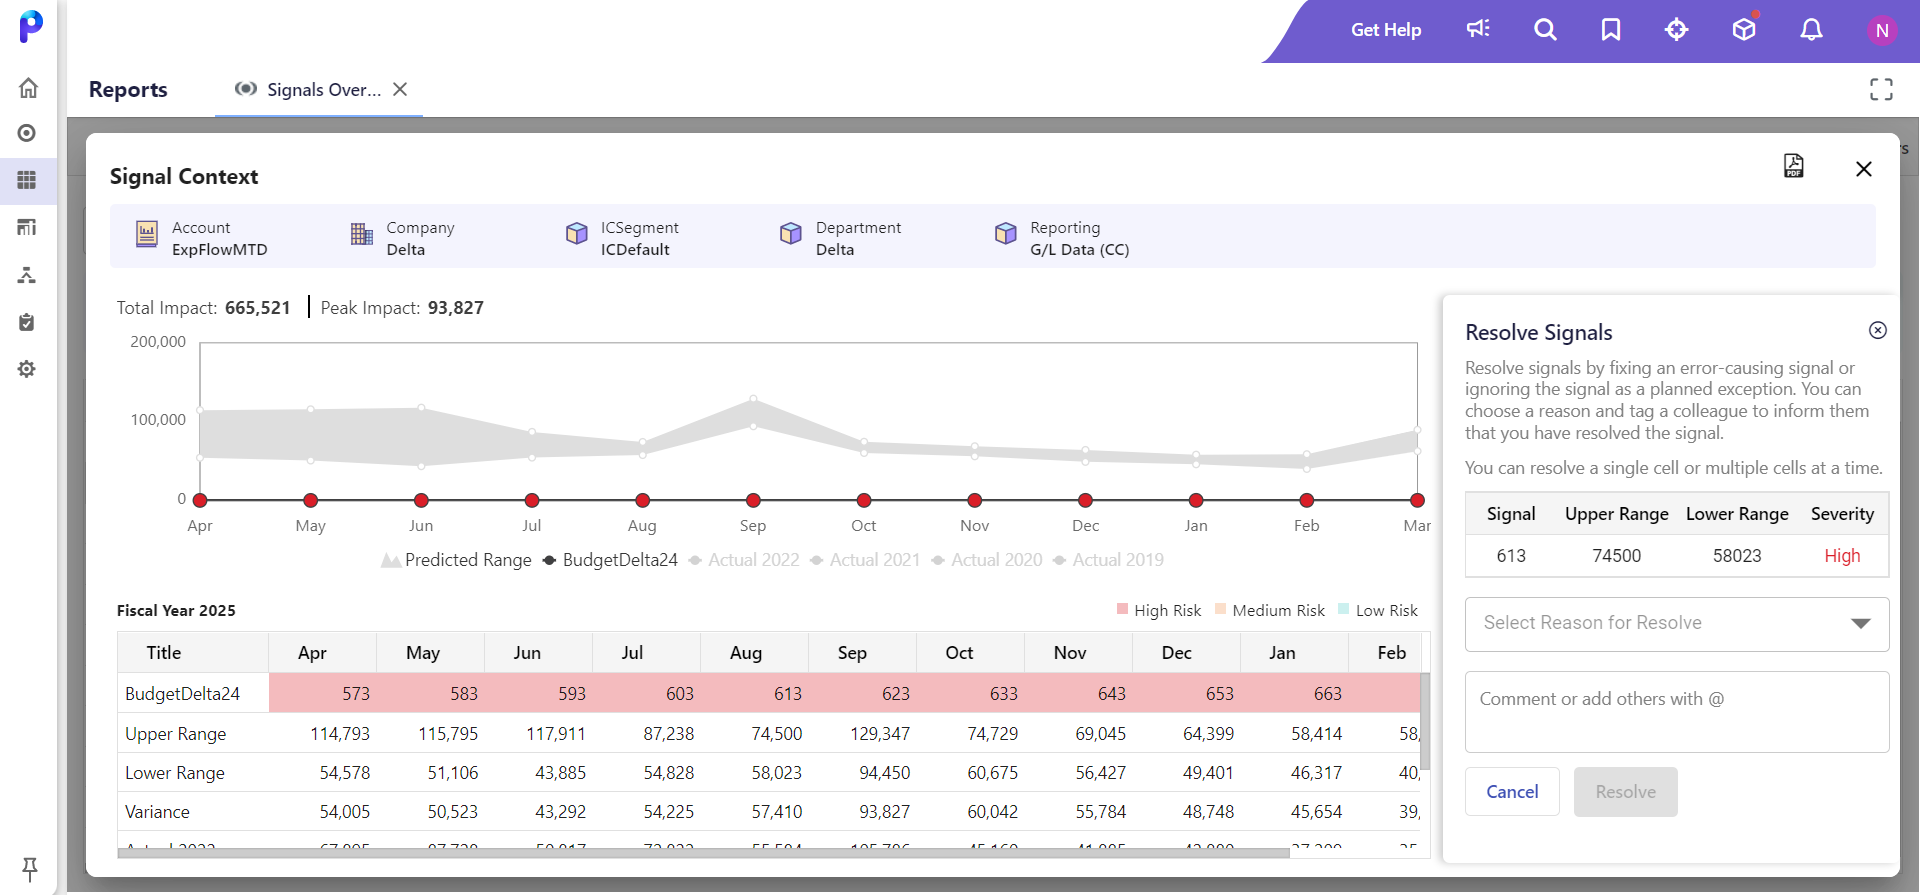
When you are on the Signal details grid, you can click any row in the grid to view the corresponding signal's context. A pop-up is displayed containing the signal's entire dimensions, a data table, and a graph that showcases all the required information on the signals. The Data table contains:
The Budget/Forecast scenario for the entire fiscal year of the selected row.
The upper and lower ranges generated by the AI engine.
The historical actuals used for Model Training.
Note:
The historical actuals are displayed only up to the past six years.
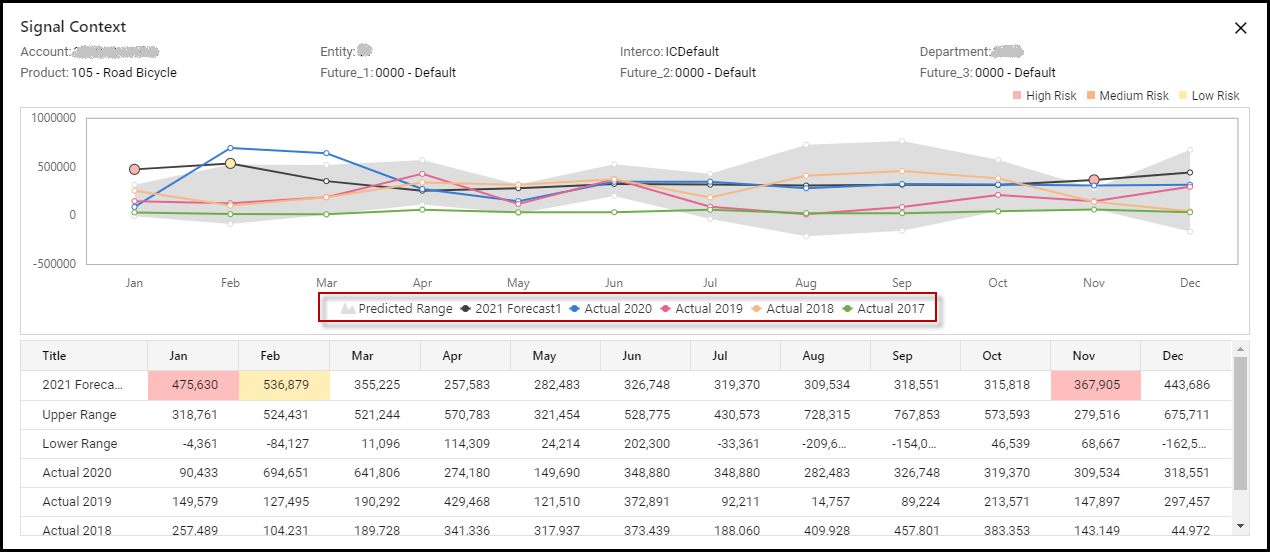
The graph displays the same information visually intuitively, which justifies why it was marked as a signal. By default, the graph has the upper and lower ranges and the forecast scenario, but it lets you see the historical actuals on it by clicking on the actual data label displayed below the graph. The pop-up displays data for all the months in the entire fiscal year to demonstrate the trend and seasonality present in the data; this helps understand the signal better.
This functionality provides you the ease of viewing the data trend of a selected dimension for the entire fiscal year and comparing it with the historical actuals. You can view actual data for multiple years and view their trend along with the selected scenario, upper range, and lower range. It gives you a better understanding of every Signal.
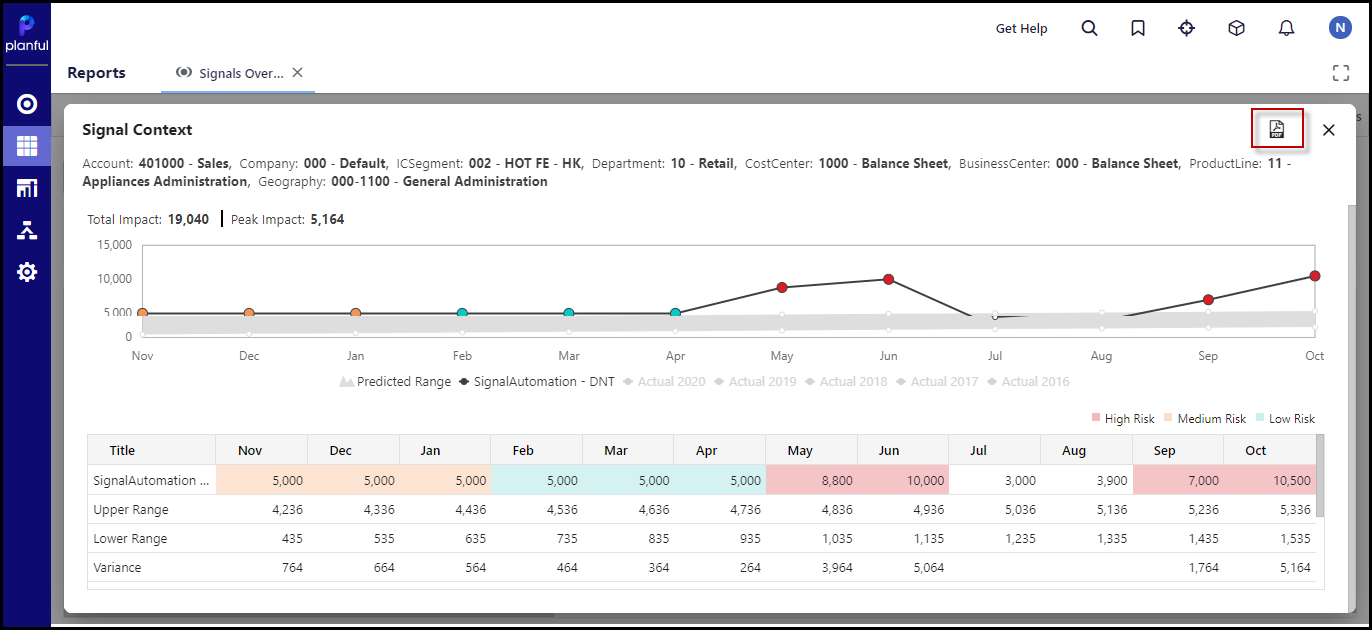
You can click on the PDF icon available on the Signal Context screen to download a snapshot of the signal context that you have chosen. This provides you with the flexibility to view and analyze the signal context offline and thereby reduces the dependency on application availability.
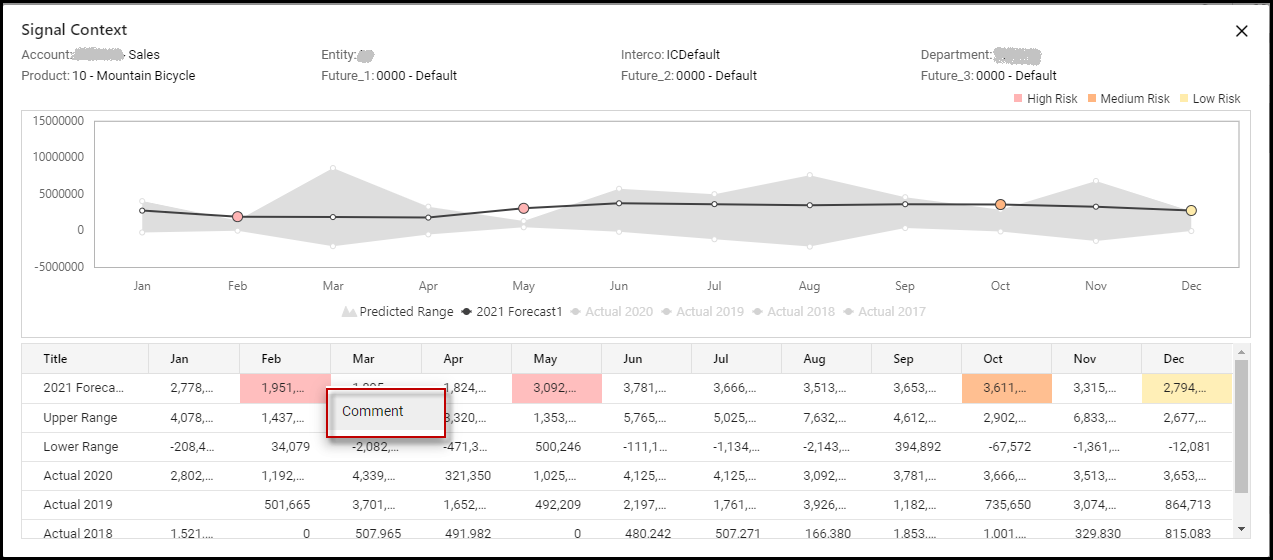
Dynamic Commentary
You can right-click on any cell in the first row (scenario row) of the Signal context table and provide a comment specific to that cell. This functionality helps you collaborate with colleagues or peers to collectively address potential anomalies.
You can also type '@' or ‘+’ and mention the name of the colleague you would like to collaborate with.
Note:
The collaborator should be an active user of the Planful application.
You can choose to assign the comment as a task to a collaborator.
Once you have commented on a cell, a blue comment icon will appear on the top right corner of that cell. You can click that icon to view the comment trail on that cell.
Only the assignee of a task can mark it as complete. Only the creator of the comment can delete the comment. Once a comment has been resolved, the blue comment icon will automatically disappear from the cell.
In Practice: Dynamic Commentary
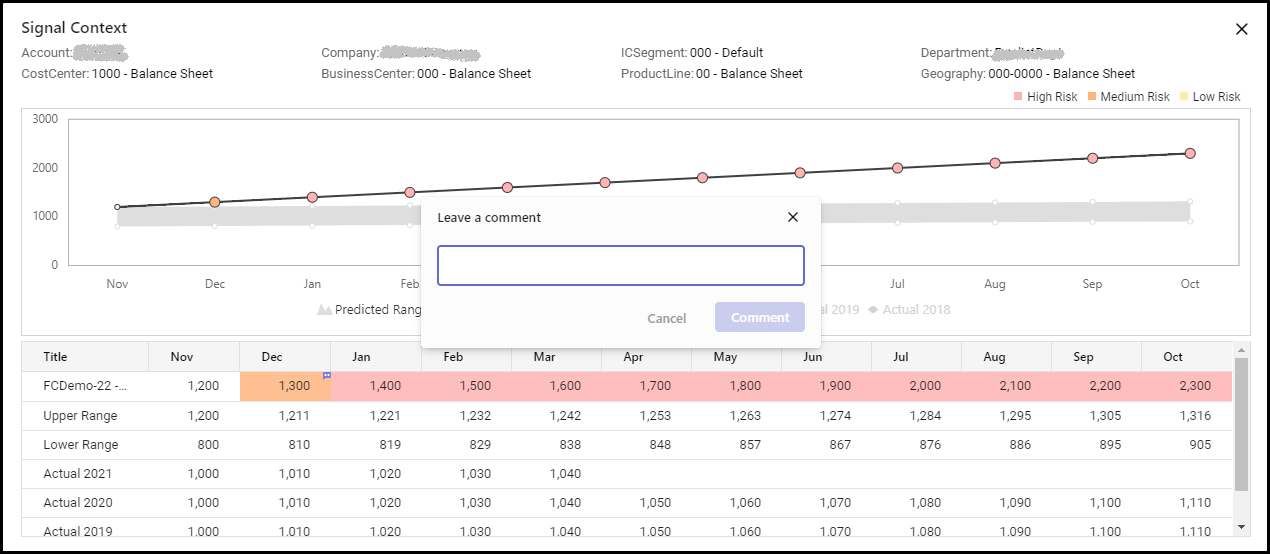
Go to the Signal Context pop-up of any Signal. Right-click on any cell of the scenario row where you want to add a comment.
Click Comment. The Leave a comment pop-up appears.
You can leave a comment or add other collaborators by using +. You can use + to mention a collaborator on a comment or assign a comment as a task to the collaborator.
After typing "+" and the starting alphabet of a username a drop-down list of all the active users whose names begin with that alphabet is displayed.
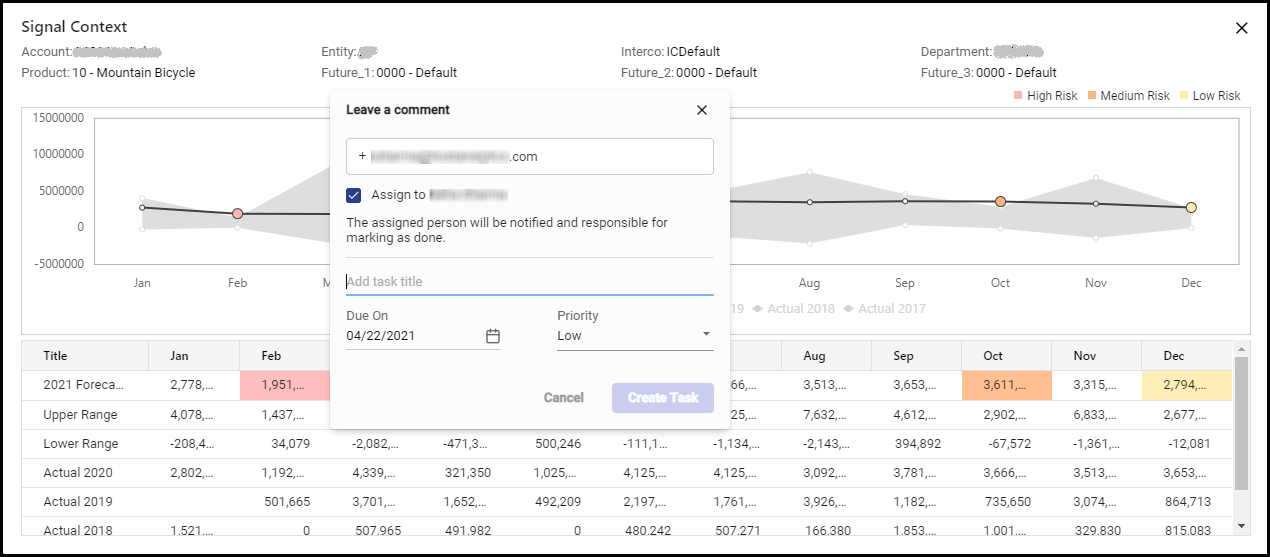
Note:The collaborator should be an active user of the Planful application.If you choose to assign a task to a collaborator, you need to do the following.
- Enable the Assign to <username> checkbox
- Fill in the following details:
- Title of the task
- Due date of the task
- Priority level of the task
Once you have filled in these details, you can click Create Task . You can view the task in the Task Manager.
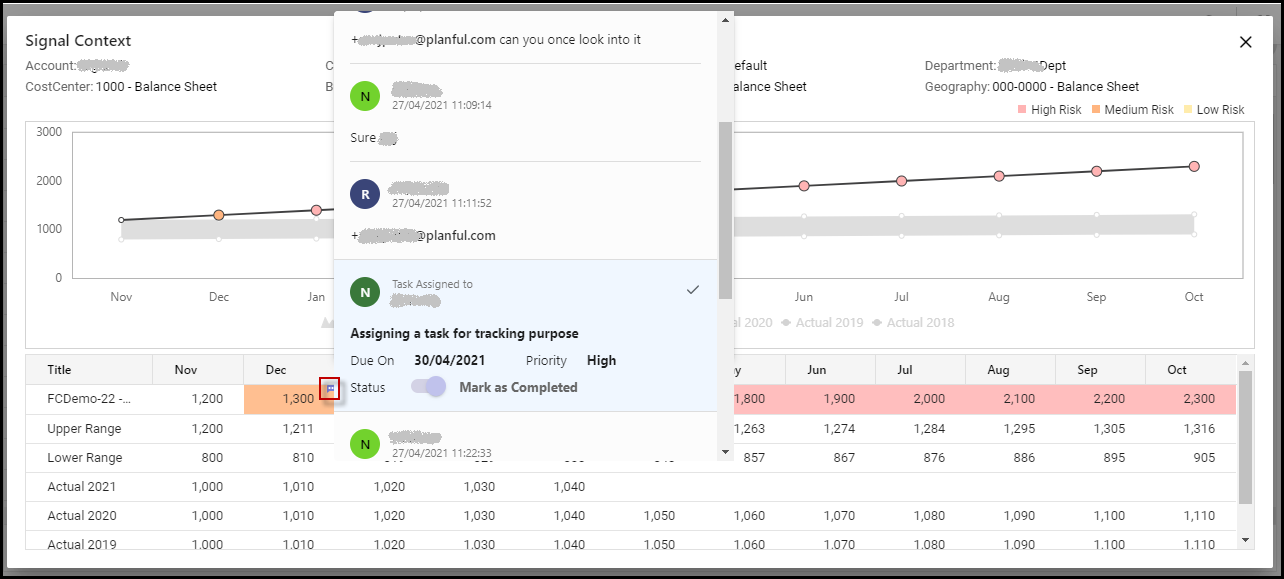
Or, if you choose to leave a comment by just mentioning the user without assigning any task, you can click Comment.
A blue comment icon will appear on the top right corner of that cell. You can click that icon to view the comment trail on that cell.
Drill Through functionality
You can right-click on any Signal in the Signal Context screen to view the Drill Through option. This allows you to view and analyze all financial, operational, capital, workforce, and transactional data for that Signal from a single place.
For more information on the drill through functionality, refer to Enhanced Drilling on Dynamic Report Output.
In Practice
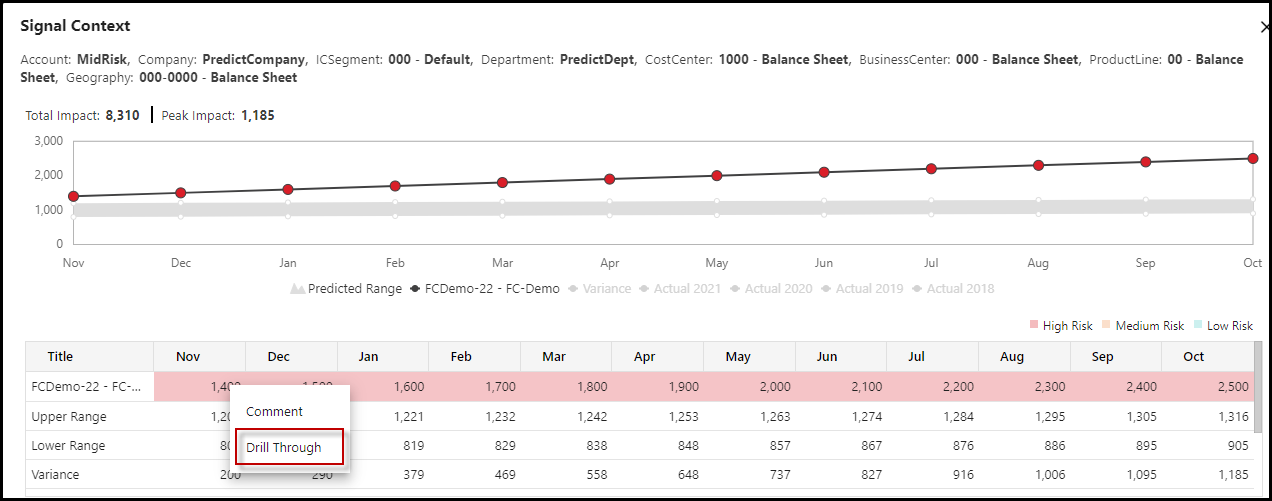
Go to the Signal Context page. Right-click on the Signal for which you want to view the Drill Through.
Click Drill Through.
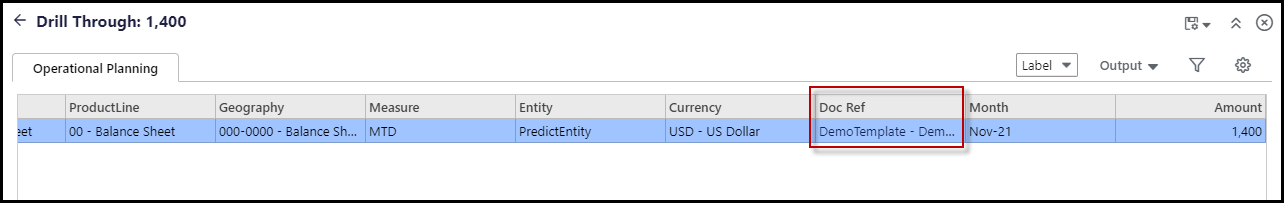
The Drill Through page is displayed with the all data tabs to display the GL combination.
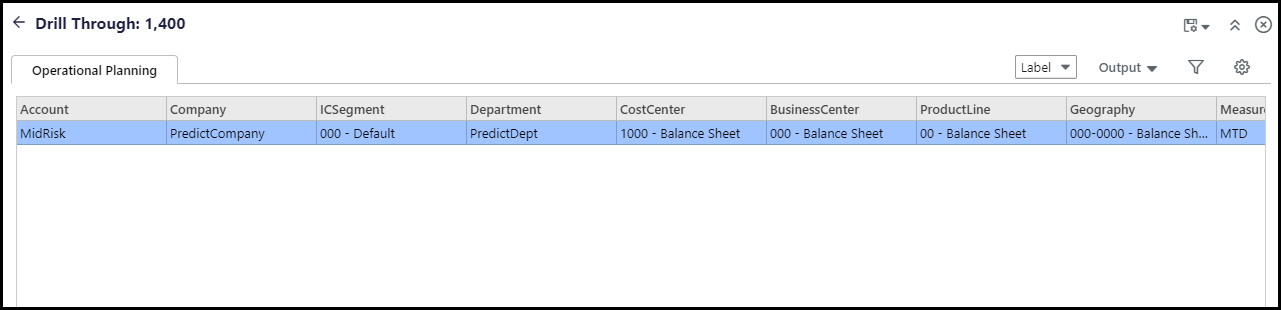
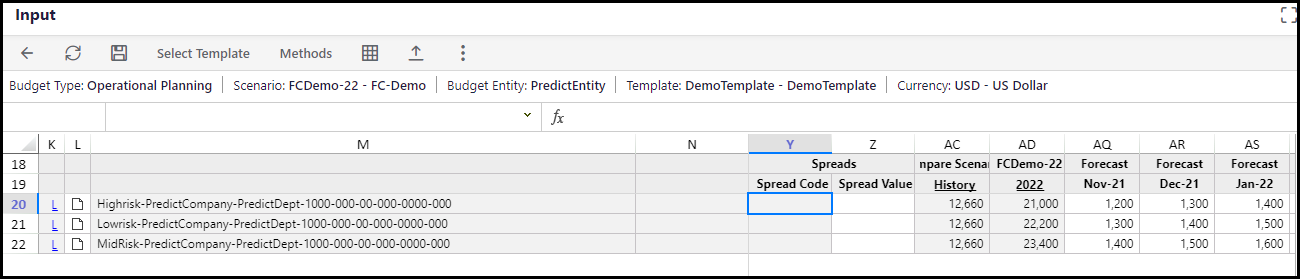
Click on the reference given under the Doc Ref column, and you will be redirected to the input sheet from where the data for the selected GL combination is stored.
Resolve Signals in the Signal Context Screen
Resolve signals for single or multiple cells in the Signal Context screen of Signals Overview, Dynamic Reports, and Templates.
In Practice
Go to the Signal Context page. Right-click on the Signal(s) for which you want to resolve
- Click Resolve Signals.
The Resolve Signals pane will appear.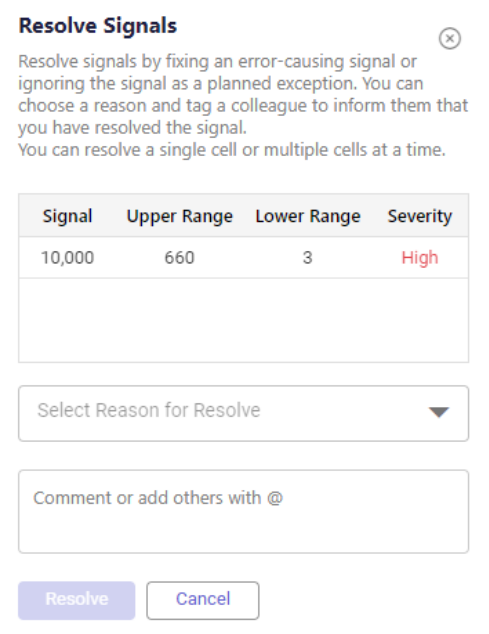
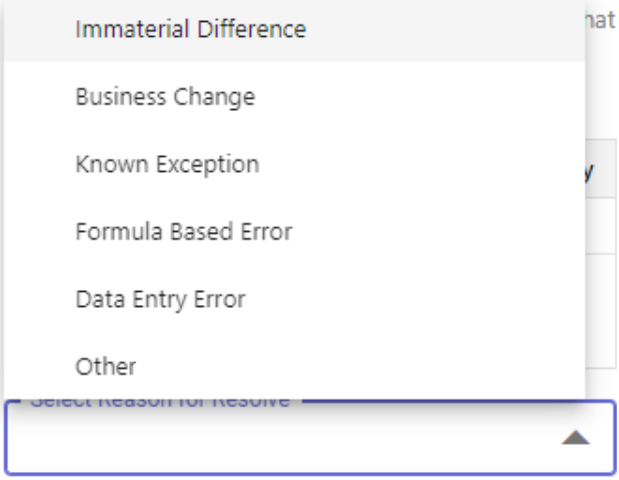
- Select the reason for resolution from a list of pre-existing options. If you resolve multiple signals simultaneously, the same reason will be applied to all.
 The resolved signal will now appear as a comment in the report. The comment will display the original cell value, the reason for resolving the signal, and any additional information provided while resolving the signal.
The following is an illustration of the comment.
Note:
Resolving signals permanently unflags the cells with the specified GL Combination and value(s), and the signal(s) will be marked as resolved in all other application areas for the same GL Combination.
Was this article helpful?