Using Breakback from a View or Report
- 8 Minutes to read
- Print
- DarkLight
- PDF
Using Breakback from a View or Report
- 8 Minutes to read
- Print
- DarkLight
- PDF
Article Summary
Share feedback
Thanks for sharing your feedback!
Overview
You can run Breakback from a View or Report, in SpotlightXL or Spotlight.
A Breakback button is available on the ribbon:
In SpotlightXL |
|
In Spotlight |
|

The view or report must have the Enable Save field set to Yes in the view or report properties.
If you want to run a calculation after the Breakback operation is completed, the view or report properties must include the name of the Calculation in the Calculation on Save field.
Breakback honors the current setting of Display Label or Code in your report or view.
Breakback automatically saves the changes it makes to the data. There is no option to return to the previous values.
Breakback is not available from the Default view or report that appears when you choose New View or New Report.
Breakback is not available from a cell that contains a formula in a report. Breakback must always begin with a data cell selected.
Breakback is not supported in reports or views with attributes included in the report or view. However, you can use an Attribute within Breakback to Hold.
Using Breakback Based on Current Data with $ Amount (Increase or Decrease)
In the following example, we want to increase the revenue targets in the 2016 Forecast. There is an existing forecast for Direct Sales & COS per product.

Here is a view of the leaf level data from this view, prior to Breakback.
 In Practice
With cell C4 selected, select the Breakback button on the ribbon.
Select the Current spread.
Select the Amount radio button and enter the new target.
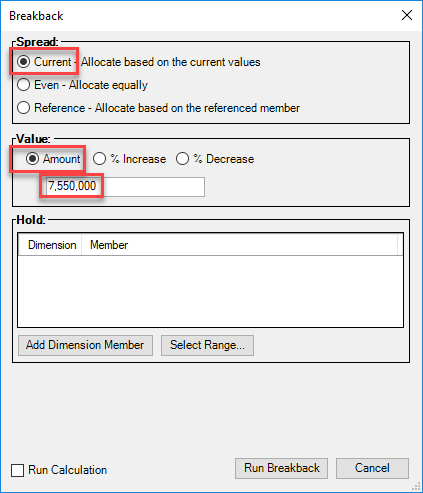
Click Run Breakback.
Here is the resulting data. The data has been increased in all regions and throughout the products proportionally.
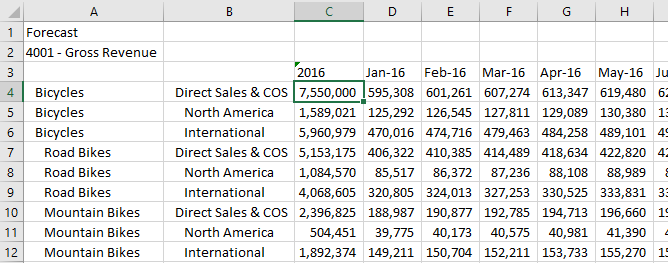
When you drill down to specific regions or products, you can see that the values have changed proportionally from the leaf level up.


Using Breakback Based on Current Data with % Change (Increase or Decrease)
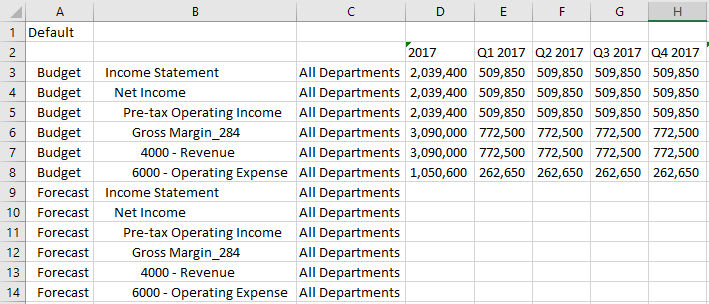
In the following example, 2017 Budget has data and we want to increase the amounts by 3%.

In Practice
With cell D3 selected, select the Breakback button on the ribbon.
Note:The children of Income Statement do not all have the same rollup operator. Gross Margin has + but Operating Expense has -. Our recommendation is to run Breakback only on members where the rollup operator is plus (+). However you can still run the Breakback with a mixture of rollup operators in the children if you enable this feature in Application Settings. See Best Practices for more details.Select the Current spread.
Select the Percentage and Increase radio buttons and enter 3 as the percentage increase.
Click the Run Calculation button to run the calculation associated with this view after the Breakback is performed.
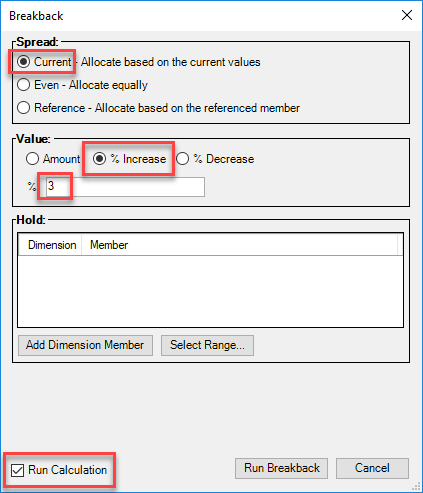
Click Run Breakback.
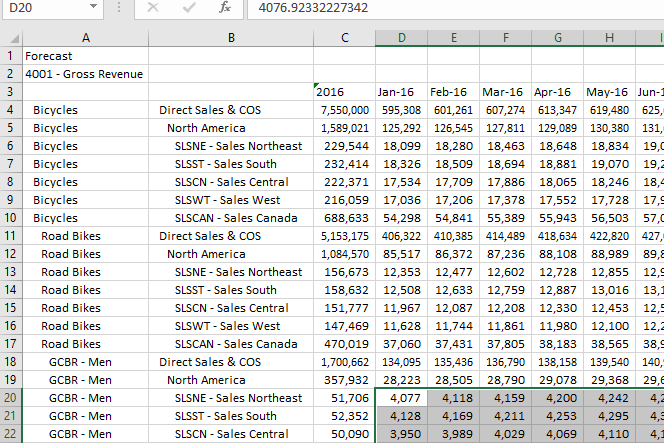
Here is the resulting data.


Note:
When using a percentage increase or decrease, you cannot start on a blank cell. You must first establish data in the target intersection and you can use the Breakback amount to do that, and then adjust the data with Percentage changes.
Using Breakback Based on a Reference
Two examples are provided:
Create next year's forecast based on current year's budget.
Allocate equipment expense based on the FTE count in the departments.
Create next year's forecast based on current year's budget
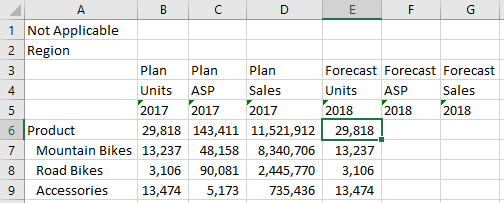
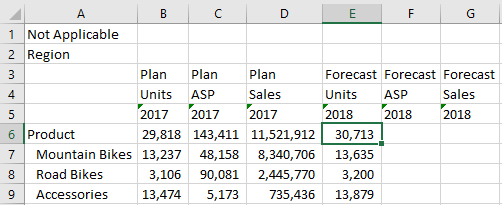
In the following example, we have 2017 Plan sales data for all products and regions. We want to copy that data into 2018 Forecast, then increase Units by 3% and increase ASP by 5%.

In Practice
Select Cell E6 for Forecast Units in 2018.
Select the Breakback button on the ribbon.
Select the Reference spread.
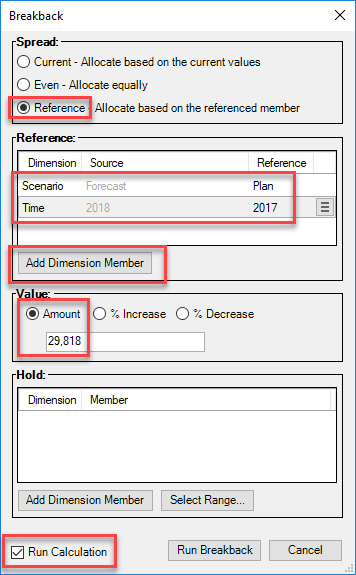
Click Add Dimension Member and specify the Scenario Plan to be the basis. Click Add Dimension Member again and specify the Time 2017 to be the basis. These are the two dimensions that are dissimilar from the intersection represented in cell E6.
Under Amount, type in the total amount from 2017 Plan as a baseline. You cannot increase the percentage of 2017 until you have established the baseline.
Click the Run Calculation button to run the calculation associated with this view after the Breakback is performed.
Click Run Breakback.
Now we have the same data as in 2017.
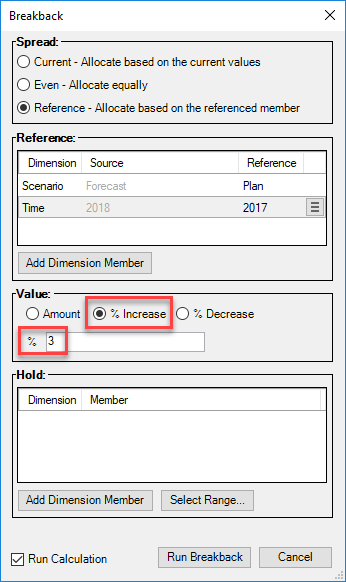
Run Breakback again from cell E6 and specify a 3% increase and the same Spread Reference.
Perform similar steps to increase the 2017 Plan ASP in the 2018 Forecast by 5%.


Breakback equipment expense based on the FTE count in the departments
In the following example, we have Full Time Equivalents Forecast for 2018 for all departments. Corporate wants to allocate a total IT and Facilities expense amount down to the departments based on FTE.

In Practice
Select Cell C4 for Equipment Expense for All Departments.
Select the Breakback button on the ribbon.
Select the Reference spread.
Click Add Dimension Member and specify the Account member for FTE.
Note:The member you are referencing must be visible in the report or view.Specify the total expense of $1.5M.
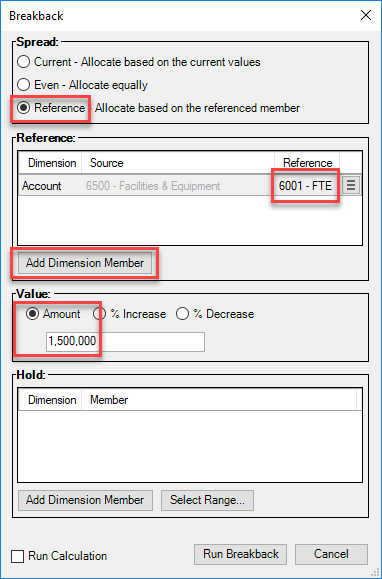
Click Run Breakback.
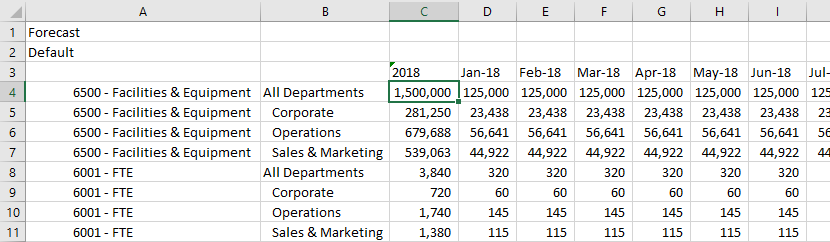
Here is the resulting data.


Using Breakback to Spread Data Evenly
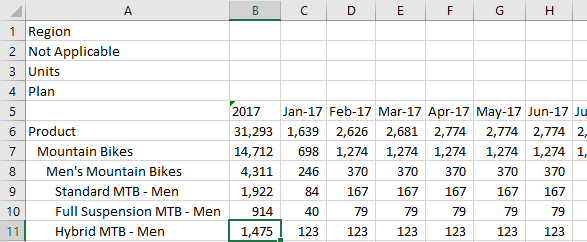
In the following example, a new product is being added to the 2017 Plan and we want to allocate the Units expected to sell during the year evenly.

In Practice
Select Cell B11, 2017 for new product "Hybrid MTB - Men."
Select the Breakback button on the ribbon.
Select the Even spread.
Under Amount, specify the amount you want to spread. In this case, somewhere between the current two products in this category.
Click the Run Calculation button to run the calculation associated with this view after the Breakback is performed
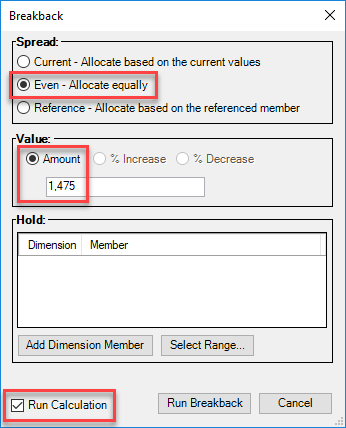 Note:Notice that Percentage is grayed out. For even distributions, you can specify only a fixed amount to be spread.
Click Run Breakback.
Here is the resulting data.


Using Breakback with a Hold
When allocating data, you might want some dimension members to be excluded from the updates. You can select to Hold one or more members from one or more dimensions. For example, you can increase the budget for Equipment Expense, but not in Q1 (a member of the Time dimension) and not in your Headquarters location (a member of the Region dimension).
There are three types of Holds:
Single Dimension Hold
Multi-Dimension Hold
Attribute Hold
Single Dimension Hold
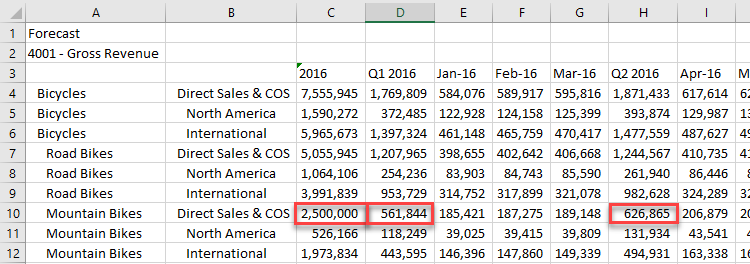
In the following example, revenue targets are increased for Mountain Bikes in 2016 but Quarter 1 is not increased.

In Practice
Select Cell C10, Mountain Bikes for 2016. Notice that the Q1 value is 561,844 and Q2 is 578,869.
Select the Breakback button on the ribbon.
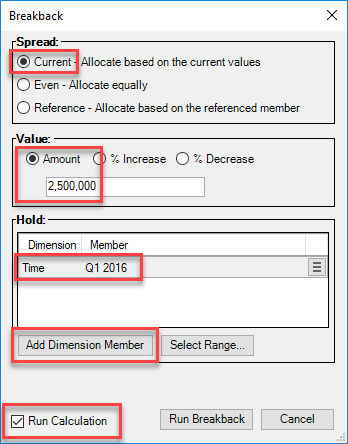
Select the Current spread.
Under Amount, specify the amount you want to spread. In this case, 2.5M.
Under the Hold box, select Add Dimension Member.
Specify the Time dimension and select Q1 2016. (In Excel, you can also click the Select Range button and simply click on the cell containing the member you want to Hold.)
Click the Run Calculation button to run the calculation associated with this view after the Breakback is performed.
Click Run Breakback.
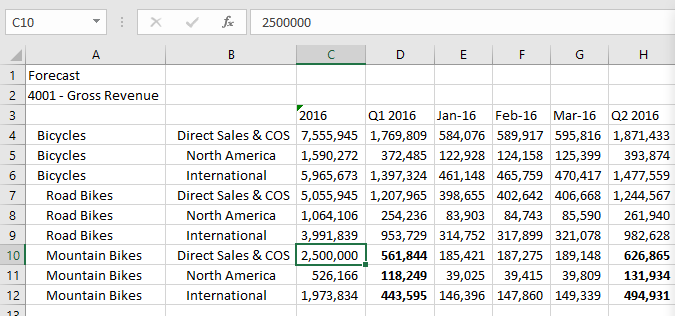
Here is the resulting data. Notice that Q1 remains at 561,844, and Q2 has increased to 626,865. Q3 and Q4 also had proportional increases.


Multi-Dimension Hold
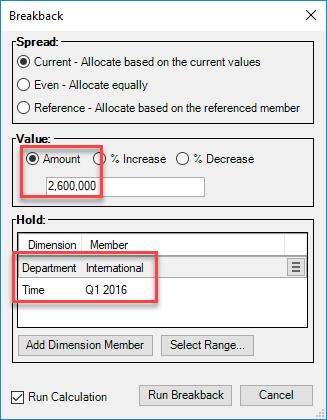
You can use the Hold feature to disallow changes to data in more than one dimension. The list of dimensions and members is interpreted by Dynamic Planning with AND between them. In the following example, revenue targets are increased for Mountain Bikes in 2016 but Quarter 1 in (AND) International markets is not increased.
In Practice
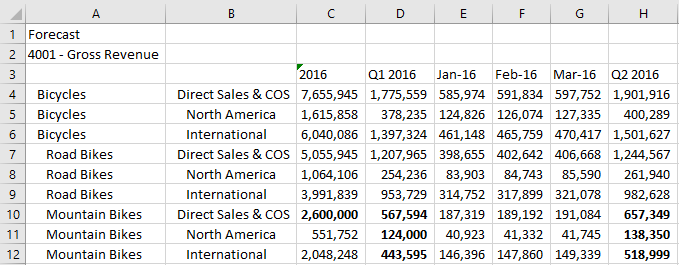
Select Cell C10, Mountain Bikes for 2016. Notice that the Q1 value for International is 443,595 and Q1 value for North America is 118,249.
Select the Breakback button on the ribbon.
Select the Current spread.
Under Amount, specify the amount you want to spread. In this case, 2.6M.
Under the Hold box, select Add Dimension Member.
Specify the Time dimension and select Q1 2016. (In Excel, you can also click the Select Range button and simply click on the cell containing the member you want to Hold.)
Select Add Dimension Member again and specify the Department dimension and International member.
Click the Run Calculation button to run the calculation associated with this view after the Breakback is performed.
Click Run Breakback.
Here is the resulting data. Notice that Q1 International remains at 443,595, but Q1 North America has increased to 124,000. Q3 and Q4 also had proportional increases.


Attribute Hold
You can use Attributes to specify which dimensions and members should be included in a Hold when you run a Breakback operation. The Attribute cannot be part of the view or report, but you can use it in the Hold area of the Breakback screen. Using Attributes to Hold dimension members is a quick way to control data updates with Breakback.
Users can still select individual dimensions and dimension members in the Hold. However, because it is easy to assign members to an Attribute, the ability to select the Attribute for applying a Hold is less cumbersome.

In the following example, Region is an Attribute on the Company dimension.

Members of the Company dimension have been assigned to Regions.

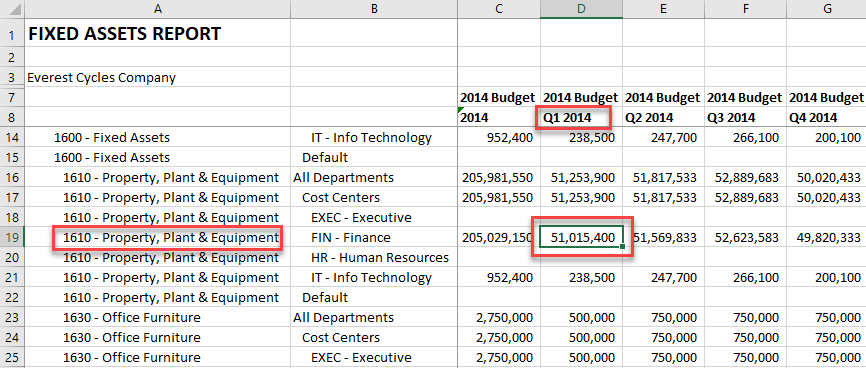
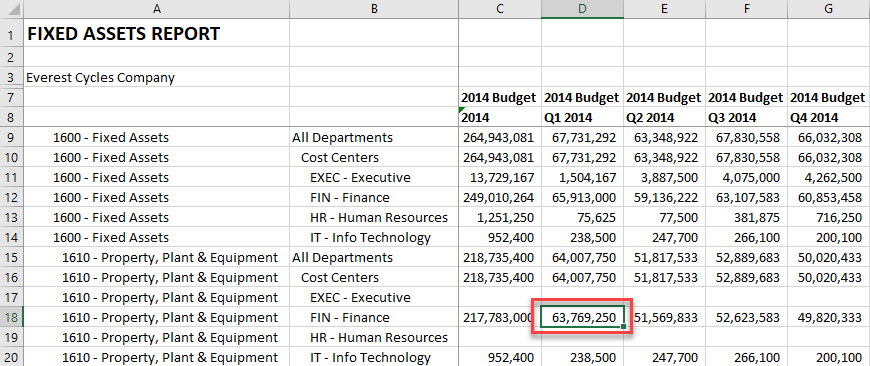
In the following report, the Manufacturing location on the West coast of the United States is investing in a new manufacturing building, so you want to increase the budget for Fixed Assets, Property/Plant/Equipment in Q1. West is a Region attribute.
In Practice
Select the cell for Q1 and account 1610.
Click Breakback.
Specify that you want to increase the allocation by 25%.
In the Hold area, click Add Dimension and add all the Regions that should not be increased. (Only West will be increased.) If you make a mistake, click the Member Select icon to make corrections.
Company.[Region] East
Company.[Region] North
Company.[Region] South
Company.[Region] EMEA
Company.[Region] APAC
Company.[Region] Africa
Company.[Region] LATAM
Note:_Attribute_Default (all members that are not mapped to an attribute) cannot be used in the Hold area.
Click to Run Calculation.
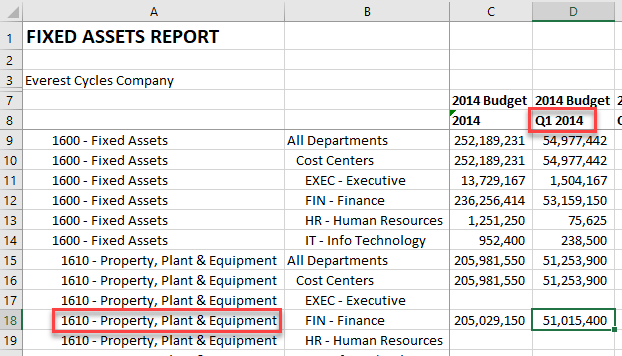
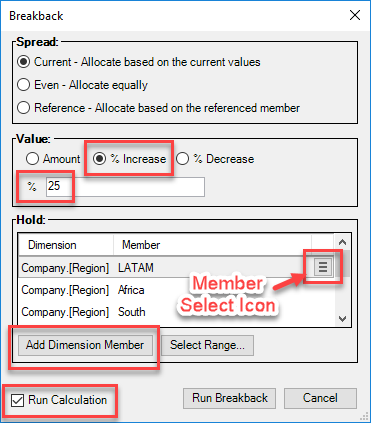
Click Run Breakback. Here is the resulting data.


Using Breakback with Locked Dimension Members
In the following example, only the East Region is available for input. The other members of the Region dimension are locked and the Application Settings for Views have Data Locking set to Application level.
Here is the Data Locking table for the Model.

The view shows grayed out regions where the data is locked.

If you start on cell C15 and select the Breakback button on the ribbon, and try to run a Breakback operation, it attempts to run the Breakback but since the cells are locked, no data is changed. No error message appears.

Using Breakback on Rollups with Different Operators
You can use Breakback on rollups with children with any operator, but you must first enable this capability on the Application Settings page. By default, it is disabled.
As a Best Practice, we recommend using Breakback only on rollups with the + operator. Running Breakback will change the data at the leaf level, and if the rollups use any operator other than +, the results of the Aggregation may be unpredictable.
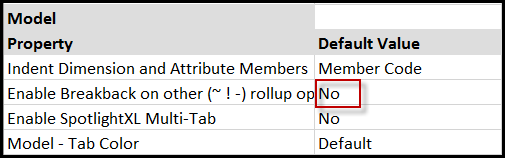
By default, Enable Breakback on other rollup operators is set to No, and Breakback will report an error if you try to use it on rollups with varying operators.

Enabling Breakback on Other Rollup Operators
A Power user must make this change.
In Practice
Select Manage > Application Administration> Application Settings.
Scroll down to the Model section and look for Enable Breakback on other (!-) rollup operators.
Select Yes or No from the drop-down.
Click Save.
Logoff and login again to see the effect of the changes.

Was this article helpful?