Enhancements to Application Behavior
This section provides you with a quick overview of features and functionality delivered with this release that may affect the way you use the Host Analytics application. It is not a comprehensive list of all the features delivered with this release; but rather those features that impact the way in which the application behaves.
Planning
Templates workflow functionality (opt in) - Click here to read about this feature
Enhanced Workflow (opt in) - Click here to read about this feature
Consolidation
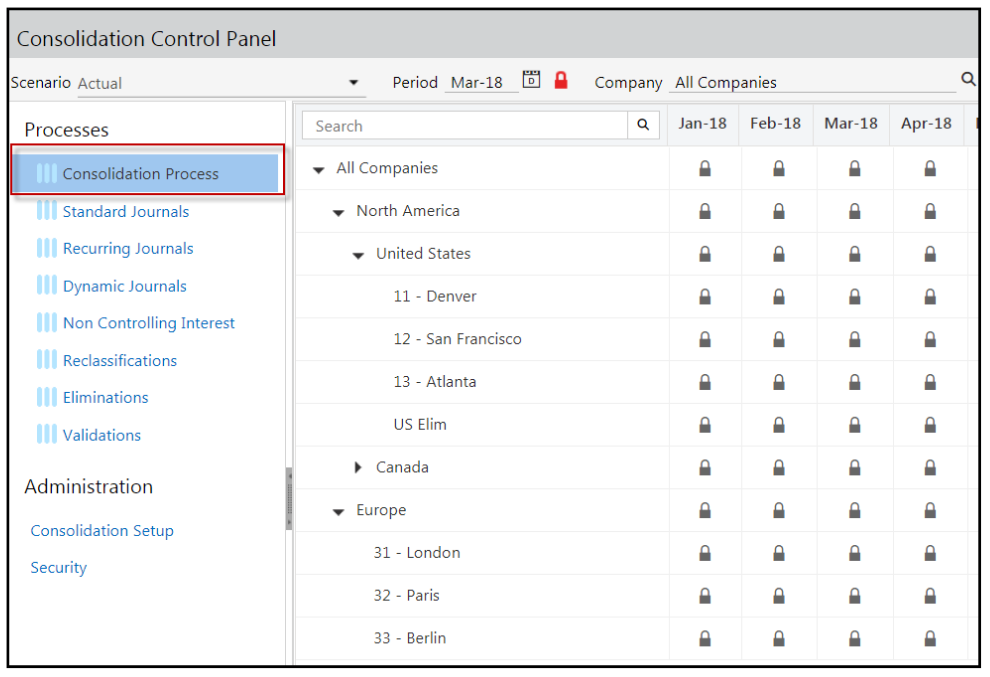
- Rearranged the order of the processes. Now, Consolidation Process is on the top of the list.
Consolidation Status - Click here to read about this feature
When Consolidation Status is enabled, the ‘Lock Data’ (under Maintenance > Reports) screen will no longer be available. The lock action will be available from the Consolidation Status screen.
When Consolidation Status is enabled, the Mark Complete and Mark Not Complete functionality is removed.
When Consolidation Status is enabled with Forward and Approve, complete the flow of the Consolidation Process, Forward and Approve, and then lock the company.
When Consolidation Status is enabled without Forward and Approve, complete the Consolidation Process before locking the company.
If a user adds a new company in Hierarchy Management, then the status of this newly created company is updated to ‘Locked’ till the last period.
When executing the Consolidation Process for the current period, complete the Consolidation Process successfully for all prior periods.
You can execute the Consolidation Process for individual company/rollup/Company Main from the Consolidation Status screen.
You must lock all the prior periods before locking any selected period. This includes previous fiscal years as well.
Select individual periods to Forward, Approve, Lock and Unlock entry actions for leaf members, rollup or Company Main.
You cannot select multiple periods to perform any entry action apart from the Consolidation Process.
When unlocking a company, the status resets to Modified for the current period. If future periods have Consolidated/Forward/Approve status, they reset to a Modified status.
You will not see the ‘Entry Action’ in the Consolidation Control Panel if you do not have sufficient permissions.
Dynamic Journals and Non Controlling Interest - Click here to read about this feature
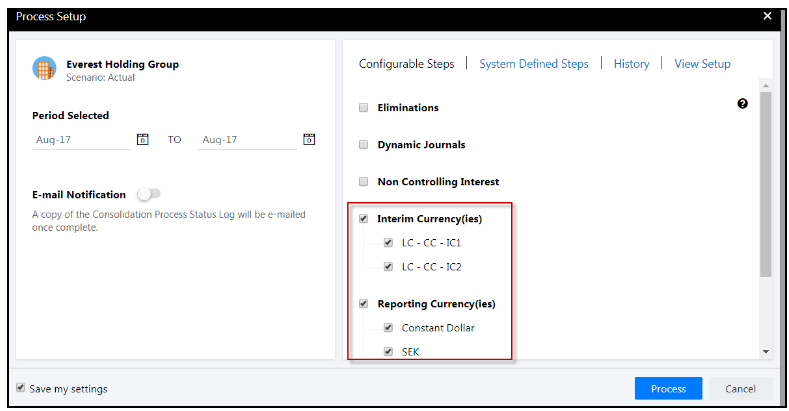
You can select Dynamic Journal process and Non Controlling Interest process while executing the Consolidation Process. This will take into account only the active Dynamic Journals and Non Controlling Interest.
You can process Dynamic Journal and Non Controlling Interest from the Consolidation Control Panel.
To clear inactive Dynamic Journals or Non Controlling Interest, make them active and select them from the Consolidation Control Panel.
Modeling
User Experience - Click here to read about this feature
A polished user interfaces in the Spotlight for Office modules with fresh icons, a simplified menu layout, and a secondary-click menu.
Views - Click here to read about this feature
The Zoom In option names have changed: Next Level renamed to Children, Leaf Level renamed to Leaves, All Levels renamed to All Children, and Data Leaf Levels renamed to Data Leaves.
Ability to retain or not retain the parent upon Zoom In.
Ability to move the dimension parent to the bottom of the view.
Ability to Zoom Out to parent or root.
Excel Reports are Renamed to Excel Reports - Click here to read about this change
Reports and Excel Reports - Click here to read about this feature
Support for PCR cube default members in formatted reports and Excel Reports.
Administration - Click here to read about this feature
Consolidated settings for Model Keys and Model Value Block Size in Application Settings.
Reporting and Analytics
Dynamic Reports
Grid and More menu redesign.
All column headers are center aligned by default as the formatting options are now extended to all applications.
Turn on/off columns in drill through report does not auto-resize the columns to fit the screen resolution leaving extra white space towards the right of the grid.
If subtotals or grand total is turned on, a number of other features in Dynamic Reports are not supported nor are they supported once exported to Excel.
Report Collections - Click here to read about these enhancements
Default e-mail text is updated.
Sender receives all report collection e-mails and attachments by default when ‘Apply Recipient’s Bursting Dimension Security’ is configured.
Options are dynamically applied at the report collection run time instead of filling the members one time at the setup. So, individual members are not available in the distribution list.
Verify Data
Toolbar menu Labels are updated.
Dashboards
Default -ve number format on existing KPIs & Tables is set to -123456.
Zero and empty values are suppressed by default in all existing line and combination charts.
Data Load Rules
NetSuite Connect DLR load type can be changed to File Load/Copy-Paste/Web Services.
Saved Search ID can be entered manually in Select Sample Input File in the NetSuite Connect DLR.
DLR copy now copies all the metadata of the source DLR.
Columns will be retained while editing an existing Employee Load DLR.
Auto-load missing segment members (available for customers new to Host as of this release)
Planning: Scenario Type - Plan Scenario
With the Spring 19 release, we have released a scenario type called Plan Scenario. The goal of releasing this scenario type is to enhance the usability and functionality related to creating and interacting with your different scenarios. Over the next few releases, we will continue to enhance this scenario type to ultimately move to one scenario type for all of your budgeting and forecasting, which will include additional built-in cutting-edge features. In the current application, there is an option of selecting either a budget or a forecast scenario type; these two types will still be available, and they will work seamlessly with this scenario type from a seeding perspective.
Plan Scenario: The Path Forward
Currently, the Plan Scenario type can only be used for a forecast. In the next release, we plan to introduce the ability to create a budget as well. We are releasing this scenario type to enhance the usability and functionality related to creating and interacting with your different scenarios. The most important item related to this scenario type is an enhanced method to seed data.
During the Summer 18 release, we released a seeding type called Seeding Overlapping Periods, which continued the evolution of enhanced seeding. We released the seeding type in preview because we wanted to give customers a sneak peek into our overall vision and seeding direction. This was highly focused on the concept of intelligent seeding. With positive customer momentum as well as great customer support and feedback, we have incorporated the next level of intelligent seeding within the Plan Scenario type. Going forward, we will continue to focus all of our efforts on continuing to enhance the Plan Scenario type.
Intelligent Seeding
The primary objective of Seeding is to allow you to get data and/or formulas from a source scenario. You may require different ways to seed data/formulas depending on the specific business case. The main categories of seeding that you can use are as follows:
Cell to Cell Seeding (Overlapping periods seeding type)
Period to Period Seeding (Plan Scenario- scenario type)
Cell to Cell Seeding
Cell to Cell seeding refers to the seeding methodology where you can use the same template structure as the source scenario. This type of seeding is illustrated in the following image.

Here, the formulas defined in period 1 of 2018 in the source scenario are seeded to period 1 of 2019 in the target scenario.
Period to Period Seeding
Period to period seeding provides a setup where data and formulas are seeded based on the matching periods. In this case, formulas defined in Period 1 of 2019 in the source scenario are seeded to Period 1 of 2019 in the target Scenario. This functionality is part of the seeding feature, which can be enabled via the Plan Scenario.

Seeding Logic
When you create a new scenario with Scenario Type as Plan Scenario, the following Seeding logic occurs in the application:
In the Seeding section, the application automatically maps the overlapping periods based on the selected source scenario.
For periods that do not overlap, the application maps the last period as the source. You can change this to any of the open periods in the source scenario.
The application automatically adjusts the formulas, seed formulas, and structure for overlapping periods and out periods.
If there is any error related to the Seeding process in adjusting the formulas, the application fills the cell with data from the source. In addition, the application records a log entry for the formula that could not be adjusted. This log is provided in the form of an exception report.
- In case of any exceptions, you can choose to correct the errors manually by replacing the formulas or you can continue with the existing values.
In Practice: Seed Data Using the Plan Scenario
- To seed data using the new scenario type, go to the Scenario List page (accessed by navigating to Maintenance > Admin > Scenario Setup).
- Click the Add icon. The Add Scenario page is displayed.
In the General Information section, select Plan Scenario from the Scenario Type drop-down list.
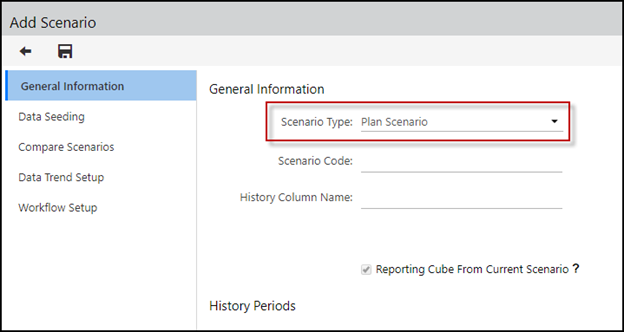
- Specify the required details to create a scenario.
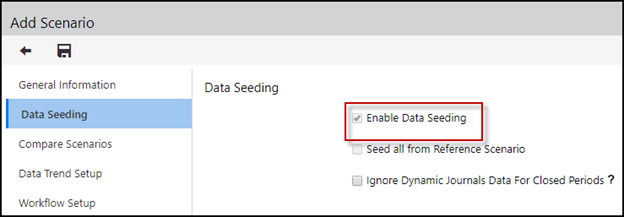
Click the Data Seeding section; the Enable Data Seeding checkbox is selected by default and is read-only.
From the Scenario list, select the reference scenario. All the options in the Copy field are enabled by default and are read-only.
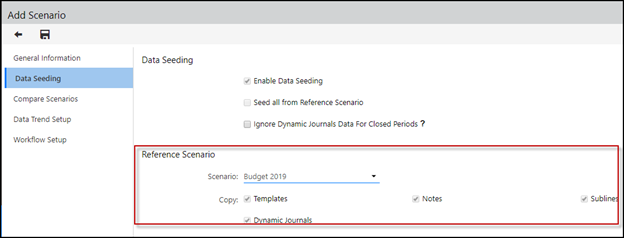
The data is seeded from the reference scenario to the target scenario and the overlapping periods are mapped by default.
For example, if you create a new scenario as Forecast 2019-2020 and select the source as Forecast 2018 – 2019, the application will automatically map the periods of 2019. This is because these periods are overlapping in both the source and target scenarios.
For the out periods in the Forecast 2019-2020 scenario (periods of the financial year 2020), the application takes the last period of 2019 and maps it as the default source.
You can, however, change any of the mappings and choose any specific mapping from the source scenario, if the period is an open period in the source scenario.
If there are no overlapping periods, the application keeps the Source Period column as blank by default and you can then select the required dates.
 All formulas are automatically adjusted during the Seeding process.Note:The time that the Seeding process takes to be completed depends on the number of formulas in the source scenario.
Formula Adjustments in Seeding
Depending on the way the formulas have been defined, the adjustments are done accordingly. For example, let’s say you create a new scenario named Forecast 2019-2020 and select Forecast 2018-2019 as the source scenario. The default mapping in the new scenario matches the 2019 formulas from the source to the target scenario.
Consider a simple template structure to explain the way formulas are adjusted.
The template structure in the source scenario contains the following columns:
Column A: Segment Code
Column B: Name
Column C: Attribute
Columns D-0: History Periods (Year 2017)
Column P: History Total
Columns Q-AB: Year 1 (2018) Periods
Column AC-AN: Year 2 (2019) Periods
Column AO: Year 1 Total
Column AP: Year 2 Total
This image illustrates the Source Scenario.

The template structure in the target scenario contains the following columns:
Column A: Segment Code
Column B: Name
Column C: Attribute
Columns D-0: History Periods (Year 2018)
Column P: History Total
Columns Q-AB: Year 1 (2019) Periods
Column AC-AN: Year 2 (2020) Periods
Column AO: Year 1 Total
Column AP: Year 2 Total
This image illustrates the Target Scenario.

With automatic adjusting, the formulas that are defined for Jan 2019 in the source scenario will now be updated in Jan 2019 of the target scenario.
This process requires the following adjustments:
The formula in Jan 2019 exists in cell AC2 and is based on reference to cell Q2.
When this formula is replaced in the target scenario, it is placed in cell Q2 and is adjusted to refer to cell E2 to ensure that the same relationship is maintained.
The adjustments are not limited to a blind transpose of formulas, but as per smart adjustments.
The following example explains the adjustment of formulas based on Attribute columns:
In the source scenario – Jan 2019 period – row 3, the formula is defined based on the Attribute column in Jan 2019: cell AC3 references cell C3.

When this formula is seeded into the target scenario, the position of Jan 2019 changes, but the formula should still refer to the same attribute column reference: cell Q3 refers to cell C3.

Here is information on transpose logic using the image above:
Formulas based on Cell Reference are transposed and adjusted.
Formulas on History Periods are transposed and adjusted to point to the respective history periods.
Formulas based on Compare scenarios are transposed and adjusted to point to the corresponding history periods.
Value-based formulas are brought forward without any changes. For example, if a cell in the source scenario has a formula as 100+20*30 (purely based on values without reference to any other cells), then in the Target scenario, the same formula is copied without any adjustments.
Formulas based on Line name, code, or any of the fixed columns remain true and are not transposed.
Fixed columns include the following:
Line Name
Line Code
Attributes
Global Fields
Spreads: Formulas based on Spreads are not transposed. Spread formulas are replaced with values.
Formulas based on Forecast Methods are as follows:
The Monthly Increase in % and Monthly Increase in $ forecast methods are transposed.
The Full Year Growth forecast method is not transposed. Formulas are replaced with values.
Sub lines: The items associated with Sub lines:
Principle: The behavior applicable to main lines is applied to Sub lines.
Values: The existing Values are retained.
Formulas: The behavior of Formulas applicable to main lines is applied here as well.
Simulation Process: The simulation process is as follows:
When formula adjustments are completed, they need to be reevaluated.
You must execute the Simulation Process to enable the application to recalculate the values.
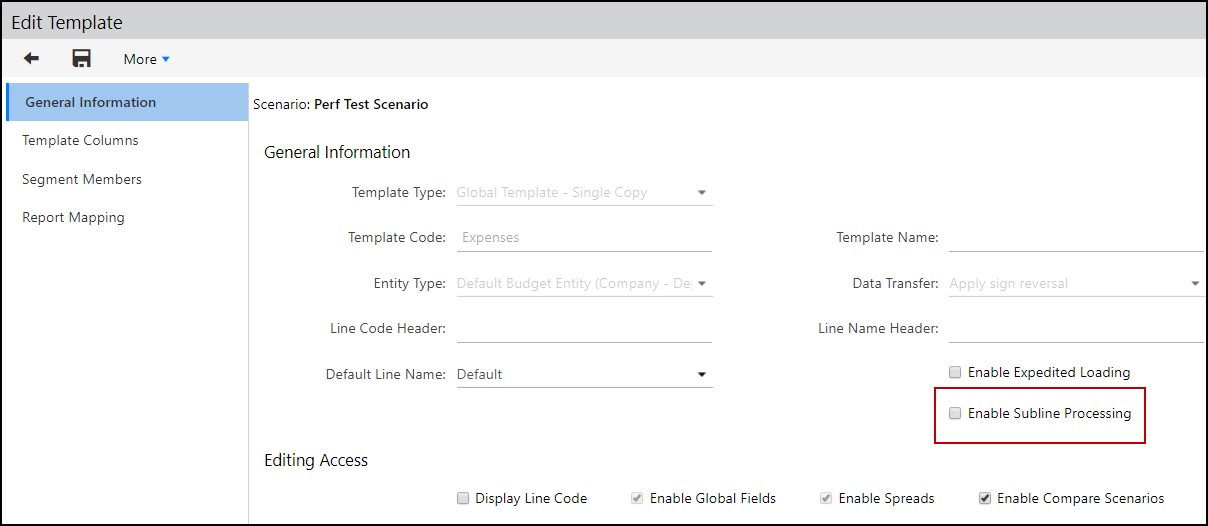
To ensure that sub lines are processed during the simulation process, you must enable the Enable Subline Processing setting from the Template Add/Edit page (as shown in the image). This is to ensure that the sub lines are processed when the simulation process is executed.
We recommend that you do not simultaneously try to open and save the template during the execution of the simulation process.
Closed Periods:
When the source scenario has closed periods, no formulas are displayed in the target scenario. Mapping takes precedence in this case.
If the period to which the mapping is done contains formulas, the application fetches the same formulas.
C Type Lines:
Formulas are adjusted similar to the L Type Lines with Formulas.
Value-based formulas: For example, =100+10*20.
These formulas are seeded as is, without any adjustments
Lines without Account Mapping:
For overlapping periods:
Where the source and target scenarios have open periods – the data is fetched.
Where the source scenario has closed periods and the target scenario has open periods – the data is not fetched as closed periods are not allowed to be referred.
Where the source scenario has open periods and the target scenario has closed periods:
The data is retrieved based on the data in the source (for the same period), irrespective of the seeding.
For example, in case of closed periods, you may have mapped to actual periods.
However, since open periods do not have any understanding of the data for non-account mapping lines, there is no way to get this data
So, you can get the data from the source scenario/template based on the matching period.
For Out Periods
Values are fetched based on the mapped period.
Where the application cannot transpose formulas or tries but results in formula errors, the formulas are replaced by values associated to the period.
CAPEX: Adjustments are not done in CAPEX templates.
Workforce Planning (Detailed HR):
No data adjustments are done.
You must run the simulation engine to recalculate the accurate values.
Other template types:
Block, Initiative, and Template-based HR follow the same behavior as that of OPEX templates as far as translating and adjusting formulas are concerned.
Currently, Custom Time Sets are not supported. Default Time Sets are supported as of now, which is data at the monthly, quarterly, and yearly levels.
The exceptions for the transpose logic are as follows:
If the template has a formula with $, these formulas are not adjusted and are seeded in their existing state.
If the template has a formula, which after adjustment results in circular reference, the application tries to adjust; but, the formulas get deleted due to a circular reference error.
If the template has formulas, which after adjustment refer to undefined references, the application does not adjust the formulas.
For example, a template in a 5-year scenario (2018-2022) has formulas in the year 2022 that refer to the value in the year 2018. The new scenario needs to be created for the years 2021-2025. To adjust formulas in this case, the application tries to keep reference to the column associated with the year 2018 in the new scenario.
However, since the application cannot find any column referring to the year 2018, it cannot perform the adjustment process.
Seeding Exception Report
The application logs the cases when formulas could not be transposed and provides this information in the form of an Exception report. This report contains details such as Scenario, Entity, Template, Column and Period references, Source Value, Destination Formula, and Destination Value.
This report specifies details about the Values in Source Scenario and the replaced Value and Formula in the Target Scenario. Exception reports can be accessed from the More menu on the Scenario list screen and also from the More menu on the Templates screen.
Export Exception Report for Scenario
Go to the Scenario List page (accessed by navigating to Maintenance > Admin > Scenario Setup), and then select a scenario from the list.
This is applicable when the scenario type is Plan Scenario.
From the More list, select Seeding Exception Report.
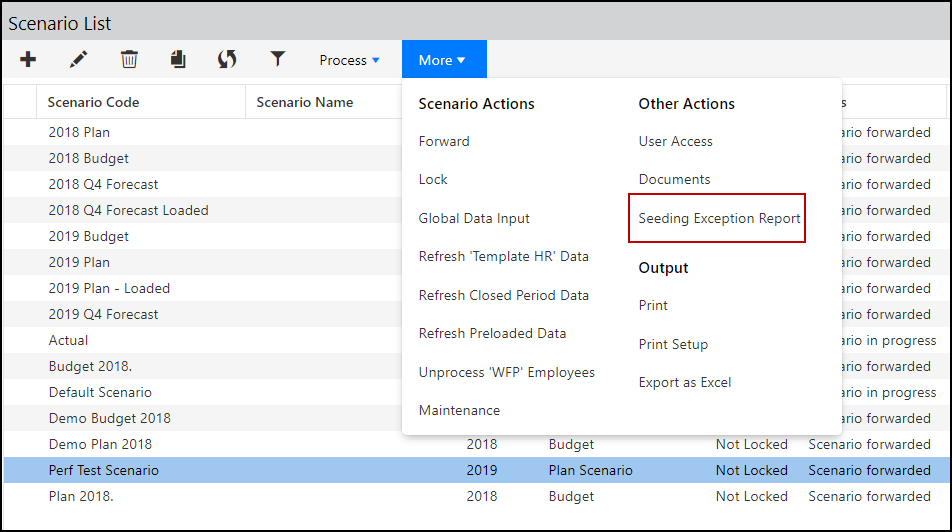
This exports the cases when formulas could not be transposed for a scenario, in the form of an exception report.
To generate this report for a specific template, follow these steps:
Go to the Template List page (accessed by navigating to Maintenance > Templates > Template Setup).
From the Scenario list, select a scenario and then click the required template.
From the Setup list, select Template Setup. The Template Setup page is displayed.
From the More list, under the Seeding Report section, select Exception Report.
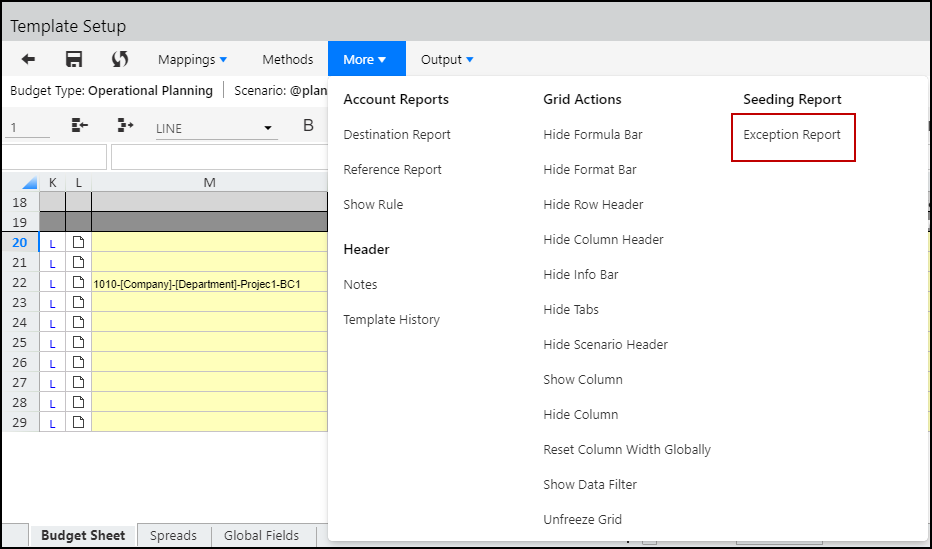
Best Practices
To trigger the Intelligent Seeding functionality, Admin users must schedule a simulation engine process to ensure all the data is transposed properly.
In addition, Admin users must select the Enable Subline Processing setting and then run a simulation process. This is to ensure that the process runs for Main lines and Sublines together, when the process is run for the first time.
Once the simulation engine has run successfully, we recommend you to review the Seeding Exception Report to validate that all formulas and data has been transposed properly.
We recommend that you do not simultaneously try to open and save the template during the execution of the simulation process.
Limitations
If a circular reference error occurs in a cell and there are other cells that depend on this cell, then all such depending cells are also resulting into formula errors and application replaces formulas with values.
For more details on limitations refer to the known issues.
Planning: Enhanced Workflow and Automated Task Creation (PREVIEW)
This opt-in feature is being released for PREVIEW only! It will be available to be enabled in the Sandbox environment. Admin users can configure this feature directly from the Host application (refer to the Enable Enhanced Workflow section).
If you opt to use this feature, ensure that Workflow Setup is done in a proper decentralized planning process configured in the application. This means that users have appropriate Input, Forward and Approve privileges based only on their budget entity responsibility. Workflow tasks are generated at a granular level based on approval roles, budget entity, and template assignments. Consequently, you must be aware that a large number of tasks may be generated for each user if workflow privileges are not setup properly.
We suggest that you test this feature and familiarize yourself with the functionality. Our goal is to release this functionality in production for the July monthly release. Please note that once this functionality is enabled within your production environment, it cannot be disabled.
It is best practice to use Workflow Setup if you have a decentralized planning process configured in the application. This means that users have appropriate Input, Forward and Approve privileges based on their budget entity responsibility. Workflow Tasks are generated at a granular level based on approval roles, budget entity, and template assignments. Consequently, you must be aware that a large number of tasks may be generated for each user if workflow privileges are not setup properly.
If you do not enable Workflow Setup for a Scenario, the Planning Control Panel works as usual without automated tasks and multiple authorization functionalities.
Irrespective of whether Workflow Setup is enabled for a Scenario or not, the Workflow Actions for Templates are activated. This means that the Forward and Approve actions are available for templates.
Introducing the Enhanced Workflow and Automated Task Creation enhancements. These two enhancements provide Planning Administrators with an enhanced ability to control and organize tasks, which are needed to complete the planning process. For users, these enhancements provide the ability to systematically complete assigned tasks in a methodological manner by tracking and updating workflow actions. The features associated with these enhancements are as follows:
Ability to define a workflow process with due dates for individual workflow stages
Ability to configure single or multiple workflow authorizations for an artifact
Ability for higher-level privileges to perform lower-level actions; without having to send back
Ability to create Multi-tier Approvals
Introduction of a Template workflow
Automated task creation in Task Manager for workflow actions
The remainder of this section discusses:
How to Enable Enhanced Workflow
How to Setup Enhanced Workflow for a Scenario
How to Edit an Existing Workflow Setup
Workflow Actions for Templates
Completing Workflow Tasks Associated with a Scenario
How to Enable Enhanced Workflow
Admin users can enable the workflow for a scenario on the Workflow Setup page when adding or editing a scenario by following these steps:
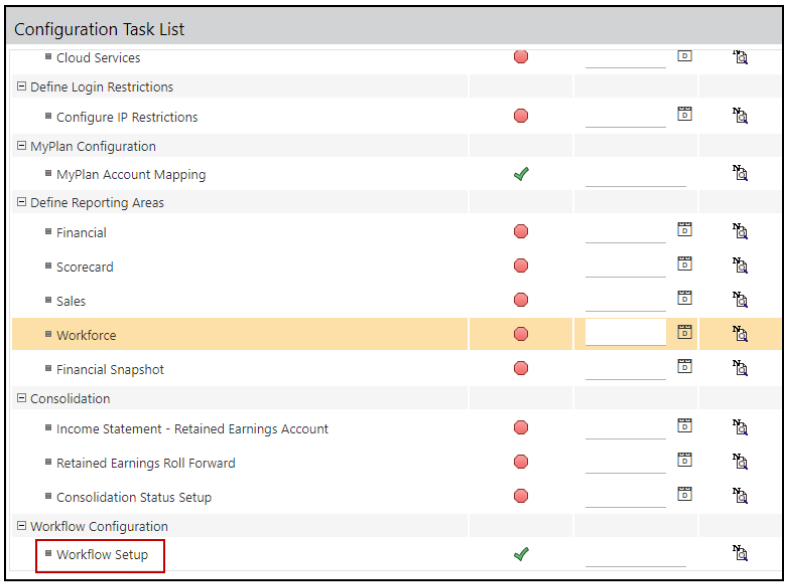
Access the Configuration Tasks page via Maintenance > Admin.
Click the Workflow Setup task to enable this functionality, as shown in the image. The Workflow Setup page is displayed.
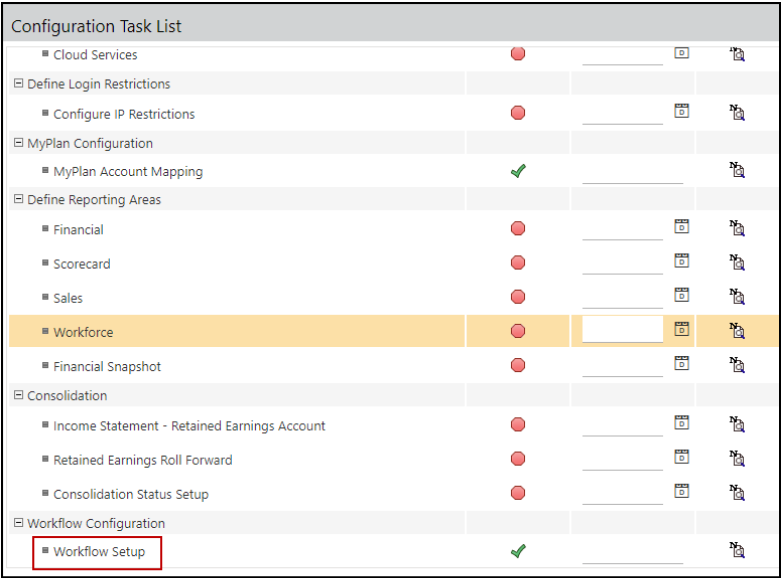
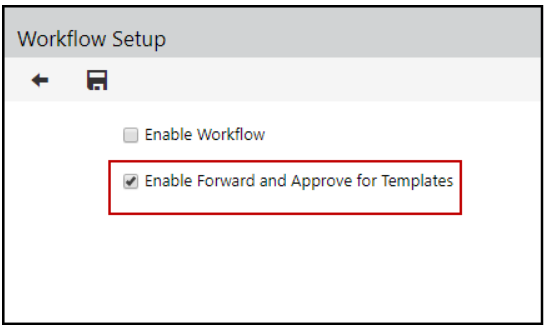
Select the Enable Workflow checkbox. The Enable Forward and Approve for Templates checkbox is automatically selected, as shown in the image.
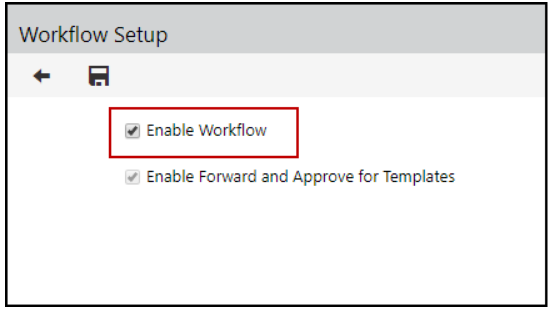
Click the Save icon. A confirmation message is displayed.
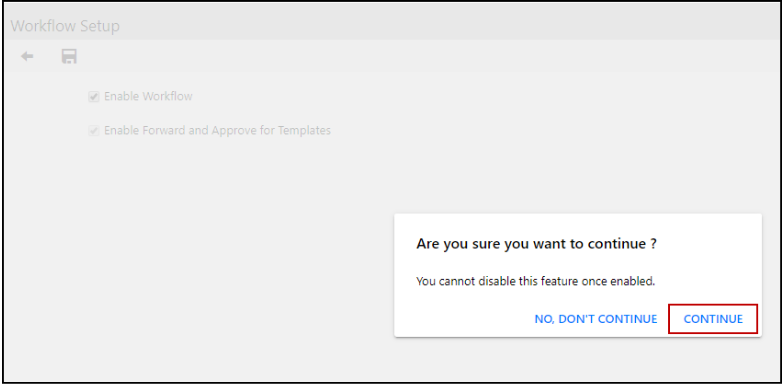
Click Continue. The enhanced workflow is now enabled for scenarios.
Enhanced Workflow Process Setup in Scenarios
Admin users must first set up the workflow process from the Scenario Setup > Workflow Setup section. This setup allows Admin users to define the following details:
Start and End dates for a workflow process
Due dates for individual stages or workflow actions
Number of workflow authorizations (multi-tier authorizations) required for each workflow action
To enable and set up a workflow for a new or existing scenario, follow these steps:
Navigate to the Scenario List page (accessed by navigating to Maintenance > Admin > Scenario Setup) and click the Add or Edit icon (for a selected scenario).
Click the Workflow Setup tab, and then select the Enable Workflow for this Scenario checkbox.
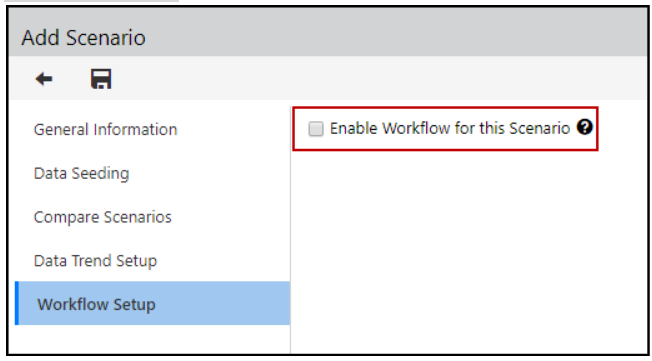
Specify the Start Date, End Date, and Time Zone values.
The start date is only for informational purposes. In future enhancements, this start date will help Admin users schedule the workflow setup.
The end date indicates the final date by which all actions related to this scenario need to be completed. All other due dates are calculated as ‘x’ number of days before the process end date.
The end date serves only as a guidepost. It does not actually stop users from completing actions after the end date.
The time zone will be set by default based on your local time zone. But you can change the time zone, if required, to accommodate when the task should start and end.
The tracking of due dates for all tasks under this process is based on the selected time zone. For example, if the end date is specified as April 29th, 2019 EST, all workflow tasks will be overdue at 12:00 midnight of April 30th, 2019 EST. So, for a user operating from the pacific time zone, this task will become overdue at 9:00 pm PST April 29th, 2019.
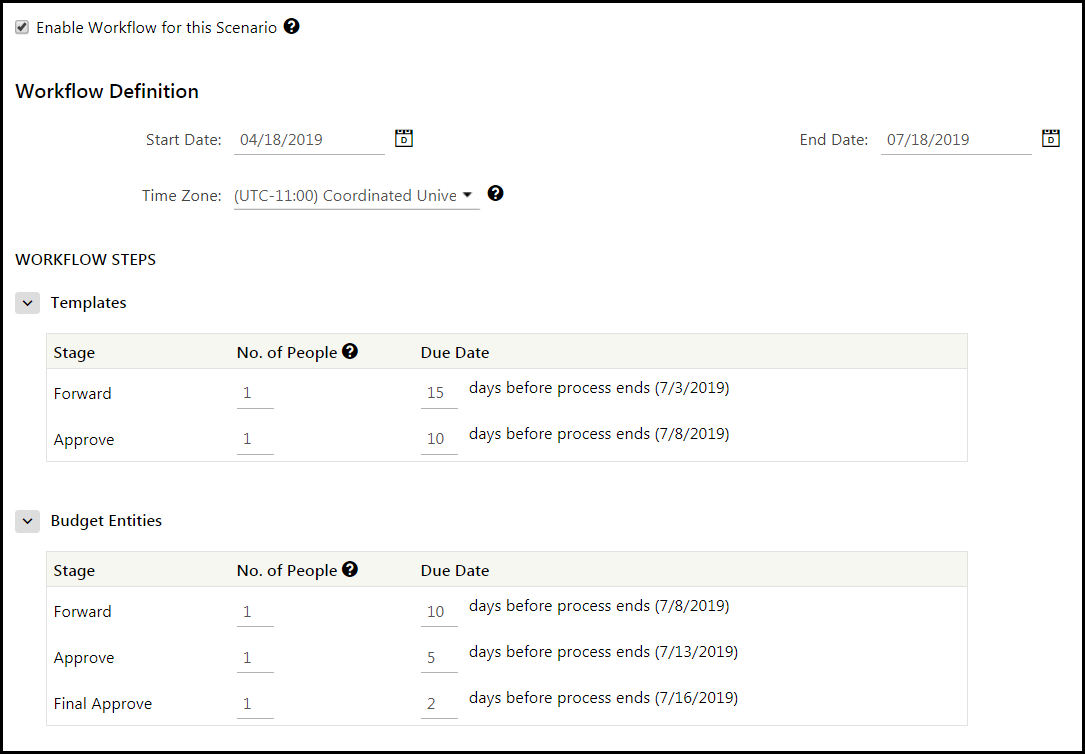
The Workflow Steps section consists of the following fields for Templates and Budget Entities:
No. of People
Due Date
Note:Workflow in Planning is designed around budget entities and templates. So, these two appear as steps in the workflow process. In future enhancements, other areas of the application such as application maintenance and consolidation elements are planned to be added to the workflow process.
Enter the number of people who must complete the required tasks in the No. of People fields, for the Forward and Approve stages.
This field allows you to define the multiple authorization functionality in a workflow.
If No. of People is set as 1, the system completes the workflow step when any one user performs the action. For example, if Joe and Jack have access to forward the budget entity and the No. of People is set as 1, the budget entity will be forwarded when either Joe or Jack forwards it.
If No. of People is more than 1, the application completes the workflow step when those many actions are performed. Extending the above example, the budget entity will be forwarded only when both Joe and Jack forward it.
Furthermore, if Joe, Jack, and Bill have access to the budget entity and No. of People is set as 2, the budget entity will be forwarded when any two of the three people forward it.
If the No. of People is set as 2 but access to the budget entity is given to only one person, the budget entity will not be forwarded. In such instances, the Admin user must ensure that the adequate number of users are provided with access privileges for the budget entity.
Currently, MyPlan does not honor multiple authorization in workflow.
Enter the number of days before which the relevant tasks need to be completed in the Due Date fields; for the Forward, Approve, and Final Approve stages of all budget entities/templates.
The due date for a workflow step is set by entering the number of days before the end date, by which the given step needs to be completed.
For example, if the workflow process end date is set as April 30th and the Template Forward due date is given as 20 days; the application will auto-calculate the due date for this stage as 20 days before April 30th and set the due date as April 10th.
The workflow steps and actions are arranged in a logical order of completion; so, the due dates must be in the same pattern. Ensure that due dates are not defined to break this chain. For example, the budget entity Approve stage cannot be defined to have a due date prior to the budget entity Forward stage.
Click the Save icon.
Saving the workflow setup does not automatically start the process. The process must be manually started from Scenario List page (described below). This ensures that the Admin user can have multiple iterations of the workflow setup and can trigger the process when they’re ready.
When the workflow process is defined for an existing scenario, automated workflow tasks are created only for the actions that have not yet been performed.
Go to the Scenario List page, and then select the required scenario.
From the Process list, you can do any one of the following:
Select Start. New tasks are created on the Task Manager page with the same Scenario Code as the scenario that you selected earlier.
Select Sync. New tasks are created or existing tasks are modified for existing scenarios. The Admin user must trigger the Sync process so that the workflow engine can update any modifications that were made. Some examples of such modifications are as follows:
Change of access privileges of users – Removal of access privileges results in the task to be removed, whereas addition of access privileges results in additional tasks to be created for the user.
Creation or mapping of new budget entity/template.
Deletion or unmapping of an existing budget entity or template.
Creation and deletion of users.
Edit an Existing Workflow Setup
To edit an existing Workflow Setup, follow these steps:
Go to the Scenario List page (accessed by navigating to Maintenance > Admin > Scenario Setup) and select the scenario with an existing workflow setup.
Click the Edit icon.
Make the required changes in the respective fields. Any change to the due dates affects the existing tasks. However, any change to the value in the No. of People field can create different use cases and will not automatically trigger changes to tasks. For example, if the original workflow setup had No. of People set as 2 for the Forward stage; and out of Joe and Jack, one person has performed the Forward action on budget entity X. The Admin user then modifies the workflow setup and changes the No. of People to 1. Now, budget entity X is not automatically forwarded since one person has already completed the Forward action. The Admin user must manually perform the Forward action on budget entity X to forward it. It is best NOT to change the No. of People field once workflow begins.
- From the Scenario List page, select the Process drop down, then select Sync.
Best Practices
When this functionality is released in production and the Workflow flag is enabled, it cannot be disabled. So, when this flag is enabled, you can still leverage most of the enhanced workflow benefits without having to start a workflow process. As a result, it is best practice to enable this flag. By default, all applications after the July 19 release will natively have this functionality.
It is a best practice to use Workflow Setup if you have a decentralized planning process. Tasks are generated based on your approval roles, budget entity, and template assignments. Consequently, you must be aware that a large number of tasks by end users can possibly be generated.
Task Manager and the Planning Control Panel work closely with each other and the flow is 100% bi-directional. if an action is performed in Task Manager, the Planning Control Panel is updated accordingly, and vice-versa.
Admin users must get familiarized with this functionality before enabling it in the production environment.
You must follow these recommendations before enabling this feature for end users:
Set up a workflow process for a Planning scenario.
Ensure that the end users sign in to the application and navigate to the Task Manager page.
Instruct the users that their tasks, which are required to complete the Planning scenario, will be auto-generated for them and they will see this information in Task Manager.
The end users can then use Task Manager to directly interact with the Planning Control Panel.
Workflow Actions for Templates (PREVIEW)
This feature is being released for PREVIEW only! It will be available in the Sandbox environment. We suggest that you test this feature. If you want to enable it in your Production environment, this will be possible with the July19 release. Once this feature is enabled in Production, it cannot be deactivated.
With this release, we have enhanced the workflow actions for templates to include Forward and Approve. These actions work similar to the Forward and Approve actions for budget entities.
The ability to Forward and Approve templates is optional for existing customers. Existing customers can opt to enable this functionality directly from the Workflow Setup page. For all customers who are new to Host as of the Spring19 release, this functionality is provided by default. If you are an existing customer and you choose not to have the Approve and Forward functionalities, you can mark templates as Mark Complete and Mark Not Complete after you input the data.
This portion of the document discusses:
How to Enable Forward and Approve Actions for Templates
Actions That Can Be Performed on a Selected Template
How to Enable Forward and Approve Actions for Templates
You can enable the Forward and Approve functionalities for templates from the Workflow Setup page, which you can access via the Configuration Task page by following these steps:
Go to the Configuration Tasks page via Maintenance > Admin > Configuration Tasks.
Click the Workflow Setup task to enable this functionality, as shown in the image. The Workflow Setup page is displayed.
Select the Enable Forward and Approve for Templates check box, and then click Save.
Actions That Can Be Performed on a Selected Template
You can perform the following actions for a selected template; however, approval actions are based on Approval Role access:
Forward - Forward a template for approval. Templates that have been forwarded are locked and cannot be edited. You can forward a template once you input all the required information.
Approve - Approve a template that has been forwarded.
Send Back - Send back a forwarded template for changes or updates. You can send back templates until they are approved. This option is available after the template has been forwarded and before it receives an approval.
How to Forward a Template
In Practice: Forward
Go to the Planning Control Panel.
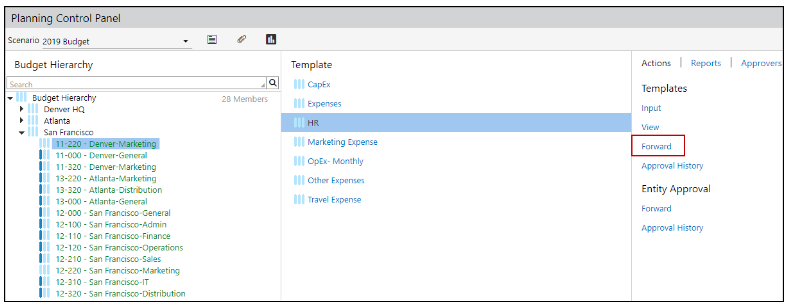
Select a scenario, a budget hierarchy entity member, and a template that is ready to be forwarded as shown in the image.
Click Forward.
How to Approve a Template
In Practice: Approve
Go to the Planning Control Panel.
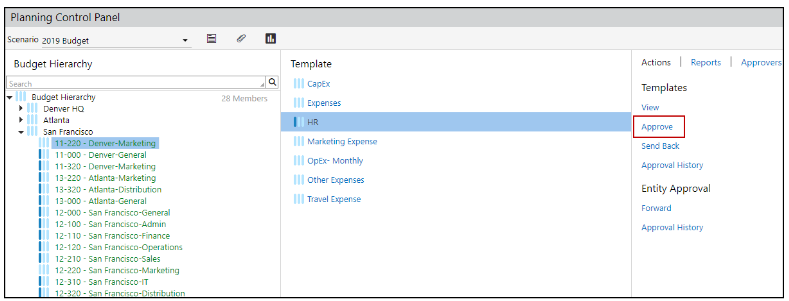
Select a scenario, a budget hierarchy entity member, and a template that is ready to be approved as shown in the image.
Click Approve.
How to Send Back a Template
In Practice: Send Back
Go to the Planning Control Panel.
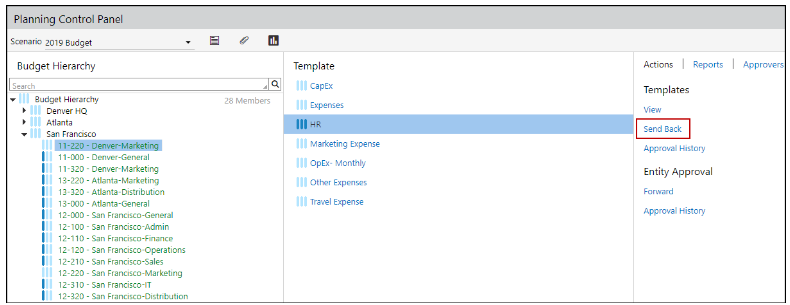
Select a scenario, a budget hierarchy entity member, and a template that you want to send back as shown in the image.
Click Send Back.
Complete Workflow Tasks Associated with a Scenario
When a workflow process is started, tasks are created for users for every workflow step. You can view these tasks in Task Manager grouped under each scenario.
You can complete the workflow tasks (created by Admin users) associated with a scenario by following these steps:
Go to the Task Manager page. A new task is available for the same scenario that has been assigned to you.
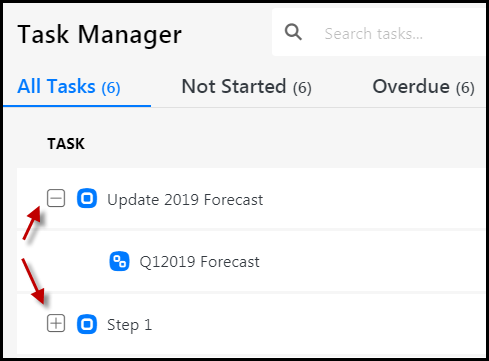
Click the Expand icon near the Scenario Code to view all the tasks associated with that scenario.
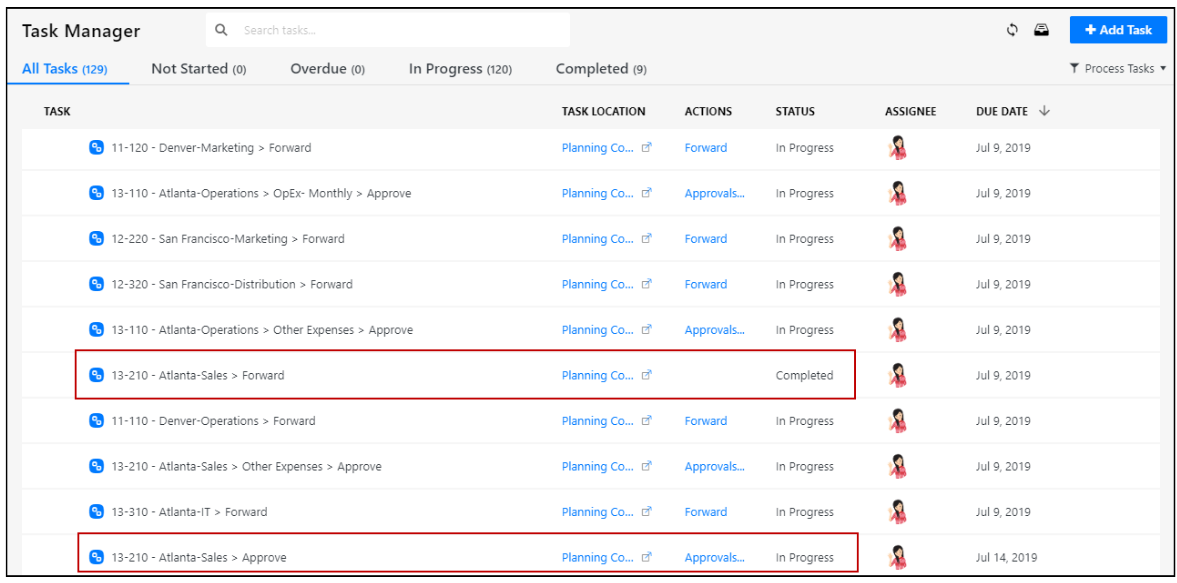
For the Forward task associated with the required budget entity/template, under the Actions column, click Forward. The budget entity/template is forwarded and the Status of the task changes to Completed.
You can complete the workflow actions from either the Task Manager, Planning Control Panel, Template Input pages or from the Offline Planning Template.
You can perform workflow actions in one place; and the changes are reflected in all other places. For example, if a Forward task is completed from the Task Manager page, the status of the budget entity/template will be changed in the Planning Control Panel, and vice-versa.
You can use the Planning Control Panel link to navigate to the budget entity/template on the Planning Control Panel page.
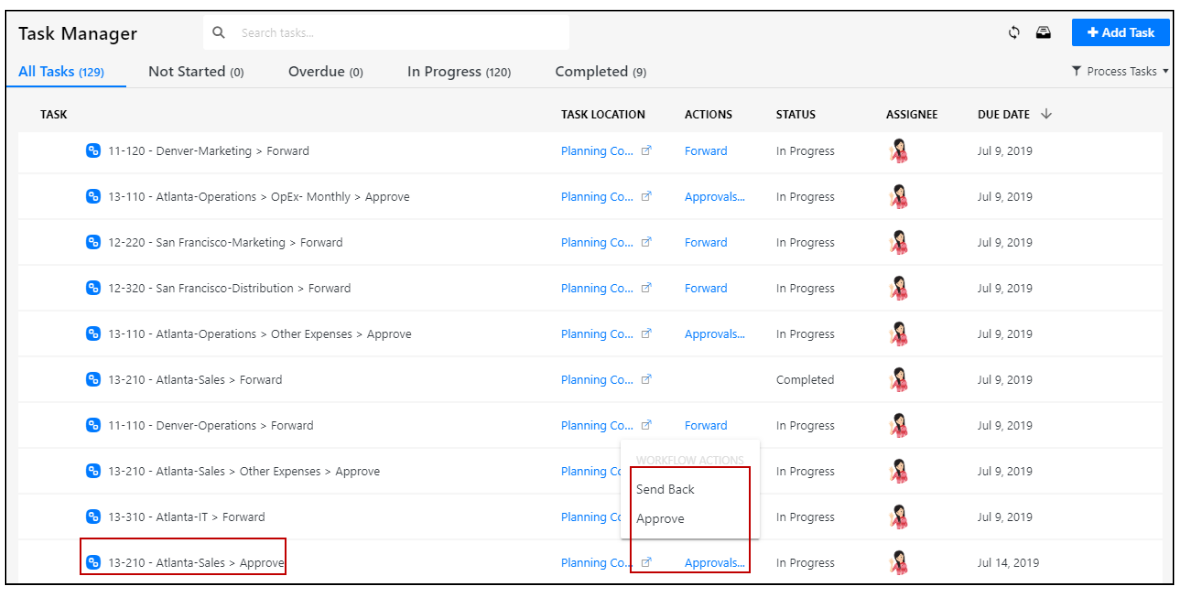
If you also have access to Approve privileges, another task for Approve will appear. For the Approve task, under the Actions column, click Approvals. A list of options appears. You can perform any of the following actions:
Click Approve. The approval of the budget entity/template is completed and the Status of the task changes to Completed.
If the task is associated with a template, all the workflow tasks for that template are completed. If the task is associated with a budget entity, a new Final Approve task is created if the Final Approve action is enabled.
If you want to send the task back to the previous state, click Send Back. The Approve task is deleted from the list of tasks and the status of the Forward task for the budget entity/template changes back to In Progress.
For the Final Approve task associated with a budget entity, you can perform any of the following actions:
Click Final Approve. The final approval of the Entity is completed and the Status of the task changes to Completed.
If you want to send the budget entity back to the previous state, click Send Back. The Final Approve task is deleted from the list of tasks and the status of the Approve task for the Entity changes back to In Progress.
Workflow Status
You can view the status of workflow actions on the Planning Control Panel page as a graphical report. This report provides information on the number of budget entities and their workflow status.
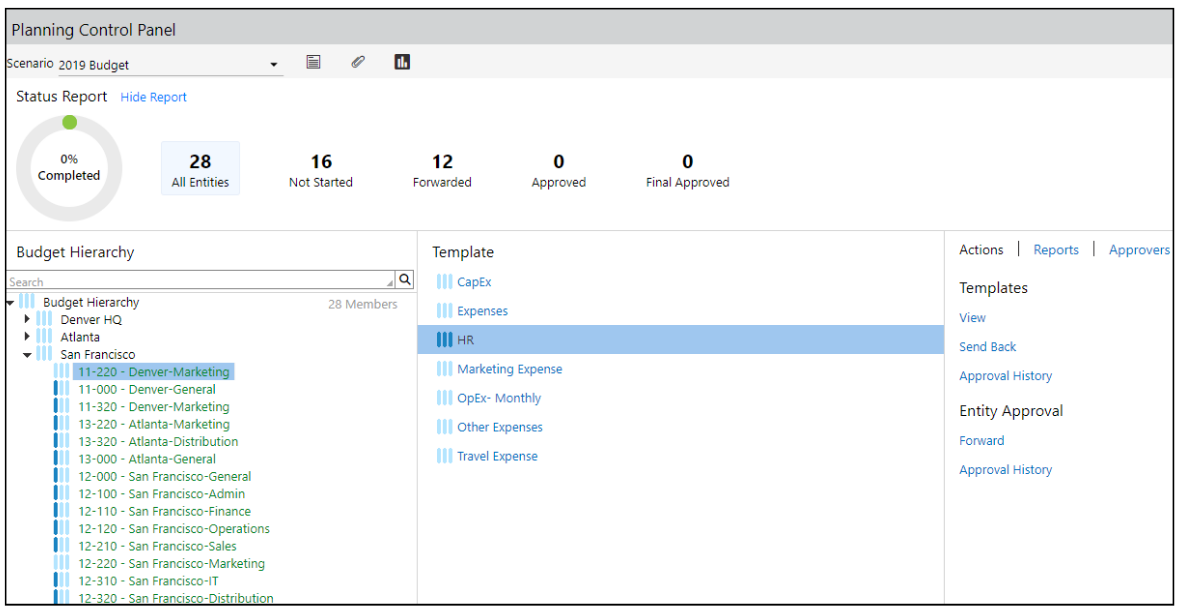
You can add comments before changing the status of a task.
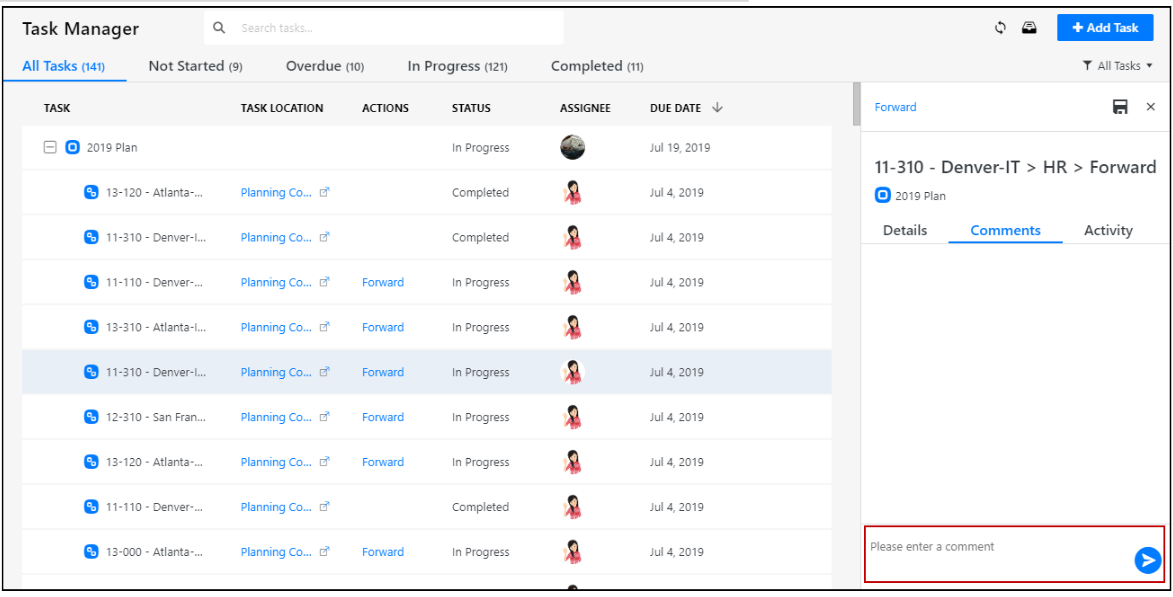
You can use the Planning Control Panel link to navigate to the budget entity/template on the Planning Control Panel page.
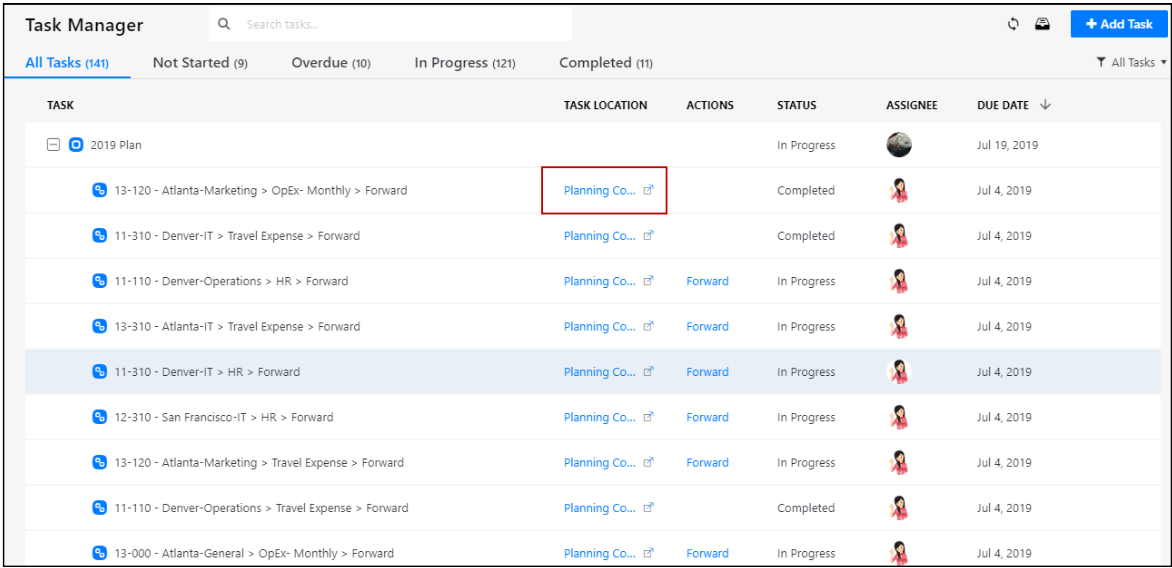
You can attach documents to a task.
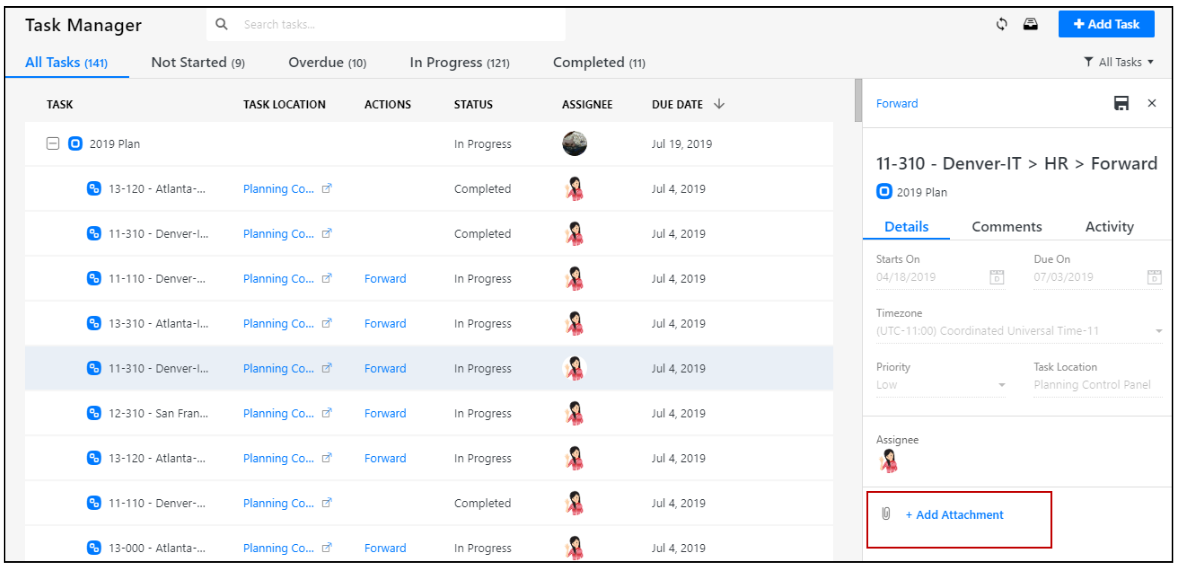
You can use the Process Tasks option under the All Tasks filter to view workflow tasks only.
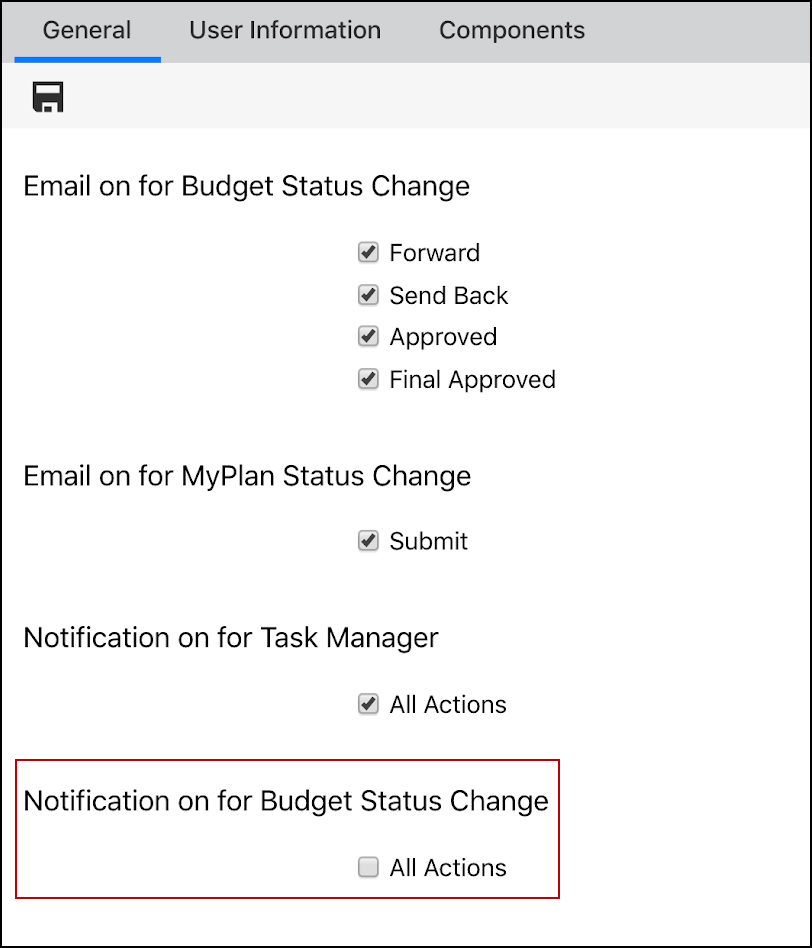
Notifications about the completion of tasks are sent to all users associated with the budget entity/template.
You can, however, choose to turn off the notifications if you do not want to be notified of all the changes. To enable/disable this setting, go to My Settings > General tab and then select/unselect the Notification on for Budget Status Change checkbox.
Best Practices
You can upload a document with the maximum size up to 5 MB.
The document can be of the following file formats: GIF, PNG, JPEG, JPG, TIG, TGA, DOC, DOCX, XLS, XLSX, PPT, PPTX, TXT, RTF, PDF, CSV, and VSD.
To perform workflow actions for a new budget entity/template on the Planning Control Panel page, Admin users must Sync the process from the Scenario List page. This also allows Admin users to view new and updated tasks for these budget entities/templates.
We recommend that you do not Forward a roll up that consists of a lot of child entities(more than 5000).
We recommend you to complete tasks in a logical order: template tasks first and then entity tasks. With the next release, we will introduce an additional functionality to automatically close lower-level tasks if the roll-up task has been completed.
Limitations
You cannot send back a task from the Task Manager page after the final stage of its associated budget entity/template has been completed. You can, however, perform this action from the Planning Control Panel page.
If you have copied a scenario and want to use workflow for that copied scenario, you must select the Enable Workflow for this Scenario check box on the Workflow Setup tab. This is to provide the workflow definition details; because the workflow definition of the source scenario is not copied by default.
MyPlan does not honor multiple authorizations in a workflow.
In Offline Planning, for a template that has multiple authorizations, you must refresh the template to view its updated stages.
Planning: Additional Workflow Actions for Entities
With the Fall18 release, we had provided additional template workflow functionality. This feature allowed you to perform an Approve All action from the Planning Control Panel to approve all leaf members and the parent member rollup selected in the budget hierarchy.
With this release, you can also perform Send Back All and Forward All actions.
The Send Back All and Forward All actions are beneficial as they eliminate the need to individually send back or forward members; thereby, saving time and reducing the number of clicks.
Use Forward All to forward all templates associated with the entity for approval. Use Send Back All to return all forwarded/approved templates associated with the entity to an In Progress state for revision.
In Practice: Forward All
Go to the Planning Control Panel.
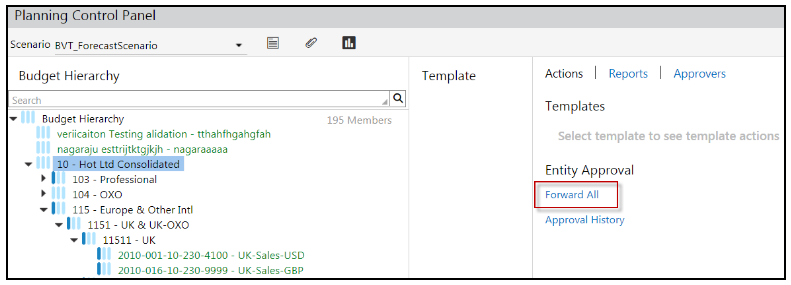
Select a scenario and a budget hierarchy entity member that is ready to be forwarded as shown in the image.
Click Forward All.
In Practice: Send Back All
Go to the Planning Control Panel.
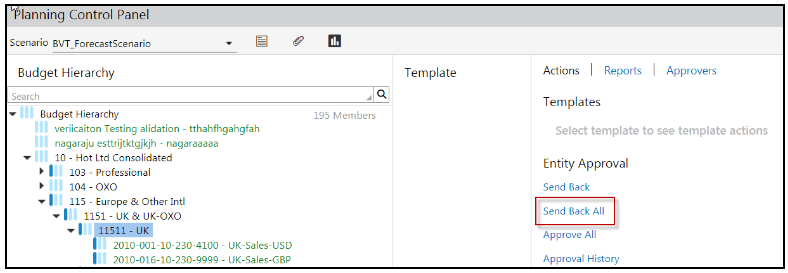
Select a scenario and a budget hierarchy entity member that has been forwarded and needs to be sent back for revision as shown in the image.
Click Send Back All.
Planning: Adjusted Annual Salary Field
With this enhancement, we have added an Adjusted Annual Salary field to the Employee Add/Edit and Employees list pages. This field displays the annual salary impact of employees each year, including the additional cost after calculating budget reviews. For instance, you may want to compute the yearly annual salary impact of an employee for different budget/forecast years starting with a $100K salary and an annual raise of 4.5%.
Prior to this release, you could access the yearly annual salary impact information from Employee reports, which required additional navigation.
Adjusted Annual Salary is accessible from the following areas of the application:
Employee Add/Edit Page (accessed from the Planning Control Panel only)
Employees Page (Employees List Page - accessed from the Planning Control Panel only)
Employees Export Page (available from the Employee List page - Export as Excel option)
Employee Add/Edit Page
End users can view and edit the adjusted annual salary of an employee by following these steps:
Open an HR template from the Planning Control Panel .
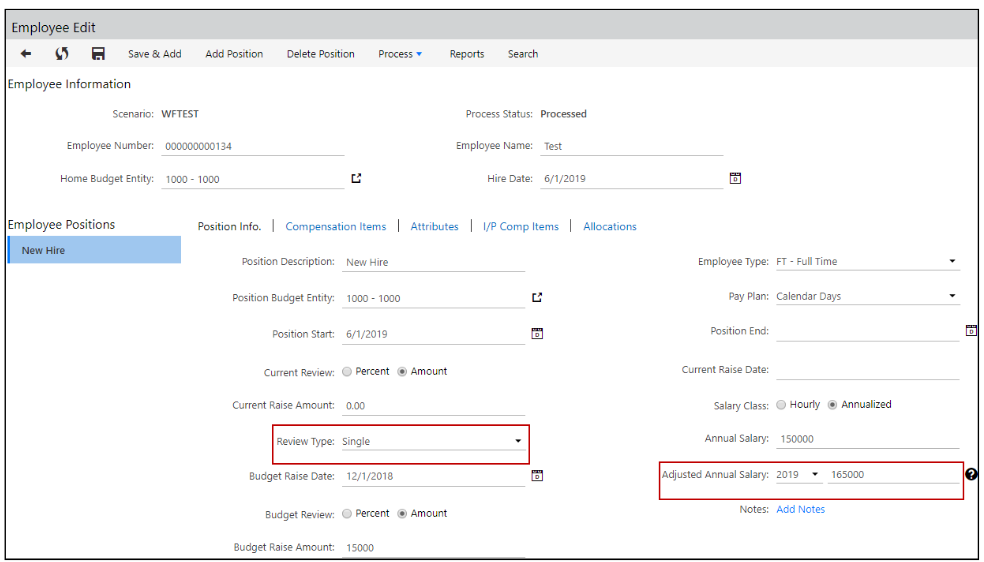
Click Employees, and then select Add or Edit. From the Review Type drop-down list, select Single or Multiple.
If you select Single, follow these steps:
Select Budget Raise Date, Budget Review, and then enter the Budget Raise Percent/Amount.
In the Adjusted Annual Salary field, select the year from the drop-down list. The Adjusted Annual Salary value is displayed for the selected year.
Click the Save icon or click Save & Add.
If you select Multiple, follow these steps:
- Select Budget Review as either Percent or Amount.
In the Budget Raise table, specify the budget raise date and Budget Raise Percent/Amount.
Tip! You can add and delete raise dates and percentages/amounts by clicking the Add or Delete icons.
In the Adjusted Annual Salary field, select the year from the drop-down list. The latest Adjusted Annual Salary value is displayed for the selected year.
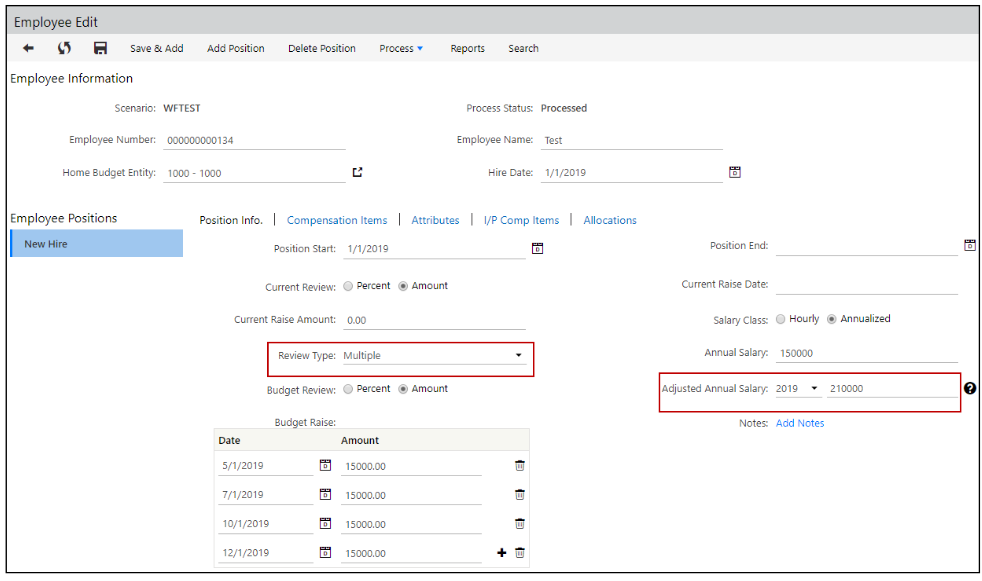
Click the Save icon or click Save & Add.
Employees Page (Employees List Page) Accessed from the Planning Control Panel
End users can view the adjusted annual salary from the Adjusted Annual Salary column on the Employees list page. Access the Employees list page by opening an HR Template from the Planning Control Panel. The latest Adjusted Annual Salary value is displayed for the selected year. You can change the year and view the updated Adjusted Annual Salary for the selected year.

Example 1: Annual Salary Calculation with Review Type as Single
The following example displays the budget raise of an employee in amount. The Review Type is selected as Single, so the budget raise occurs once in a year. In this case, the value in the Adjusted Annual Salary column is displayed for the selected year.
Period | Annual Salary | Budget Raise (Percent) | Budget Raise (Amount) | Adjusted Annual Salary |
Year 2018 | 150,000 | 10% | 15,000 | 165,000 |
Year 2019 | 165,000 | 9.09% | 15,000 | 180,000 |
Year 2020 | 180,000 | 8.33% | 15,000 | 195,000 |
Year 2021 | 195,000 | 7.69% | 15,000 | 210.000 |
Example 2: Annual Salary Calculation with Review Type as Multiple
The following example displays the budget raise of an employee in percentage and amount for the same fiscal year. The Review Type is selected as Multiple, so the budget raise occurs multiple times in the same year (2019). In this case, the latest adjusted annual salary for 2019 is 210,000 and it is displayed in the Adjusted Annual Salary column.
Period | Annual Salary | Budget Raise (Percent) | Budget Raise (Amount) | Adjusted Annual Salary |
May 2019 | 150,000 | 10% | 15,000 | 165,000 |
July 2019 | 165,000 | 9.09% | 15,000 | 180,000 |
Oct 2019 | 180,000 | 8.33% | 15,000 | 195,000 |
Dec 2019 | 195,000 | 7.69% | 15,000 | 210.000 |
Export of Employees Page to Excel
On the Employees page (accessed from the Planning Control Panel), from the More list, select Export as Excel.
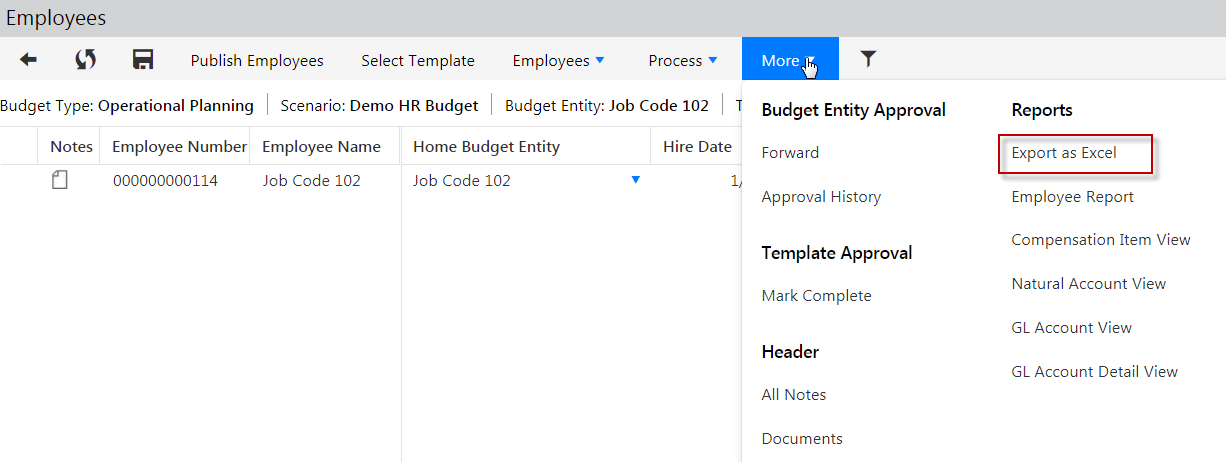
This exports the list of employees to an Excel spreadsheet. Open the spreadsheet; the Adjusted Annual Salary details are displayed for each employee.

Employee Add/Edit and Employee List Pages Accessed from Maintenance
When Admin users access the Employee Add/Edit and Employee List pages from the Maintenance menu (Maintenance > HR > Detailed HR), the Adjusted Annual Salary field will not be available; only the Annual Salary field is available. Additionally, if Admin users export the list of employees from the Employee List page accessed via maintenance, the Excel export document will not include the Adjusted Annual Salary field.
Planning: Full-Screen Mode
With this enhancement, you can use Planning on a web browser in full-screen mode. You can enable this feature by clicking the Full Screen icon (shown in image below) located at the upper-right corner of a window. This action hides the top banner and the left navigation pane in the application.
Full-screen mode allows you to utilize the entire screen space to view data. This mode declutters the screen by hiding unimportant toolbars and menu items, which allows you to view more relevant data on the screen.
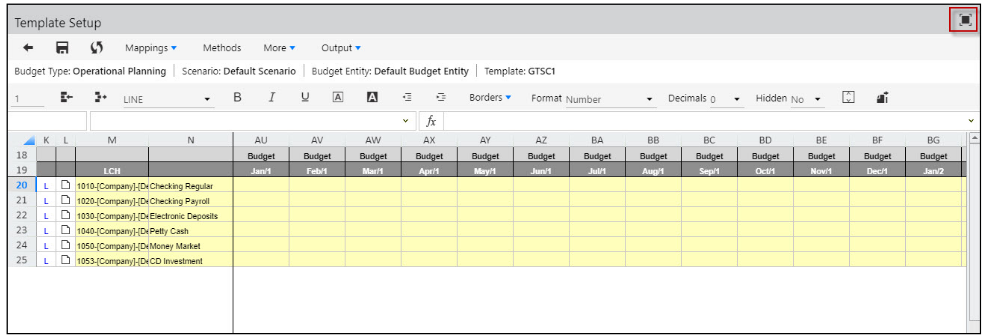
Mac users can press the F11 key for Windows or use the Ctrl+Command+F combination to enable the full-screen mode. This feature is not supported in the Microsoft Edge web browser.
If you want to exit full-screen mode, click the Full Screen icon or press the ESC key (this functionality is supported in all web browsers except IE11) on your keyboard.
The full-screen mode in Planning is available for the following pages:
- Template Setup page for the following templates:
Global Template – Single Copy
Global Template – Entity Copy
Allocation Template
Block Template
- Template Input and View pages for the following templates:
Global Template – Single Copy
Global Template – Entity Copy
Allocation Template
Line Item Template
- Employee Add/Edit and Employees pages for the following template:
- Detailed HR
- Template Setup and Input pages for the following template:
- Actual Data Templates
- Setup and Input pages for the following template:
- Capital Template
Reporting: Show Subtotals and Show Grand Total in Dynamic Reports
You have the capability to show or hide the subtotals and grand total functionality in the Dynamic report. The following options have been added to the More list box:
Show Subtotals
Show Grand Total
The above options are enabled in the More list box if:
Dimensions are mapped to the Row and Column axis.
More than one dimension is mapped in the Row axis.
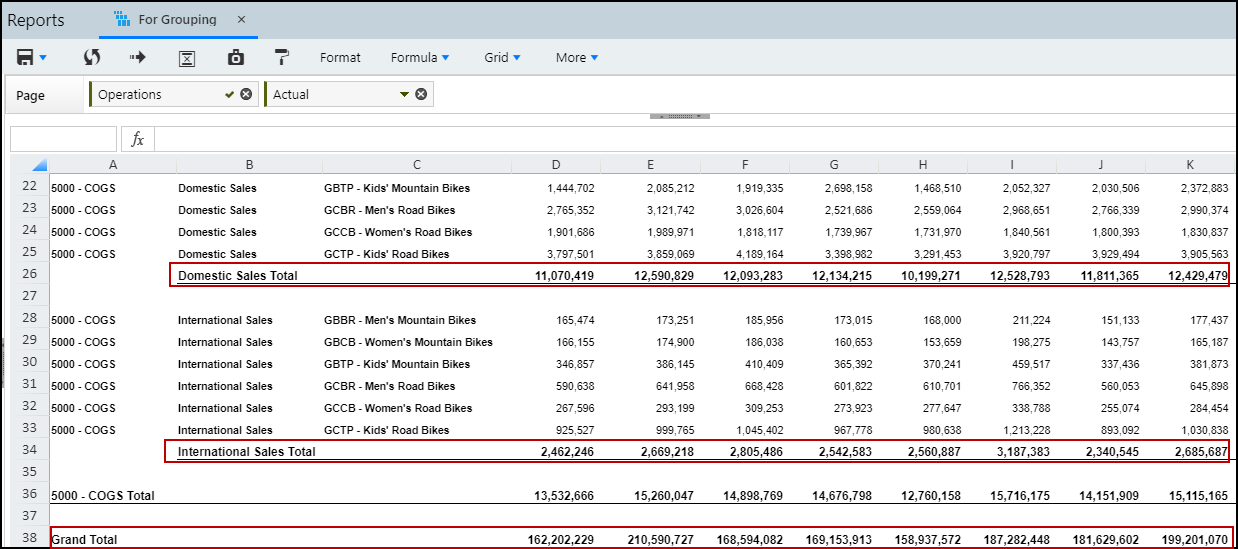
- The subtotals are displayed at the end of each section and the grand total is displayed at the end of the report as shown in the image below.
In Practice: To access the options
Open a Dynamic Report.
Select the More list box.
Select Show Subtotals or Show Grand Total.
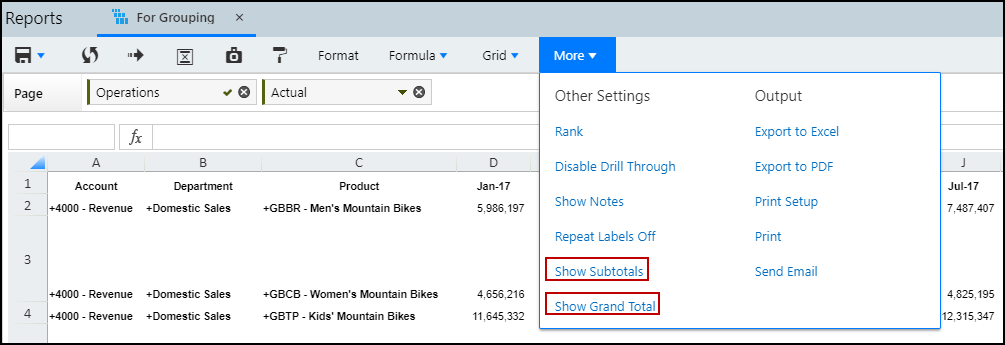
You can change the format of subtotals and grand total if the Format button is enabled in the Dynamic Report toolbar.
The following options are disabled when Show Subtotals or Show Grand Total is enabled:
The Formula Exceptions and Insert Rows / Columns options in the Formula list box is disabled. Only the existing Formula Exceptions on the Dynamic report are applied on the adjusted cells and included in the subtotal or grand total calculations. The existing Insert Rows / Columns are not visible when Show Subtotals or Show Grand Total is enabled in the report.
The Pivot, Sort Ascending, and Sort Descending options in the Format list box are disabled.
Subtotals and Grand Total are retained in the Report Collection, FPP, e-mail attachment, linked reports, PDF, and Google sheet.
When you export a report to excel:
Grouping of subtotal is retained as shown in the image below.
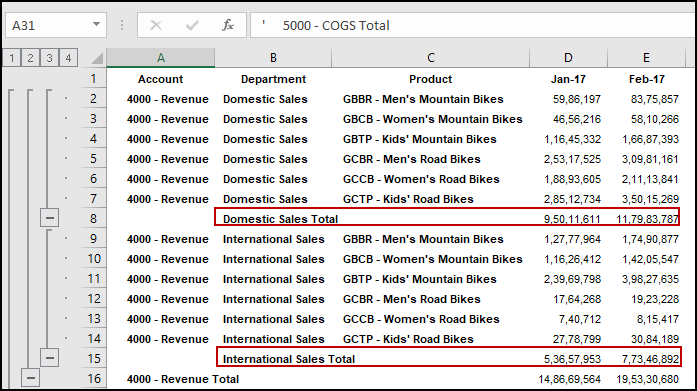
Pivot and Macros are not supported if the subtotal option is enabled.
Reporting: Drill Through Enhancements
The Drill Through functionality in Dynamic Reports and Dashboards has been enhanced with this release.
The following enhancements have been added to Drill Through:
Reporting dimension filters on the Consolidation tab
You can filter Drill Through data based on Reporting dimensions for the Consolidation tab.
For example, If the Reporting dimension is mapped in the report and you filter data based on the Adjustments member, then data related only to the Adjustments member is displayed in the Drill Through report as shown in the image below.
 The Drill Through report is shown in the image below.
Save Settings and Reset Settings in the Drill Through Report
The following options have been added to the Drill Through report toolbar:
Save Settings: You can now save the following settings applied in the Drill Through report:
Code, Name, Label display
Turn ON/OFF
SHOW/HIDE COLUMNS
Order and width of the columns
The settings are retained when you access the Drill Through report from Dynamic Reports and Dashboards.
Note:You cannot save Sort and Filter modifications in the Drill Through report.
Reset Settings: You can now reset the settings to default by using this option.

Reporting: Enhancements in the Dynamic Report Toolbar
The following enhancements have been made in the Dynamic Report toolbar:
- The Other Actions option in the More list box has been changed to Other Settings. The Other Settingsoption includes the following:
Rank
Disable Drill Through
Show Notes
Repeat Label Off
Show Subtotals
Show Grand Total
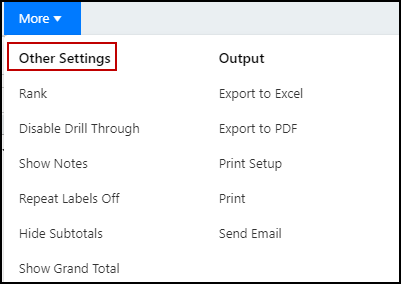
The Grid Actions option in the More list box is now available in the toolbar as Grid list box.
The Sort Ascending, Sort Descending, and Pivot are now available in the Grid list box.
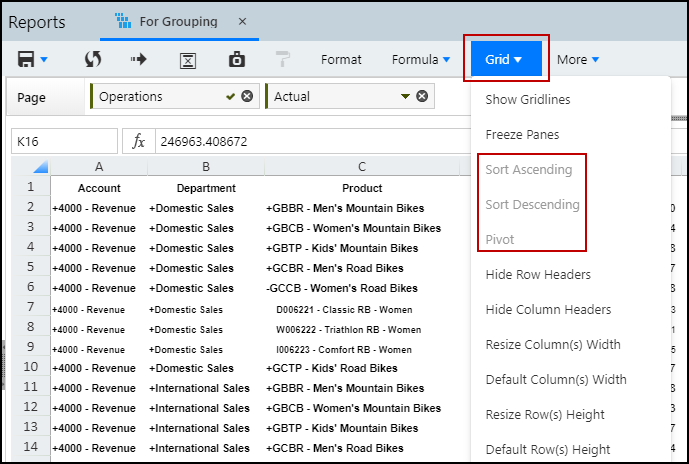
Reporting: Row Height and Column Width Adjustment in the Dynamic Report
You now have the ability to adjust the row height and column width in a Dynamic Report using the following options:
Grid: You can select a row or multiple rows and resize the row height and column width from the grid. The row height adjustments can be applied to any rows in the grid containing hierarchies, variables, headers, Excel formulas, variance, Insert Formula, Formula Exceptions, and notes of the Dynamic Report. The height and width adjustments are saved once you save the Dynamic report. When you update the row height, the adjustment is retained in the row irrespective of the content size.
Toolbar menu: The following options have been added to the Gridlist box in the Drill Through report toolbar:
Resize Column(s) Width
Default Column(s) Width
Resize Row(s) Height
Default Row(s) Height
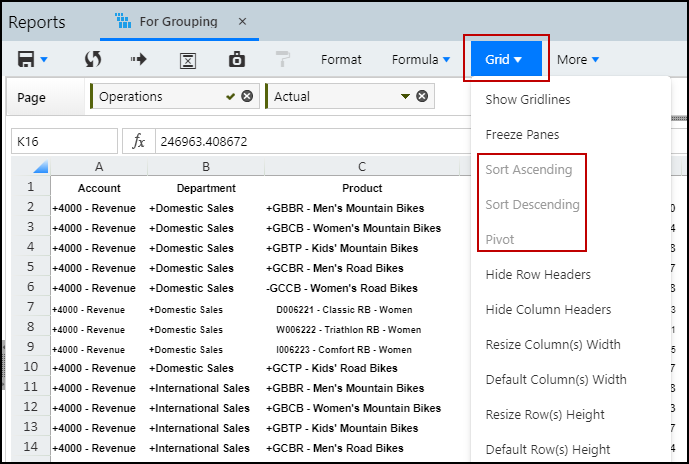
In Practice:To resize the row height or column width
Select the Resize Column(s) Width or Resize Row(s) Height from the Grid list box. A pop-up window is displayed.
Update the width or height.
Click Ok.
Additionally, you can drag and resize the row height or column width using the mouse.
The image below displays the Resize Column(s) Width pop-up window.
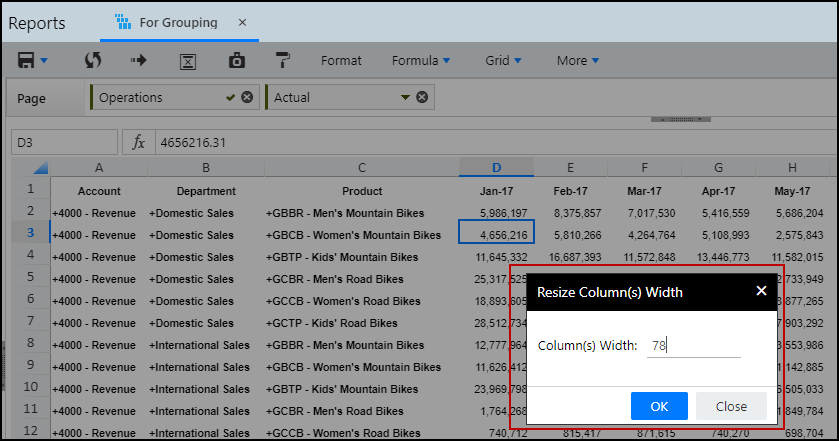
When multiple rows or columns with different sizes are selected, the size of the first selected row or column is displayed in the pop-up window.
You can now reset the row height or column width to default by using the Default Column(s) Width or Default Row(s) Height options. All rows and columns are updated if this option is selected.
The row height and column width adjustments are retained when you export a report to Excel, and in a Report Collection, FPP (Financial Package), e-mail attachment, linked reports, PDF, and Google sheet. Additionally, the width and height adjustments are visible when you export the Dynamic Report to Excel without saving the report.
Best Practices
Size of the column or row is specified in pixels.
Size applies to the entire row or column and cannot be changed by a cell.
Use shortcut keys CTRL or SHIFT to select multiple rows or columns and drag to resize them or use the toolbar menu option.
Use double-click to auto-fit the contents.
Set the size to 0 to hide a row or column. Use the Default Column(s) Width or Default Row(s) Height options from the Grid list box to reset the size.
Maximum size allowed is 999. By default, the row size is 20. The column size varies depending on the content.
Select the Show Row Headers or Show Column headers option from the Grid list box to use mouse for adjusting the size.
Limitations
Row height adjustments are not supported for header or footer rows.
When you drill down on a rollup member, row height adjustments are retained with the row where it was originally applied and does not automatically move with the member on the row.
Size cannot be copied from one row or column to another.
Reporting: Enhancements in Report Collection Distribution
The following enhancements have been made to the Report Collection Distribution in this release:
Additional Rule Types in Bursting
- With this release, rule types have been added to the drop-down list in the Select Members pop-up window under the Bursting Criteria section. You can apply the rule type when you run Report Collection. This ensures that any new member added to the hierarchy is pulled dynamically to Report Collection.
The following rule types are available in the drop-down list:Selected (default) - Members in the tree, as selected by user
Children - Immediate children of members, as selected by user
All Children - All levels of children under the selected member
Selected + Children - Selected members, and their immediate children
Selected + All Children - Selected members, and all levels of children under them
Leaves - Leaf members at all levels under the selected members
Selected + Leaves - Selected members, and their leaf members, at all levels
Selected + Parents - Selected members, and their immediate parents
The image below shows all the available rule types.
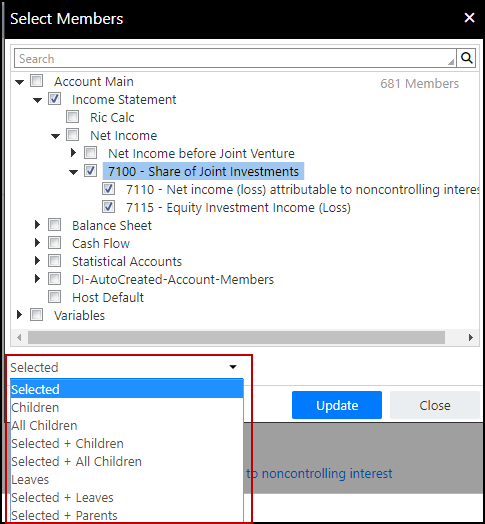
Prior to this release, only two rule types were available in the drop-down list.
The members are not visible in the distribution list as rule types are dynamically applied to Report Collection at run time instead of selecting the members while creating the report.
The following additional options have been enabled for the Time dimension:
Year
Quarter
Month
Trailing
A Display Parents Last checkbox has been enabled for the Selected + Children, Selected + All Children, Selected + Leaves, and Selected + Parents options.
You can apply rule types to Main, Alternate, Attribute, Attribute Hierarchies, and Substitution (Standard and Derived) Variables when for Bursting dimensions. Additionally, rule types are available in all Reporting Areas (Financial, Sales, Scorecard, Workforce)
Rule types are not available for Other Page Dimensions Member Selection.
Configure Bursting Dimension Security for Report Collection
An Apply Bursting Dimension Security of Recipient checkbox has been added to the Settings page as shown in the image below.
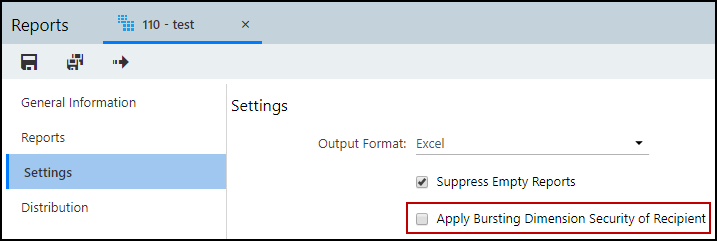
You can apply the recipient’s dimension security to the Report Collection output files using this enhancement. If the Apply Bursting Dimension Security of Recipient checkbox is selected for every user added in the distribution list, the corresponding reports are generated after applying specific dimension security. The selected dimension security is applicable to PDF, Excel, and Google Sheet output.
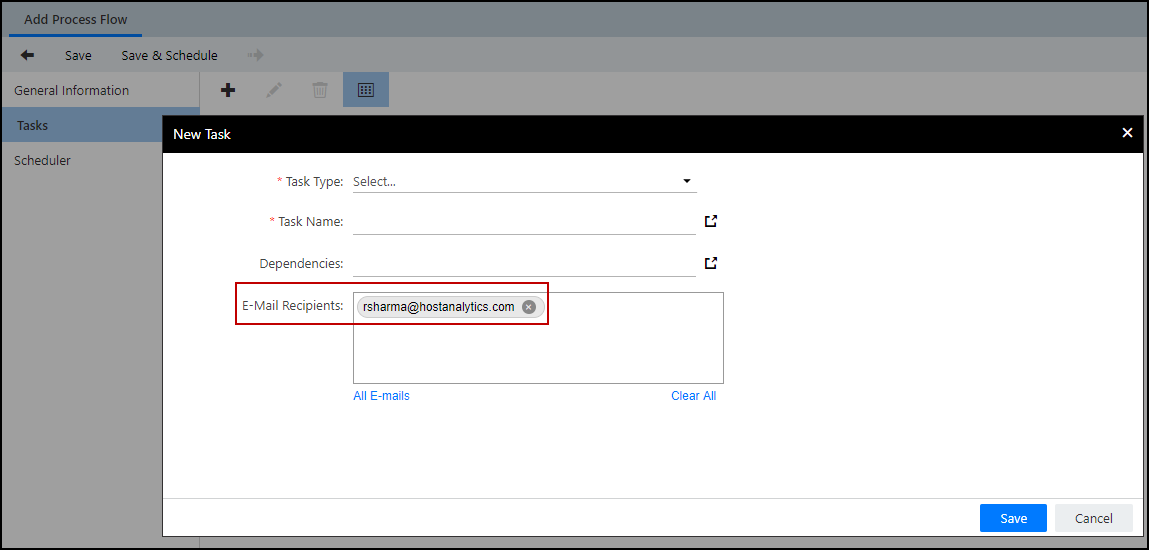
You can also add recipients from the New Task pop-up window as shown in the image below. The Report Collection output files are distributed to these recipients in addition to the distribution list configured in the Report Collection. The sender’s dimension security will be applied while generating the Report Collection output.
Any aggregated data for a rollup member is not visible and the report tab is suppressed if:
A user has access to a member in the hierarchy but does not have access to its rollup.
The rollup is included in the Report Collection.
The Apply Bursting Dimension Security of Recipient option is enabled for the Report Collection.
Report Collection E-mail Customization
The Report Collection notification e-mail has been enhanced in this release. You can now:
Customize the subject and body of the e-mail.
Add e-mail addresses of Host and non-Host users in CC.
Add Substitution (standard) Variables to the subject and the body of the e-mail.
Additionally, we have enhanced the system generated e-mail for Report Collection.
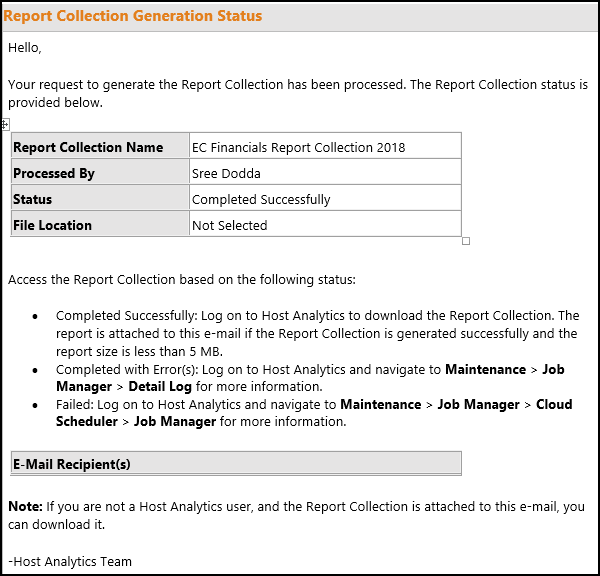
The image below displays the Compose Email pop-up window.
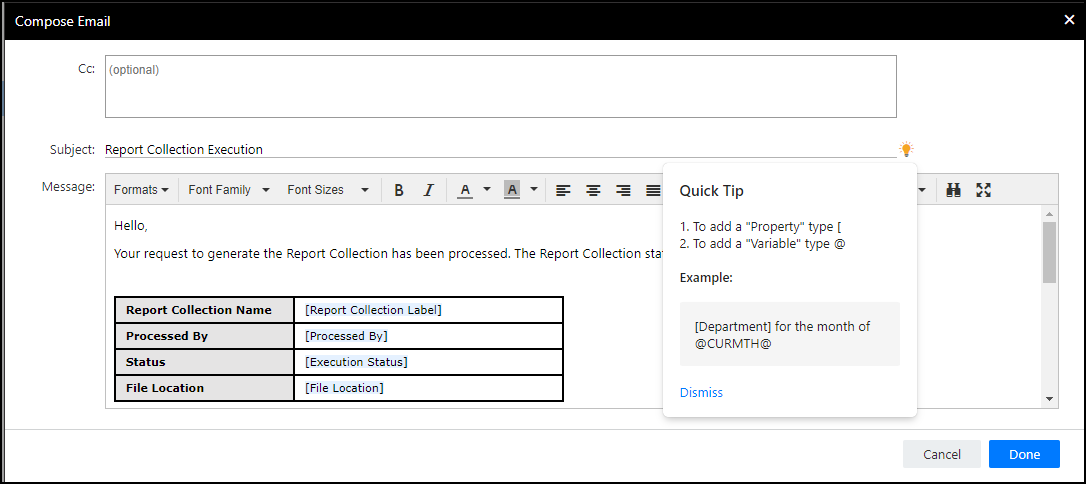
The following report properties can be added to the subject and the body of the e-mail:
Report Collection Code, Report Collection Name, Report Collection Label, Bursting Tab Name, Bursting Dimension Member Label, Output File Name, Report Collection execution Status, Processed By, and File Location (folder path where Report Collection output files are saved).
E-mail Recipients and Attachment Note(s) can be added only in the body.
All text editor formatting features are enabled in the body of the message.
Click Done in the Compose Email pop-up window to save the e-mail. The e-mail format is retained when you copy the Report Collection.
If the Send e-mail notification to user(s) checkbox is selected for a Report Collection, the default or updated e-mail is sent to the distribution list after the Report Collection is generated. Properties and Substitution Variables are dynamically updated with the appropriate values for each output file when you send the e-mail. Dimensions are updated for all the corresponding bursting dimension member names.
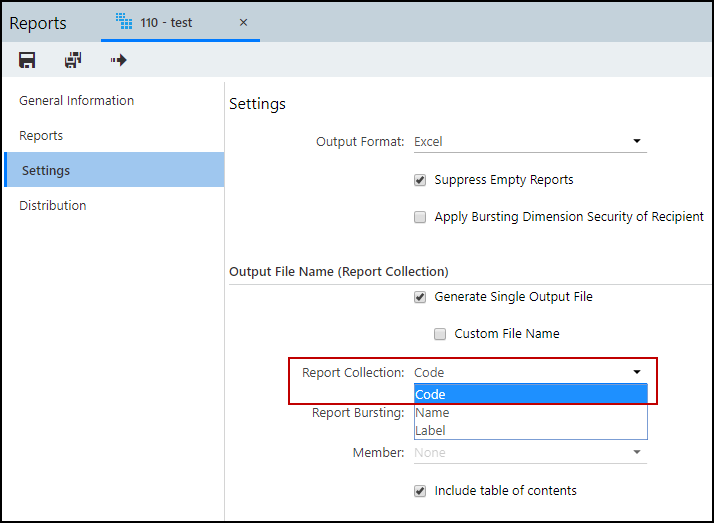
The bursting dimension names are displayed based on the Report Collection value (Code or Name or Label) selected from the Output File Name (Report Collection) section. By default, the Report Collection value is set to Label.
Reporting: Name Change from Preview to Run in Verify Data
With this release, the Preview label is changed to Run in the toolbar of the Verify Data page.

Reporting: Full-Screen Mode
With this enhancement, you can now view all Reports on the web browser in full-screen mode. You can enable this feature by clicking the Full Screen icon (shown in image) at the upper-right corner of any Reporting window. Alternatively, you can press the F11 key for Windows or use the Ctrl+Command+F combination for Mac to enable the full-screen mode. This action hides the top banner and the left navigation pane in the application
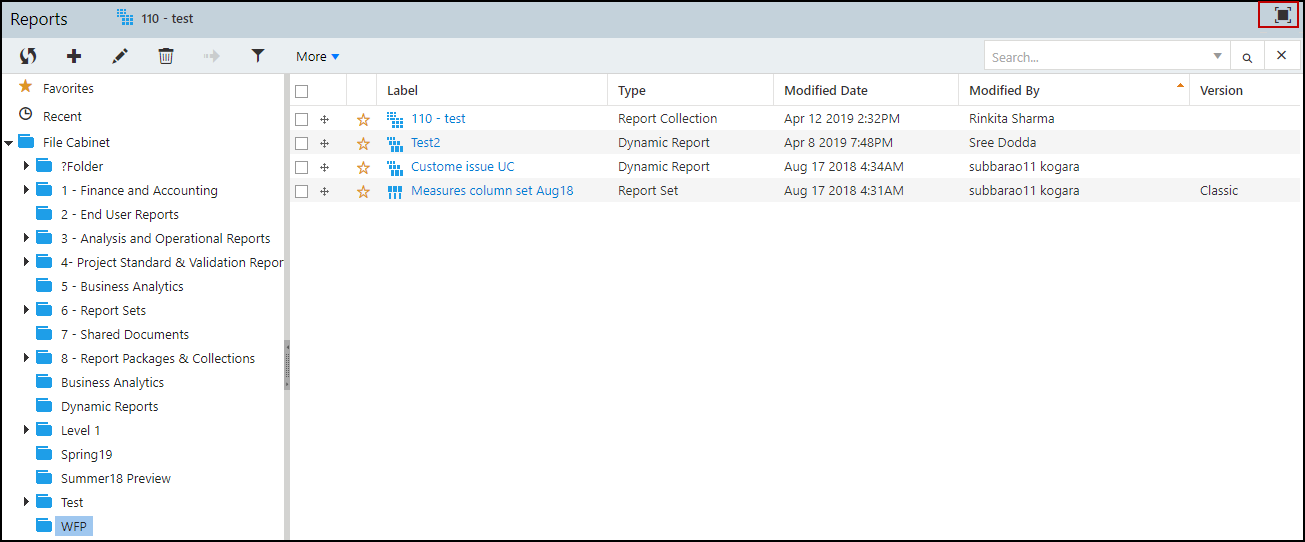
If you want to exit the full-screen mode, click the Full Screen icon or press the ESC key on your keyboard.
Dashboards: Usability Improvements
With this release, a field Suppress Empty and Zero Values is added to the NUMBER FORMAT section in the Properties tab for Line Charts and Combination Charts. If you select this field, zero and empty values are ignored and not plotted on the chart.
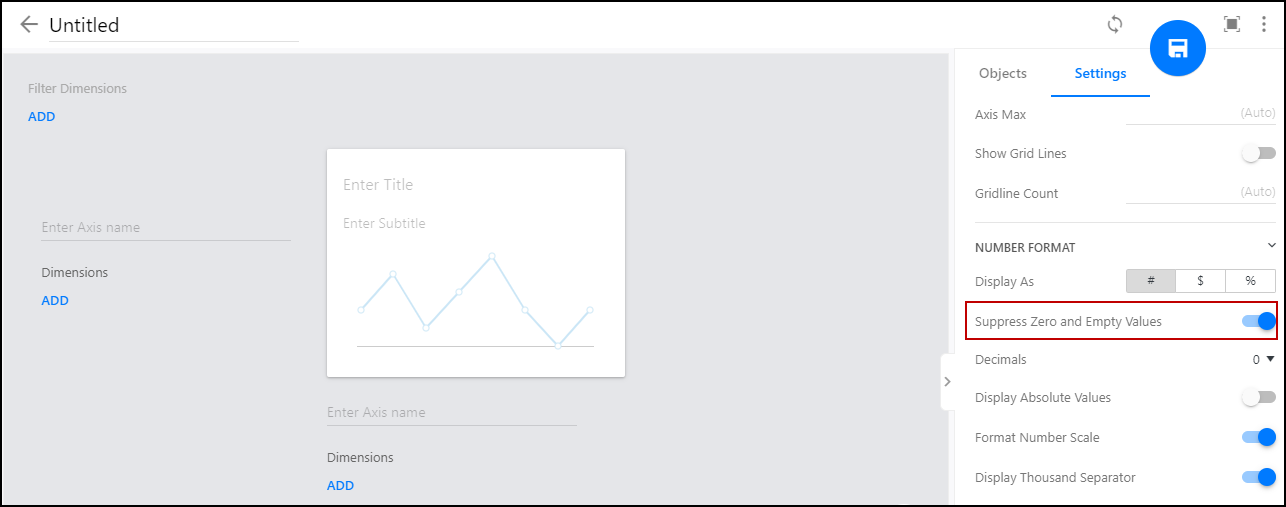
The field is also displayed in Combination Chart if Line Chart is applied on vertical or secondary axis. By default, the field is selected on all existing and new Combination Charts. The field is applicable to all Reporting areas and models.
Dashboards: Bridge Waterfall Charts
With this release, Bridge Waterfall Charts are now supported in Dashboards. A Bridge icon is added to the Waterfall Chart as shown in the image below.
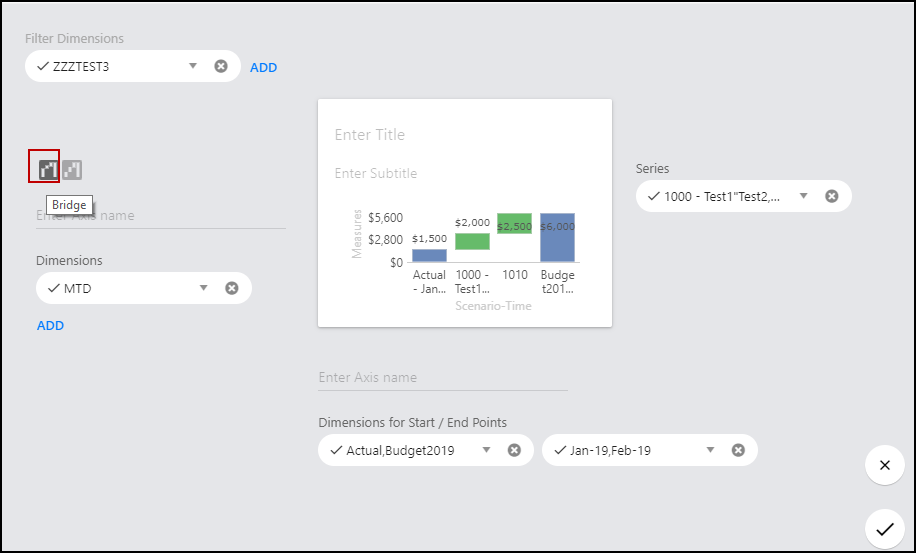
You can select dimensions for the Start and End Points on the horizontal axis.
The first member selected in each of the dimensions is plotted as the Start Point and the second member selected in each of the dimensions is plotted as the End Point in the chart. The dimension members selected from Series are plotted between the Start and End points and the variance is calculated for the selected dimension. By default, the positive variance is displayed in green color and the negative variance is displayed in red color.
In Practice
To change the color of Start, End, and variance points navigate to Settings > Style.
All the settings that are currently available for Classic Waterfall Chart also applies to the Bridge Waterfall Charts. The Bridge Waterfall Charts is available for all Reporting Areas (Financial, Workforce, Scorecard, Modeling).
Dashboards: Negative Number Formatting in Table and KPI Charts
With this release, a Negative Number option has been added to the NUMBER FORMAT section under Settings for Table and KPI charts. This option allows you to display a negative number in the chart. By default, the negative number is within the red parentheses across all existing and new charts.
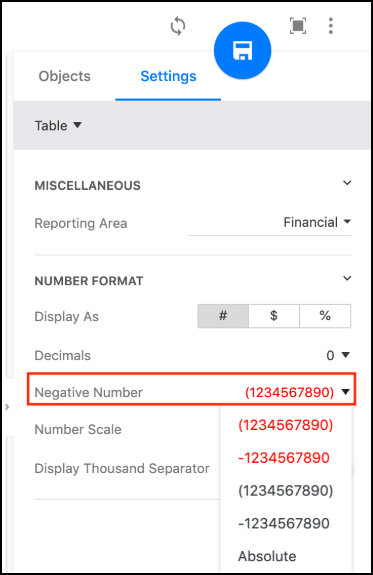
The Negative Number option applies to all columns in a table. Additionally, this option is available in all Reporting Areas (Financial, Workforce, Scorecard, Modeling). The negative number will be visible in the Drill Through report if the Negative Number option is enabled for a chart.
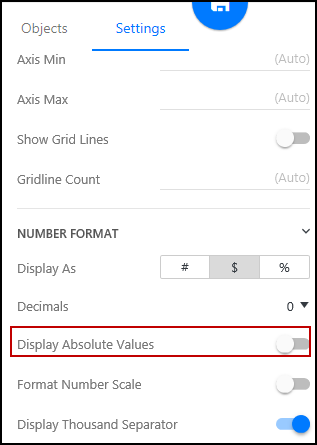
Dashboards: Display Absolute Values Option in Settings
A Display Absolute Values option has been added to the NUMBER FORMAT section under Settings for all the chart types except Table, KPI, Pie, and Doughnut charts. If the option is enabled, all the negative values are displayed as positive values in the chart scale, data values, tool tips, and so on. Additionally, this option is available in all Reporting Areas (Financial, Workforce, Scorecard, Modeling). The absolute values will be visible in the Drill Through report if the Display Absolute Values option is enabled for a chart.
Dashboards: Attributes Support for Modeling Charts
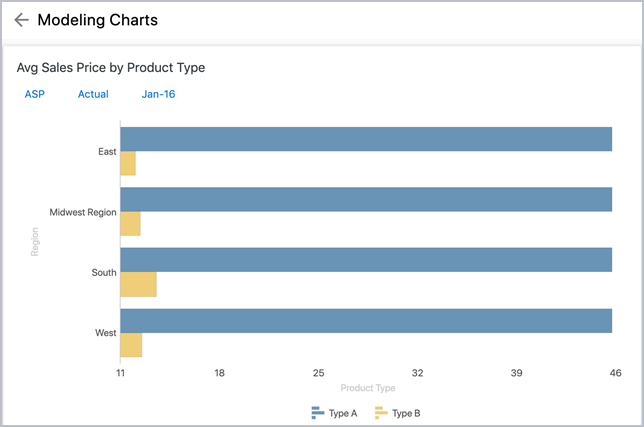
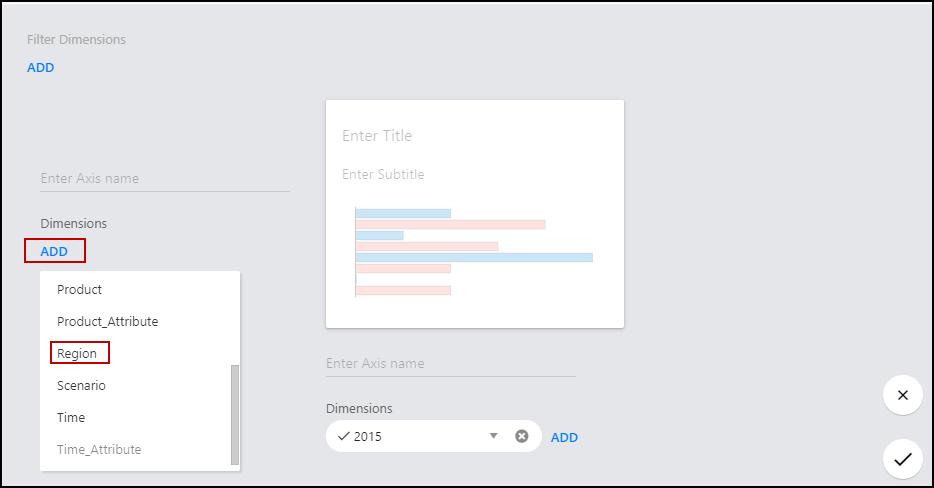
With this release, Modeling Attributes are now available in Dashboards.
The image below displays a bar chart showing the Region attribute.
In Practice
You can select the required attribute from the ADD search box as shown in the image below.
Dashboards: Cell-Level Formatting in Dynamic Report is Enabled for All Customers
The cell-level formatting options in Dynamic Reports are now enabled by default for new and existing tenants.
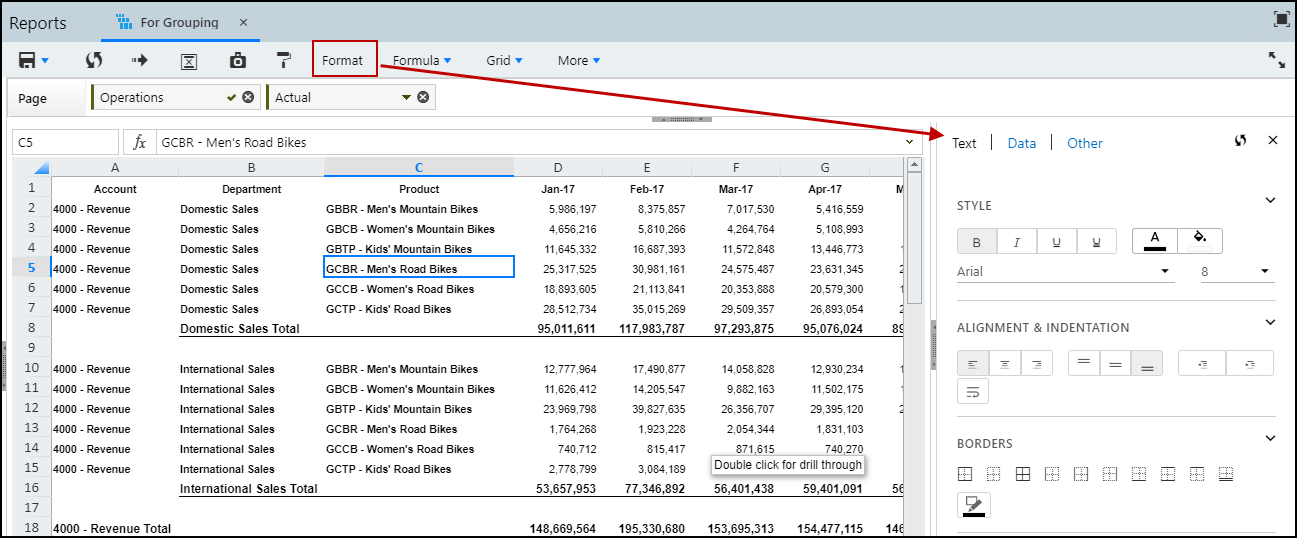
Prior to this release, the cell-level formatting options was enabled in the application by the Support team.
Consolidation: Status
Accessing and Dissecting Consolidation Status
Understanding the Status Indicators
Legacy Functionality Versus Consolidation Status
Introduction
Gain insight into your close cycle with the all Consolidation Status feature. This robust feature provides at-a-glance dashboard-like stats on the progression of each consolidation unit for a given close cycle. Consolidation Status allows you to control your close process at a more granular level with additional transparency.
Some highlights include:
Percent complete within a close cycle for all processes
New company hierarchical format to easily identify rollups and leaf members
New indicators to identify consolidation unit by fiscal year and status
A convenient legend for quick reference
Before you can start using the Consolidation Status feature, you must enable it. Enabling this feature is quick and easy. Click here and follow the steps provided.
Once you’ve enabled Consolidation Status each consolidation unit will have an inherent life-cycle associated with it. This life-cycle includes several statuses to indicate where the consolidation unit is within the life-cycle. Consolidation Status offers several benefits, such as; providing the necessary information to complete the close process in a timely manner and allows consolidators to view the status by entity and time period they are responsible for.
Enabling Consolidation Status
There are two stages within the consolidation status lifecycle (Consolidated and Locked), which have period referential integrity to ensure data integrity. This means that you cannot consolidate or lock a consolidation unit until the prior period's unit is also consolidated\locked. However, you can perform a one time mass update of status up to a chosen period. This is achieved using the Consolidation Status Setup. This setup also enables the Consolidation Status feature for your application and cannot be rolled back.
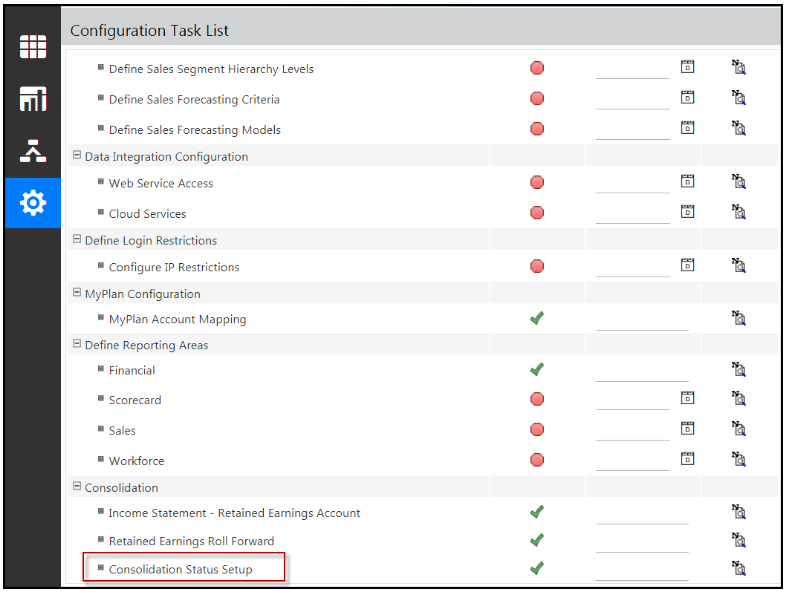
Navigate to Maintenance > Admin > Configuration Tasks.
On the Configuration Tasks page, click the Consolidation Status Setup task shown below to enable this functionality.
The Consolidation Status Setup page is launched. Select the month and year in which you want to start Consolidation Status and select the Enable Forward and Approve Status for Consolidation Process checkbox as shown below. Then, click Save.

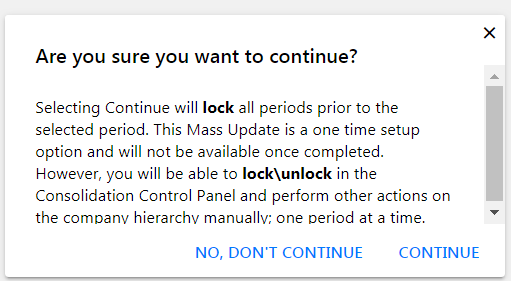
Click Save & Complete. The message below displays. Click Continue.
Accessing and Dissecting Consolidation Status
Accessing Consolidation Status
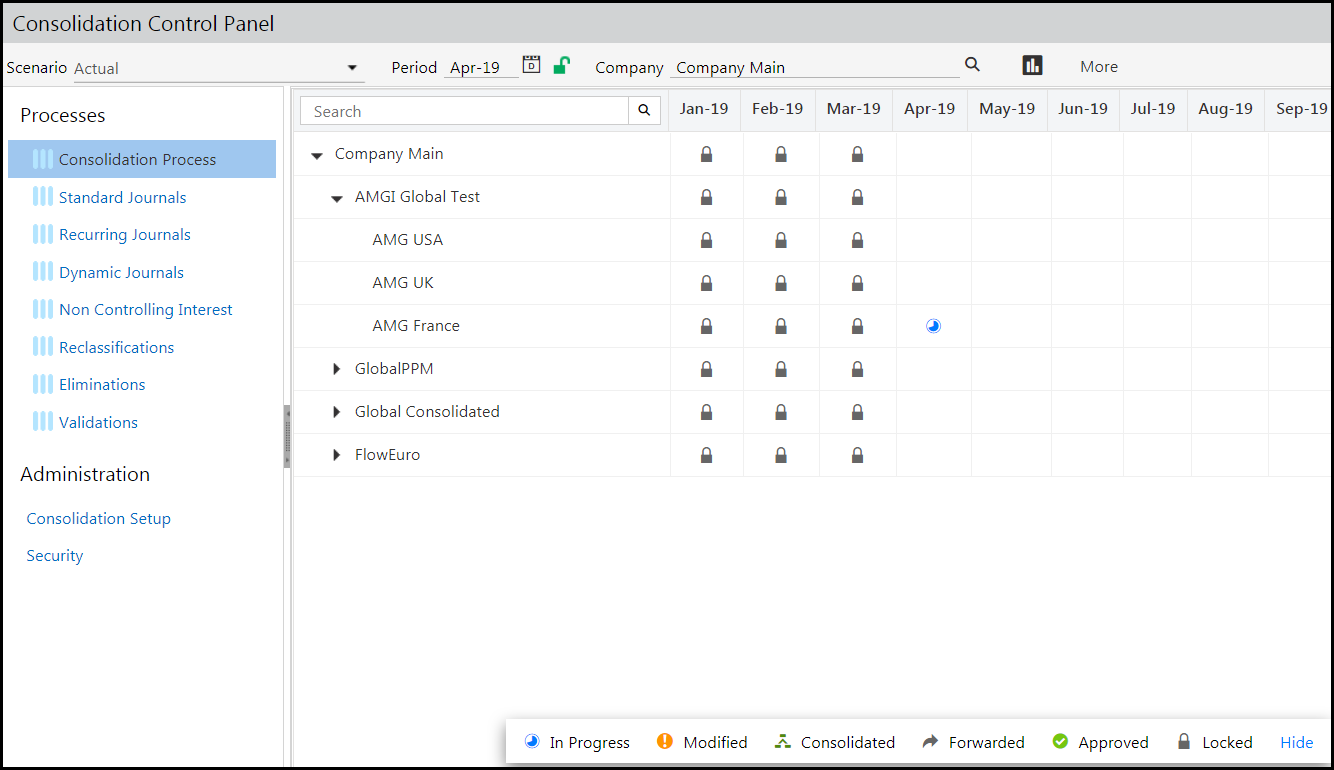
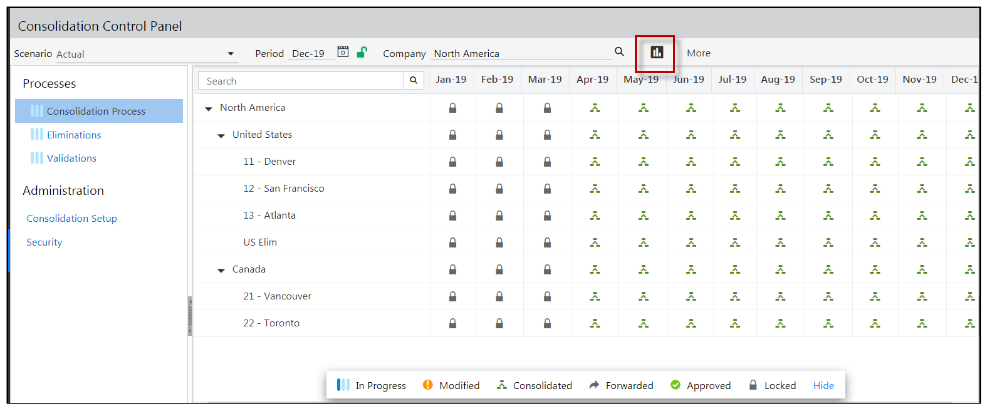
Once Consolidation Status Setup is complete, access the Consolidation Control Panel and, under Processes, click Consolidation Process. The Consolidation Status screen appears (as shown below) for a consolidation unit (the Actual scenario, period, and company).
Dissecting Consolidation Status
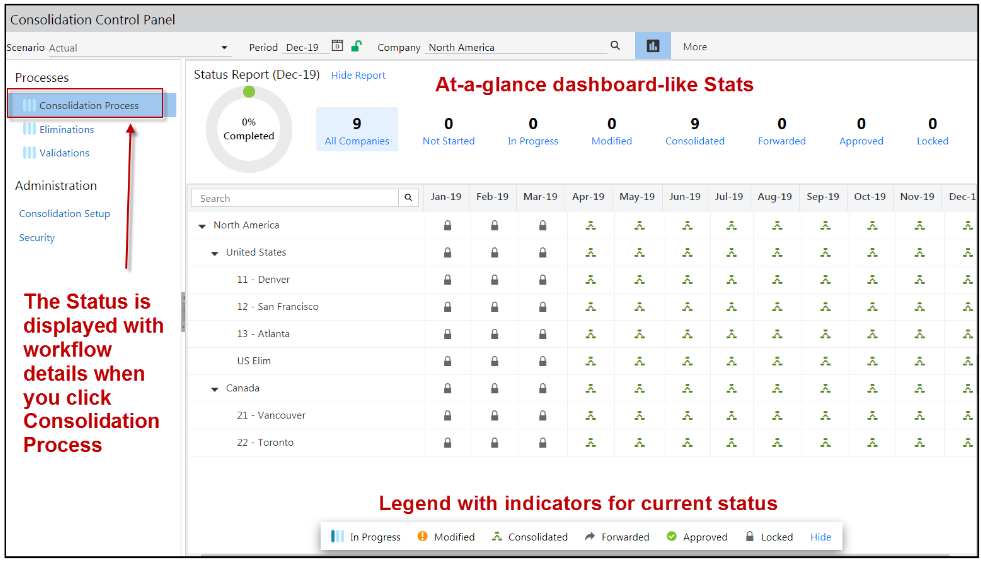
This section describes all the features available for Consolidation Status. Notice the new company hierarchical format to easily identify rollups and leaf members. And, indicators identify consolidation unit by fiscal year and status. The page below also shows the legend and the status report.
Search
Use the Search bar to quickly find members within the hierarchy. This eliminates the need to expand and collapse members to locate a specific member.
Report Icon / Status Report
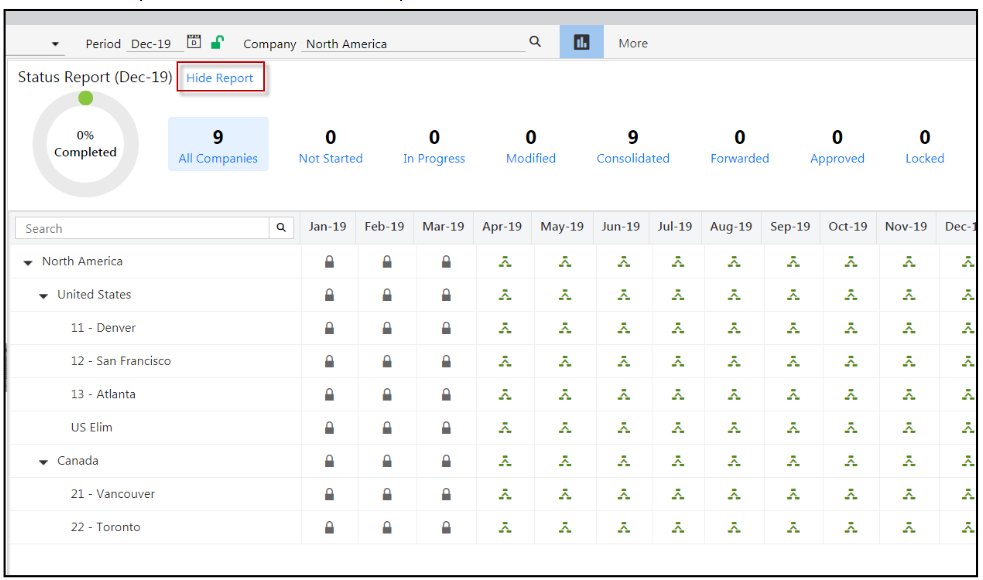
Click the report icon to display the Status Report. The Status Report provides information on:
Percent of companies locked (out of total companies)
Number of companies in a Not Started state
Number of companies in an In Progress state
Number of companies in a Modified state
Number of companies in a Consolidated state
Number of in a Forwarded state
Number of companies in an Approved state
Number of companies in a Locked state
Click Hide Report to hide the Status Report.
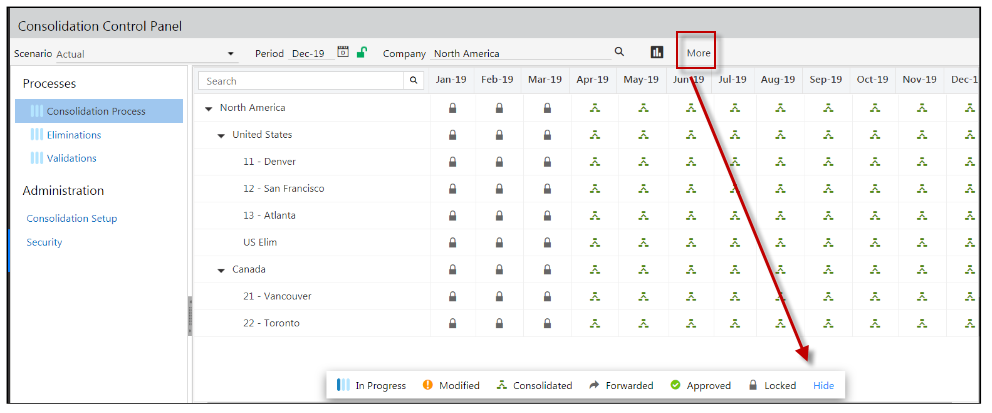
More / Status Legend
Click More to view the legend.
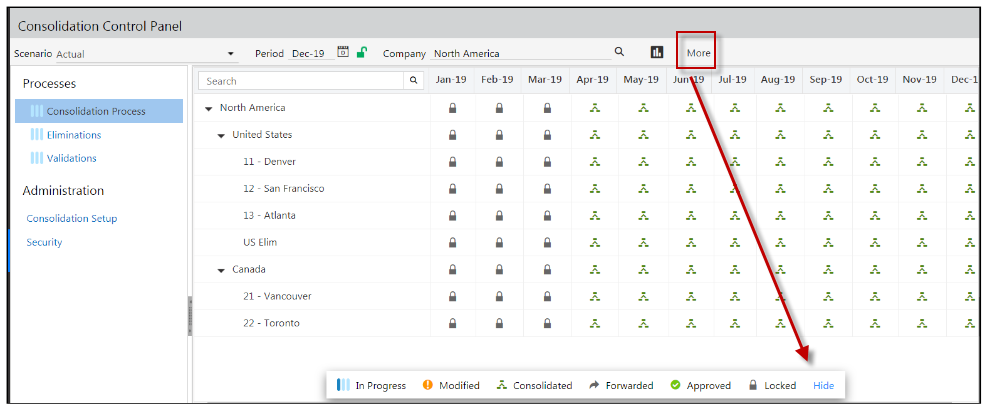
The Status legend is displayed at the bottom of the screen. Click Hide so that the legend is not displayed. Status indicators are discussed in the Understanding Workflow Status Indicators section.
Understanding the Workflow Status Indicators
Each status within the workflow is explained below.
Not Started - period end close activities have not started
In Progress - period end close activities such as loading exchange rates, loading GL data, manual input of balances using templates, journals adjustments, and so on are in progress
Modified- the consolidation unit is in a state in which it can be consolidated.
Consolidated – data has been consolidated
Forwarded - ready for approval and locking. For example, when you are ready to have your boss review and approve because the numbers look good
Approved and Locked - a company's data submission is complete and no further data entry should be done. If rejected, the consolidation unit will return to an Modified status. Only approved consolidation units can be locked. If the consolidation unit is unlocked, it will return to a Modified status.
- Note:Data entry for forwarded\approved and locked companies should not be done. While the application only restricts data entry for locked companies, this will change in a future release so that data entry is restricted for all.
The status for a parent company is affected by the status of a child member. The following table describes the status of a parent company based on the status of children in the hierarchy. For example, if a child 1, 2 and 3 are all in an In Progress state, then the Parent member will also display in the report as being in an In Progress state.
Parent/Rollup Status | Child/Leaf | ||
Child 1 | Child 2 | Child 3 | |
In Progress | In Progress | Not Started | Not Started |
In Progress | In Progress | In Progress | In Progress |
In Progress | In Progress | In Progress | Consolidated |
Consolidated | Consolidated | Consolidated | Consolidated |
Modified | Modified | Consolidated | Consolidated |
Modified | Modified | Forwarded | Consolidated |
Modified | Modified | Consolidated | Approved |
Modified | Modified | Consolidated | Locked |
Consolidated | Consolidated | Consolidated | Locked |
Consolidated | Consolidated | Approved | Approved |
Approved | Approved | Approved | Locked |
Locked | Locked | Locked | Locked |
In general:
If any one child is modified, the parent status will be modified.
All children must be locked in order for the parent status to be locked.
All children must be approved in order for the parent status to be approved.
If a child is locked, but others are not, the parent will reflect the lowest status of any one unlocked child.
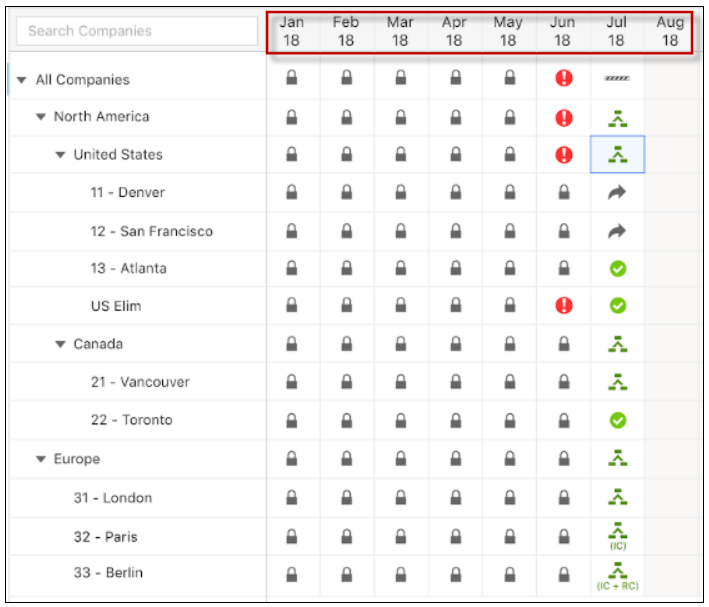
The Consolidated status may have IC, RC or IC +RC indicators.
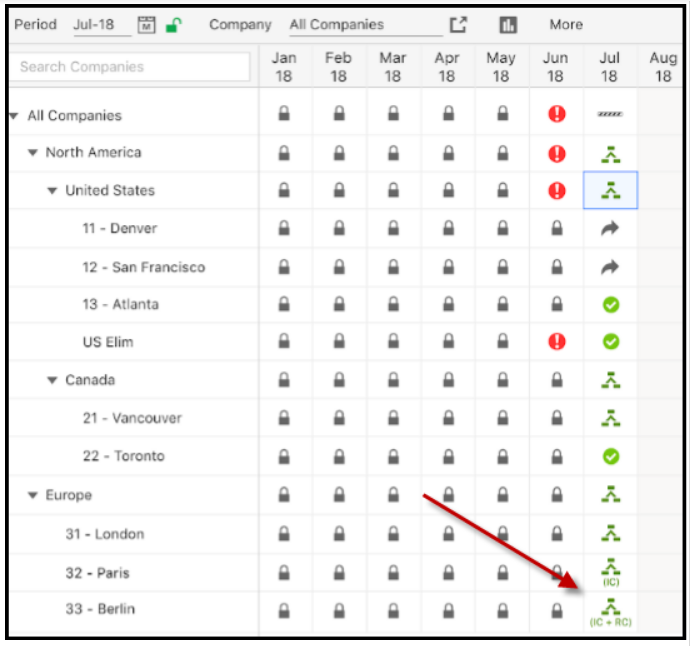
IC stands for Interim Currency and RC stands for Reporting Currency. These options are shown if ALL IC or RC are selected during the Consolidation Process. These options will not be shown if 2 out of the 3 are selected. For example, 2 ICs are selected, but the RC is not.
Legacy Functionality Versus Consolidation Status
The image below displays the legacy Consolidation Status.
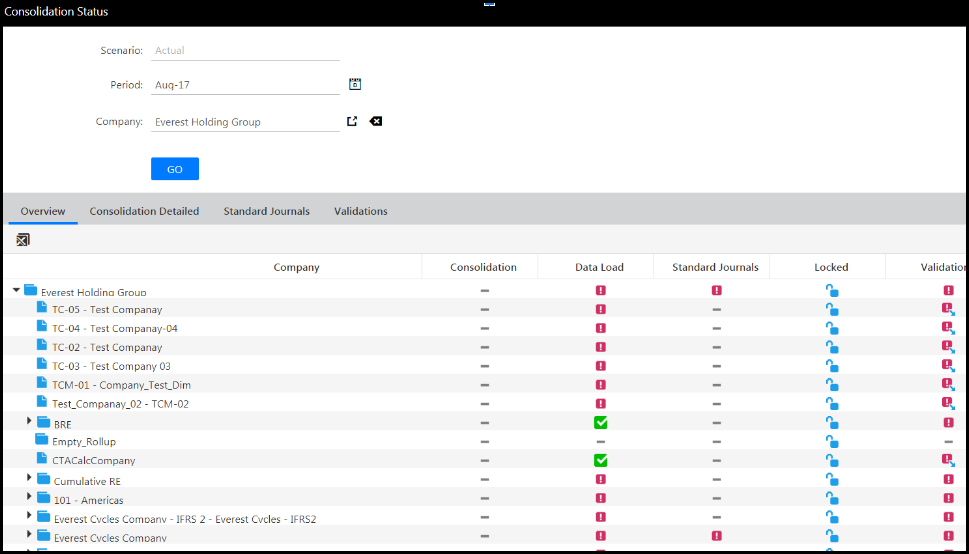
While the legacy version of Consolidation Status provided several benefits, the all Consolidation Status provides the following:
Period Information on the Report Without Having to Download It
Delivered by Default - You can enable it
Reduced Clicks to Access Consolidation Status
The sequence of events to access Consolidation Status prior to this release was to click Consolidation Status for a selected scenario/period/company (consolidation unit) from the Consolidation Control Panel, change the period and company and then click Go. Finally, click the Consolidation Detail tab or drill down from the Overview tab.
Now, there are less clicks. When you select the Consolidation Process under the Processes pane, Consolidation Status is displayed as shown below.
Improved Indicators to be In Sync with the Workflow Progression of a Consolidation Unit
The legacy indicators (shown below) were based on the following criteria: "Consolidation successful", " Not Started", and "Consolidation required". This criteria did not follow the natural progression of a consolidation unit (scenario, period, company).
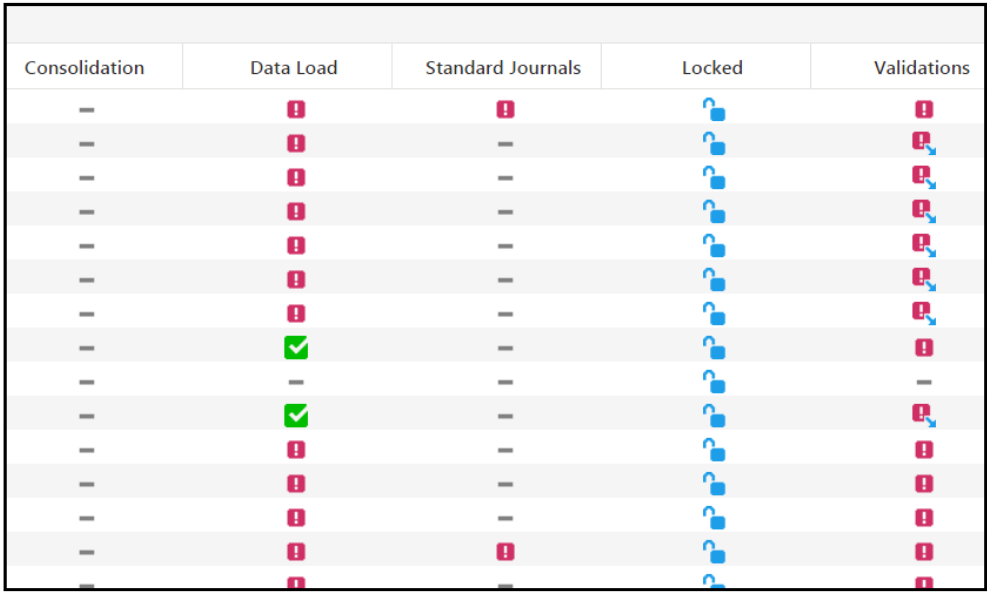
An example of the natural progression for a consolidation unit is illustrated below.
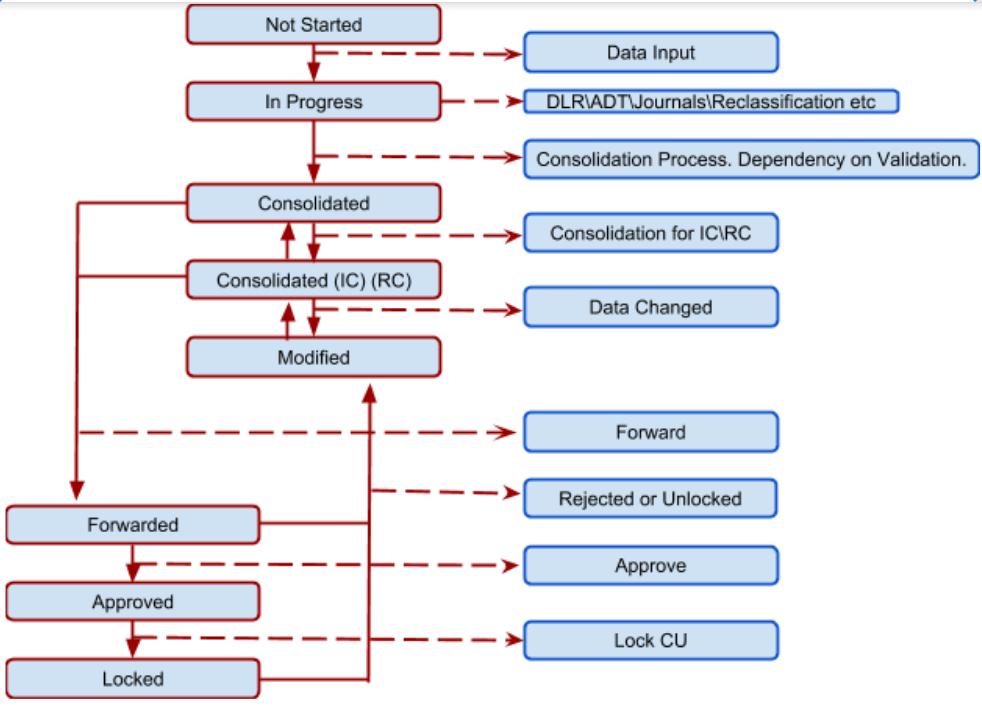
The indicators follow the natural workflow for a consolidation unit, which is “Not Started”, “In Progress”, “Modified”, “Consolidated”, “Forwarded”, “Approved” and “Locked”. Additionally, a user-friendly legend is provided.
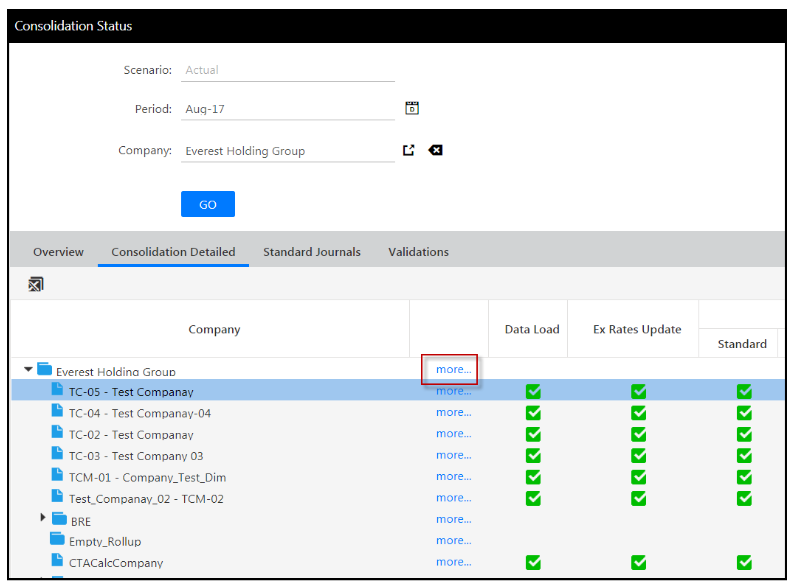
Period Information on the Report Without Having to Download It
In order to view all periods within a range, you had to download the legacy report from the Consolidation Detailed tab by clicking the more link for each member.
Now all periods within the fiscal year are shown for each member in the hierarchy.
Checks and Balances
The following checks and balances have been applied to ensure the best possible user experience:
The Lock Data screen under Maintenance > Reports will be relocated for customers who enable the Consolidation Status functionality using Consolidation Status Setup on the Configuration Task screen.
The Consolidation Status displays the entire financial year in the columns. If your Time dimension is based on a 13 period calendar, all 13 financial year periods will be displayed on the columns.
If the consolidation status of a company selected is not consolidated or approved for the last period of the previous financial year, the Consolidation Process will not process if the prior period (within or outside of the fiscal year) is not in a consolidated status or approved/locked.
When the Consolidation Process runs for a particular period in a consolidated status, if the future period is locked, you must first unlock it. And, these future periods of the financial year will be given a status of Modified in the Consolidated Status.
Use Case
A company called AMCO has several reporting sites. A reporting site represents the leaf level entities in each division. AMCO is a multinational company with legal entities all over the world. They organize entities by region and division. AMCO’s company hierarchy is shown below.
- AMCO (rollup - company main)
- +U.S. (rollup)
N.Y. (leaf reporting site)
CA (leaf reporting site)
- +EUR (rollup)
GER (leaf reporting site)
FRANCE (leaf reporting site)
SWISS (leaf reporting site)
+APAC (rollup)
- +U.S. (rollup)
During AMCO’s close process, the leaf reporting sites perform consolidation activities and then provide the results to the rollup members (in this case U.S., EUR, and APAC).
AMCO’s goal is to shorten their monthly close process and ensure accuracy. To accomplish this goal, AMCO uses Consolidation Status in the following ways.
Period referential integrity. Consolidation Status does not allow AMCO to consolidate any periods until prior periods are consolidated for all units. See the Consolidation Status Setup section.
Period locking indicators. Consolidation Status provides visual indicators to quickly confirm that prior periods are locked. See the Indicators section.
Data security. User specific workflow and access to data. Users will see data specific to their consolidation units. For example, the consolidator in GER will not see anything related to FRANCE. However, the consolidator at the rollup level (EUR) will see all data for GER, FRANCE, and SWISS providing a holistic view of where the close cycle is within the region.
Data integrity. Edits made to prior periods affect all periods from the edited period to the current period. For example, if it is April 2019 and you need to edit Feb 2019, you will be required to unlock Feb and Mar 2019. The edit made in Feb 2019 will then affect Mar 2019 and finally April 2019.
Limitations
When a company is in Forwarded\Approved state, no data entry should be possible but the system allow it today. This is a known limitation.
When a consolidation unit is in Consolidated state, any data entry operation from either Journals, Data Load Rules, Exchange Rates, and so on should change the status of the company to Modified. However, in this release only a journal adjustment updates the status to Modified. Users should reconsolidate if data has been updated for the company using other input modules. This is a known limitation and will be fixed.
Some metadata changes (such as account segment properties) should also change the status of consolidated units to Modified, but this is not implemented and is a known limitation.
Multi-select in the Consolidation Status grid is not possible. For example, selecting Jan 2019 to Feb 2019 and approving the consolidation units.
Org by Period is not honored by consolidation status.
Consolidation: Processing Dynamic Journals and Non Controlling Interest Outside or Within the Consolidation Process
Prior to this release, in order to process Dynamic Journals and Non Controlling Interest outside of the Consolidation Process, you would contact Host Support and opt-in to the feature. Host Support would then enable the feature for you as a one time setup activity.
Now, we are putting this ability into your hands. You can select (within the application) whether you want Dynamic Journals and Non Controlling Interest processed as part of or outside of the Consolidation Process using the Custom User-Defined Consolidation Process functionality.
The following topics are discussed:
What Is The Custom User-Defined Consolidation Process
The User-Defined Consolidation Process is a feature that allows you to configure and personalize your Close process. For example, you can balance books at local and common currencies during your Close process and require interim and reporting currencies get processed after Consolidation is complete. For Budget and Forecasts, you have the flexibility to run the Consolidation Process for specific financial years (period range) for a scenario versus all years.
How To Process Consolidation and Include or Exclude Dynamic Journals and Non Controlling Interest With Configurable Steps
In Practice
The steps below provide information on how to automate the processing of dynamic journals and non controlling interest.
Access the Consolidation Control Panel.
Select the Scenario, Period and Company.
Click the Consolidation Process and select the Process Action. The Process Setup page is displayed.
The Configurable Steps tab is displayed by default as shown below with the Dynamic Journals and Non Controlling Interest options.
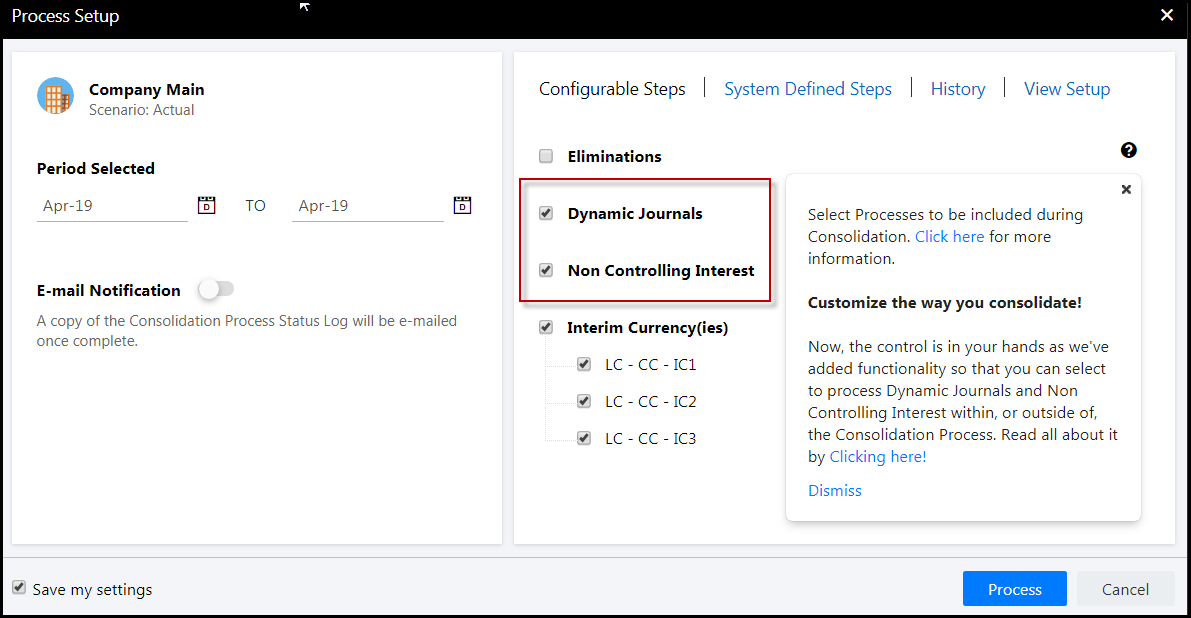
Select to include Dynamic Journals and Non Controlling Interest to be processed during the Consolidation Process. Alternatively, do not select the checkboxes should you choose to process Dynamic Journals and Non Controlling Interest outside of the Consolidation Process. Customers who had earlier opted to include Dynamic Journals and Non Controlling Interest as part of the Consolidation Process will see that both the options are selected when they navigate to the Process Setup page.
- Note:Once you select the checkbox to include Dynamic Journals to be processed during the Consolidation Process, you cannot select specific Dynamic Journal Entries to process for the period. Instead, all active Dynamic Journal Entries for the period will be processed.
Click Process. You’re done!
What Happens If I Don't Select to Process Dynamic Journals and Non Controlling Interest as Part of the Consolidation Process
The steps within the Consolidation Process associated with calculating Dynamic Journals and Non Controlling Interest in Local and Common Currency will be removed from the Consolidation Process.
Posting Dynamic Journals Outside of the Consolidation Process
Post Dynamic Journals via the Dynamic Journals screen (shown below). Select the checkbox next to the Dynamic Journal Entry and click Post or Clear Data from the Entry Actions pane.

Posting Non Controlling Interest Outside of the Consolidation Process
Post Non Controlling Interest via the Non Controlling Interest screen (shown below). Select the checkbox next to an entry and click Post or Clear Data from the Entry Actions pane.
Leverage the Start and End Period to determine which rules are active or inactive.

Clearing Dynamic Journals and Non Controlling Interest Data
Starting with the Spring19 release, when you select to process Dynamic Journals and Non Controlling Interest as part of the Consolidation Process, the Consolidation Process will not clear data for inactive artifacts (Dynamic Journals and Non Controlling Interest). This is a change from the current behavior where data is cleared for inactive artifacts.
Updated Cloud Scheduler Consolidation Task
We’ve updated the Cloud Scheduler Consolidation task so that you can select to include Dynamic Journals and Non Controlling Interest. When scheduling the Consolidation Process to run via Cloud Scheduler, select to automate the processing of Dynamic Journals and Non Controlling Interest. To do so, after selecting the Consolidation task, click the Configurable Steps link and select the checkboxes for Dynamic Journals and Non Controlling Interest.
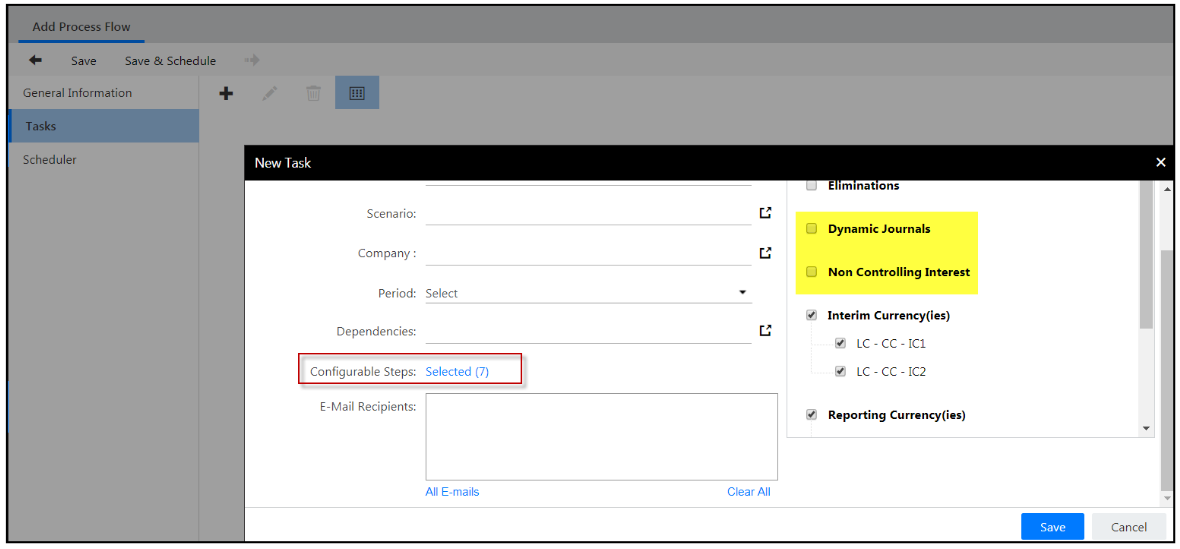
Modeling 2.9: User Experience and Secondary-Click Menu
In this release, Modeling has an updated user interface in the Spotlight for Office modules with fresh icons and a simplified menu layout. Before and after screenshots are shown below.
We also added a secondary-click menu. For right-handed users, this is a right-click menu. For left-handed users, this is a left-click menu.
User Information Consolidated to the Info Menu
Spotlight for Office Menu Ribbons - Before and After
Secondary-Click Menu
In SpotlightXL, when using or designing views, you can use a right-click (for right-handed users) or left-click (for left-handed users) on your mouse to see a popup SpotlightXL menu. Using this menu, you can quickly lay out and place dimensions and data cells where you want them.
In a View, select a dimension member cell and press the secondary mouse button. The normal Excel popup menu appears, and you see a new SpotlightXL item at the top of the menu. It expands to show a submenu with the following commands:
Zoom In
Zoom Out
Keep Only
Remove Only
Pivot
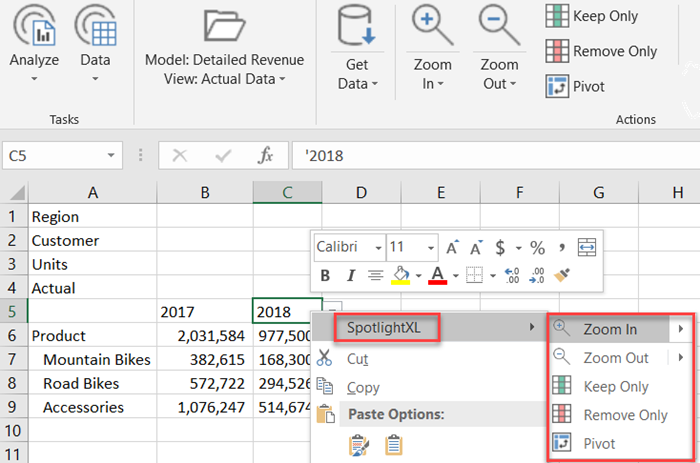
Zoom In and Zoom Out expand further to show the same submenu items as are on the main menu ribbon.
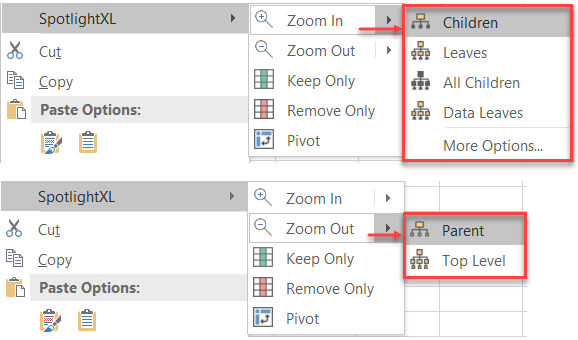
User Information Consolidated to the Info Menu
All user information including role and group assignments, the application in use, and the product version are displayed in the consolidated Info menu item.
Analyze and Report Screens
Here is an example of the Analyze screen.
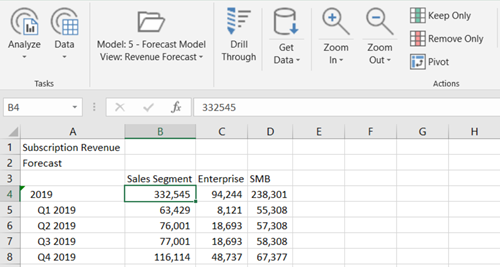
Here is an example of the Report screen.
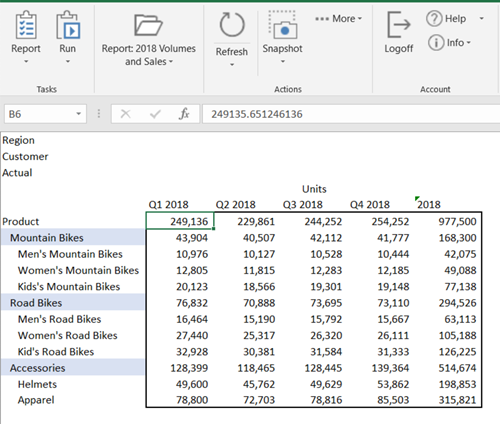
Task Menu
Here is the look of the updated icons on the Task menu in SpotlightXL.
Spotlight for Office Menu Ribbons - Before and After
Before: Analyze, Data

After: Analyze, Data

Before: Analyze, Design

After: Analyze, Design

Before: Report, Run

After: Report, Run

Before: Report, Design

After: Report, Design

Before: Model, Setup

After: Model, Setup

Before: Excel Report
After: Excel Report

Before: Manage
After: Manage
Before: Spotlight Word

After: Spotlight Word

Before: Spotlight PowerPoint
After: Spotlight PowerPoint

Modeling 2.9: Ability to Set the Value of a Substitution Variable Added to Spotlight for Office PowerPoint
In this release, we are making it possible for users to change the value of substitution variables while running a PowerPoint Report. You can set up the substitution variables and expressions in an Excel Report and then convert to a PowerPoint Report using Copy Formulas from Excel and Paste Formulas from PowerPoint.
A Substitution Variable menu item has been added to the SpotlightPPT menu ribbon in PowerPoint to make it possible for users to change the value of the variable while using the report.
The process is the same as for formatted reports.
In Practice
Admin or designer creates one or more substitution variables in the model.
Admin or designer creates one or more Excel Reports and inserts the substitution variables. See Using Substitution Variables and Expressions with Excel Reports for steps to do this.
Admin or designer optionally specifies substitution variable expressions in the design of the report. See Using Substitution Variables with Expressions.
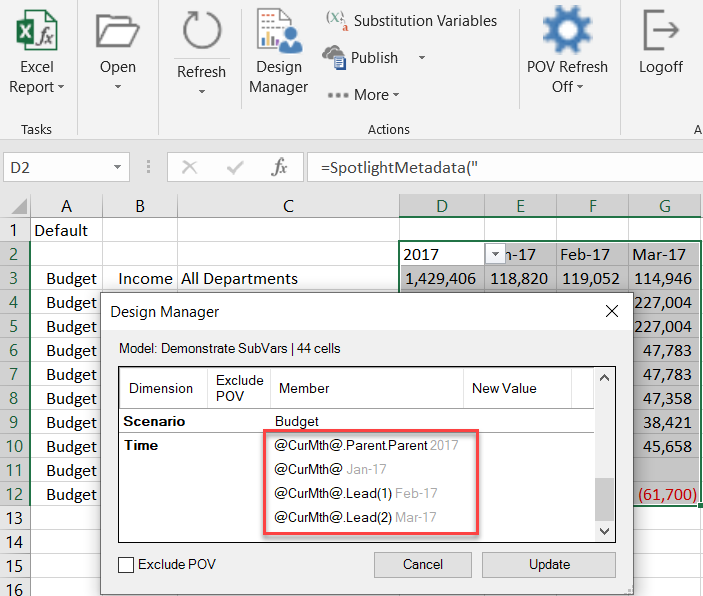
Admin or Designer copies the Excel Reports formulas to Spotlight PowerPoint. Here's how:
In the Excel Report, select all the cells that you want copied into PowerPoint.
Select More menu, Copy Formulas.
Open PowerPoint and display the slide where the report will appear.
Select the SpotlightPPT menu.
Click Paste Formulas.
Click Refresh. The data is retrieved and the menu expands to provide additional options, including the Substitution Variables button.
With the cursor anywhere in the slide, click Substitution Variables. The Substitution Variables box appears. It shows the name of the variable and the current value. In this case, there is only one variable in use, @CurMth@, because the other months and the year are derived from expressions.
Click the Member Select icon.
From the Member Selection box, select the month that you want to see in the report.
Click Select.
Click Refresh to refresh the report. The report now displays data for Jul-17.
Using substitution variables, the user can easily move back and forth between months, quarters, or years, without updating the definition of the report and without the need for the designer or administrator to update the substitution variable value permanently.
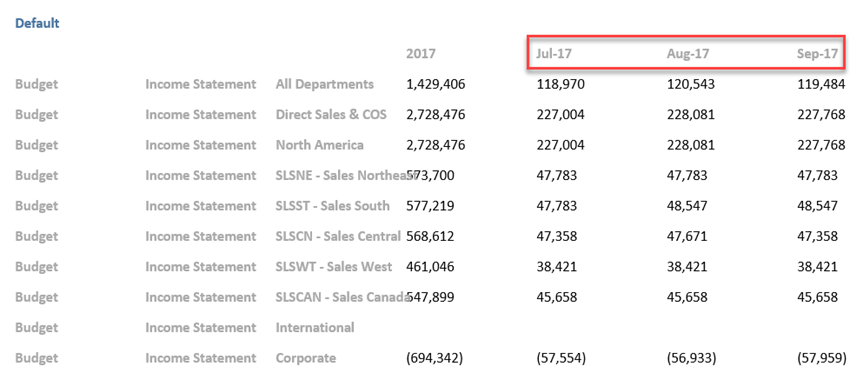
Modeling 2.9: Improvements to Zoom In and Zoom Out in Views
In this release, we have expanded the options for Zoom In and Zoom Out to give you maximum flexibility in laying out your views in SpotlightXL. These features are available only in Excel and only when running or designing a View. These features are not available from the Web interface.
Zoom In options are renamed. Next Level to Children, Leaf Level to Leaves, All levels to All Children, Data Leaf Levels to Data Leaves.
Ability to Zoom In to Children, Leaves, and All Children
Ability to Retain or Not Retain the Parent with Zoom In
Ability to Move the Dimension Parent to the Bottom of the View
Ability to Zoom Out to Parent or Top Level
Ability to Zoom In to Children, Leaves, and All Children
When navigating data within Views, Zooming In lets you view additional detail for the parent member selected.
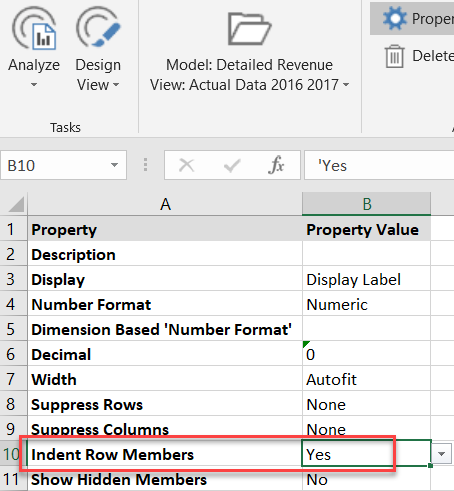
The menu options have been renamed as follows:
Next Level renamed to Children
Leaf Level renamed to Leaves
All Levels renamed to All Children
Data Leaf Levels renamed to Data Leaves.
Zooming In one level to Children is the default.
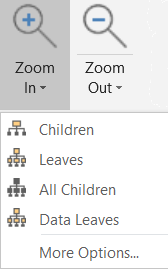
Additionally, if you want to Zoom In and specify how and where to place the parent members, click More Options. From the Zoom Options box, you can combine options to lay out the view precisely.
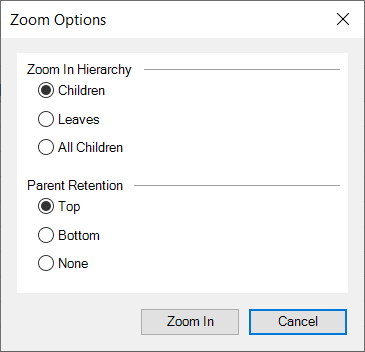
Ability to Retain or Not Retain the Parent with Zoom In
Zoom In now offers the ability to keep the parent members as part of the view or remove the parent members from the view.
Under Zoom In, More Options, the second section lets you remove the parent members with None.
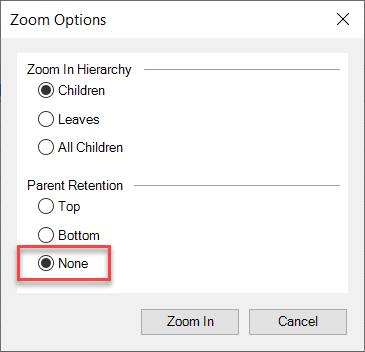
Ability to Move the Dimension Parent to the Bottom of the View
Zoom In now offers the ability to keep the parent members above their children, or move the parent members below the children. Placing parent members below the children offers the ability to have subtotals and totals below the details in your views and subsequent reports.
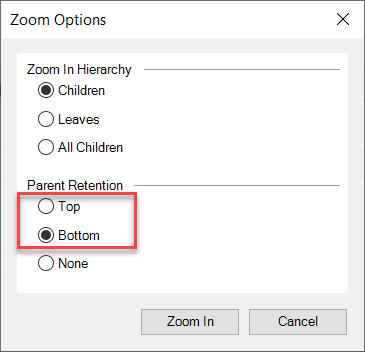
Ability to Zoom Out to Parent or Top Level
When you Zoom Out from a member, you now have the option to zoom out to the Parent, or go all the way back to the Top Level (the top or root of the dimension, or the topmost member in the dimension that you have access to).
The default behavior is to zoom out to the parent of the selected member. However, to zoom all the way out to the highest level of the dimension quickly, select Top Level.
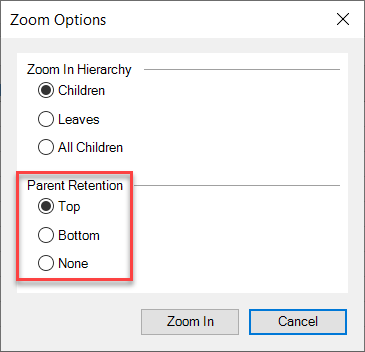
Modeling 2.9: Deprecated Menu Items in SpotlightXL
In this release, we are removing two items from the Analyze menu. When Modeling was in its very early releases, and there was no Model menu in SpotlightXL, designers used these menu items for designing models and formulas. But they have been replaced with greater functionality on the Model menu over time.
Design Model and Design Formula as found on the Analyze, Data submenu are removed from the user interface in this release.
To design a model, use the Model menu, Setup, Dimension, and Attributes menu items.
To design a formula, use the Model menu, Formula menu item.
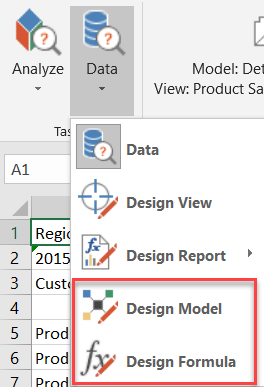
Modeling 2.9: Excel Reports are Renamed to Excel Reports
In this release, the Excel Reports feature is renamed to Excel Reports. Because Modeling now supports creating reports with a live data connection to data in a model from Excel, Word, and PowerPoint, the terminology is simplified to Excel Report, Word Report, and PowerPoint Report. The live connection is supported through the use of Spotlight formulas.

Similarly, there is support for publishing and downloading reports with Spotlight formulas from Word and PowerPoint, as described in the next section. This functionality was previously available only with Excel. This support requires that an administrator set up a template for each report to be published. The name of the menu item for creating a template is renamed from Excel Report to Office Reports.
Modeling 2.9: Publish and Download Options Added to Spotlight for Office
In previous releases, we supported publishing an Excel Report to the cloud so that end users could download and use it. In this release, we are extended that support to Word Reports and PowerPoint Reports.
The process for publishing a report is the same as for Excel Reports.
Create a template.
Publish the Report.
For general information on creating templates, publishing, and downloading reports, see Publishing Reports.
In Practice: Create a Template
Administrator access is required to do this step. Publishing reports to the Modeling cloud is intended to be used for your organization’s standard monthly reports, such as those in a board book. A general guideline is to use it for fewer than 10 standard reports, although we support up to 50 reports per application, of no more than 16MB each.
Select Manage task and the Office Reports, Setup subtask. Here, you can create a template that acts as a placeholder for each report that will be published and made accessible to users. One template can be used for either an Excel Report, Word Report, or PowerPoint Report. Each template reserves a spot for just one report in the Modeling cloud.
Enter the report name.
Enter the report description.
Click Save.
In the Group field, specify user groups that should have access to this report.
For Access, specify whether user groups should be able to publish or download the report.
Click Save.
In Practice: Publish the Report
After the administrator has created a template for the report, a user with Publish privilege can upload the report.
Open the workbook, document, or deck containing the report with Spotlight formulas, such as the following Sales Revenue Budget workbook.
Click Publish. The Select Report to Publish box appears and you see the report template that was created by the administrator.
Select the report to publish (in this case, click Annual Sales Revenue Budget) and click Publish.
 Note:Before the report is uploaded, the Modeling data is cleared from the file. When the report is later downloaded, the user will see all metadata and data cells as #REFRESH. When the user clicks refresh, only those members and data cells they have access to will appear.
You will receive a message indicating that the report has been published. Click OK.
- For additional information, including how to update a published report, see Modeling: Publishing and Opening Excel Reports, Word Reports, and PowerPoint Reports.
Modeling 2.9: Direct Access to PCR: Support for Cube Default Members for System-Defined Dimensions in Formatted Reports and Excel Reports
In February 2019, Modeling added support for PCR Default Members in views. In this release, Modeling now honors PCR Default Members for the four system dimensions (Time, Scenario, Reporting, and Measures) in formatted reports and Excel Reports. For example, 2019 can be defined as the default member in a Time dimension. This feature simply makes it faster to see the dimension members that you are most interested in seeing in your reports.
This support applies when reporting on models with Direct Access to PCR. It does not apply to Master models with traditional integration with PCR. To learn about converting a model with traditional integration to a Direct Access model, see Modeling: Converting a Master Model into a Direct Access to PCR Model.
In Reports, this support applies to both Spotlight and SpotlightXL.
In Excel Reports, this support applies only to SpotlightXL.
In Practice: Creating Default Members
Login to PCR.
Select Maintenance, Reports, Cube Settings, Default Members.
Ensure that the Reporting Area is set to Financial.
For each dimension, select a default member to be displayed in your reports in PCR and new views in Modeling.
Although you may have a default member selected for every dimension, only the four system dimensions are honored in Modeling.
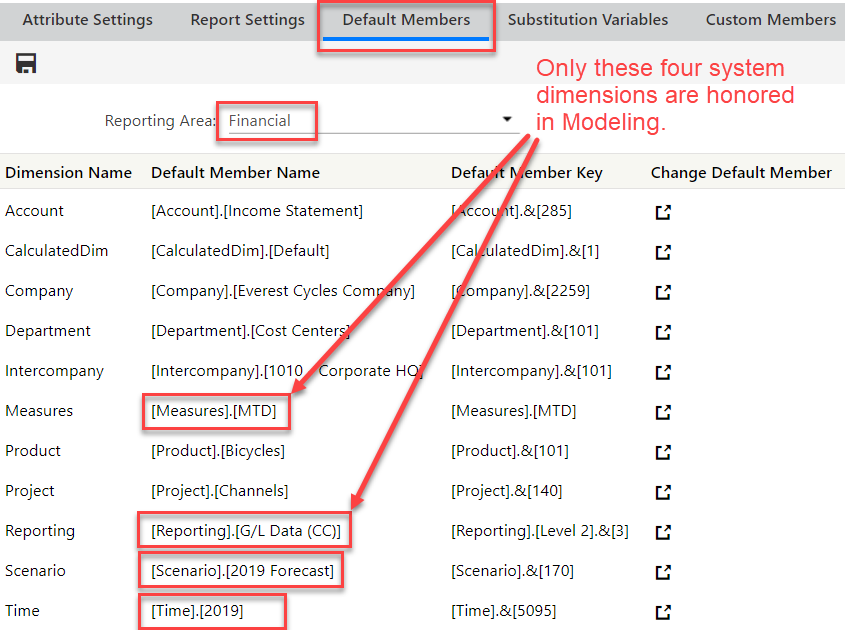
In Practice: Using Default Members in a Report
When creating a formatted report, typically you begin with a view and then convert the view to a report. In this case, all of the dimensions and members are already selected in the view before it is converted into a report. However, built into the Report designer now is the ability to see the default members when you create a new cell, as described below.
Login to SpotlightXL.
Select Analyze Data, and then select a model that has Direct Access to PCR.
Lay out the view as you wish and save it.
Select the Data menu, Design With, Report.
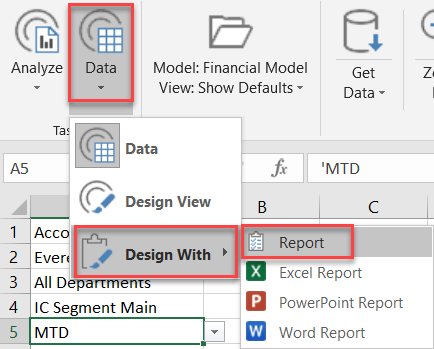
This opens the HostReport tab and displays the view with comments on each Spotlight cell.
Put your cursor on any blank cell and then click Design Manager. Notice that the four system dimensions have their default member selected by default for a Data cell.
If you select Member, and then select one of the system dimensions on the row or column axis, again you see the default member automatically selected. You can use the member select icon to pick any other member of the dimension that you have access to. In the following example, Scenario is on the column axis and 2019 Forecast is selected by default.
Similarly, if you select POV, and then select one of the system dimensions, you see the default member automatically selected. You can use the member select icon to pick any other member of the dimension that you have access to. In the following example, Reporting is a POV dimension and G/L Data (CC) is selected by default.
- In Practice: Using Default Members in an Excel Report
When creating an Excel Report, typically you begin with a view and then convert the view to an Excel Report. In this case, all of the dimensions and members are already selected in the view before it is converted into the report. However, built into the Excel Report designer now is the ability to see the default members when you create a new cell, as described below.
Login to SpotlightXL.
Select Analyze Data, and then select a model that has Direct Access to PCR.
Lay out the view as you wish and save it.
Select the Data menu, Design With, Excel Report.
The view is converted to Spotlight formulas, and a new tab appears, named by the view, which displays the Excel Report with #REFRESH on each data cell.
Click Refresh to update the data.
Put your cursor on any blank cell and then click Design Manager. Notice that the four system dimensions have their default member selected by default for a Data cell.
If you select Member, and then select one of the system dimensions on the row or column axis, again you see the default member automatically selected. You can use the member select icon to pick any other member of the dimension that you have access to. In the following example, Time is on the row axis and 2019 is selected by default.
Similarly, if you select POV, and then select one of the system dimensions, you see the default member automatically selected. You can use the member select icon to pick any other member of the dimension that you have access to. In the following example, Reporting is a POV dimension and G/L Data (CC) is selected by default.
Dimension Member Visibility
Note that default members do not limit visibility to the rest of the dimension. If you click on the dimension member, the rest of the dimension is still accessible.
Limitations
This support is only for models with Direct Access to PCR.
This support only applies to creating a new cell in a formatted report or an Excel Report.
This support applies only to the four system dimensions: Measures, Reporting, Scenario, and Time.
Modeling 2.9: External Source Model Formulas: Support for Looking Up a Numeric Value with the RangeLookup Function
In this release, you have the option to use an additional formula when defining External Source Models: RangeLookup. This formula looks up a number within a range of numbers and returns a value.
For a complete reference on the ESM formulas and functions available, see External Source Model Field Types, Expressions, and Formulas.
Syntax
RANGELOOKUP("ESM ModelName", "ReturnFieldName", "LowRangeFieldName", "HighRangeFieldName", {KeyFieldName1}, ..., {KeyFieldNameN}, {KeyLookupField})
or
RANGELOOKUP("ESM ModelName", "ReturnFieldName", "LowRangeFieldName", "HighRangeFieldName", {KeyFieldName1}, ..., {KeyFieldNameN}, {KeyLookupField}, Decimal_Precision)This function returns the value of ReturnFieldName in ESM ModelName that corresponds to the row in ESM ModelName where the Key Fields match and where the value of KeyLookupField fits into the range of values between LowRangeFieldName and HighRangeFieldName.
The Key Field Names are KeyFieldName1, KeyFieldName2, ..., KeyFieldNameN. You must have at least one Key Field Name. The Key Field Name(s) must exist in ESM ModelName and in the model that contains the RANGELOOKUP function. These key field names must be enclosed with curly braces { }. You can use an unlimited number of Key Fields, but a best practice is to use fewer than 10.
KeyLookupField is a field of type Numeric or Formula (that resolves to a number). It contains the value that you want to look up in the range of values between LowRangeFieldName and HighRangeFieldName.
LowRangeFieldName and HighRangeFieldName must be of type Numeric or Formula (that resolves to a number) in ESM ModelName.
LowRangeFieldName uses >= (greater than or equal to) when comparing to KeyLookupField.
HighRangeFieldName uses < (less than) when comparing to KeyLookupField.
Ranges should be continuous so they do not leave gaps: 0-5, 5-10, 10-15, and so on.
If the value of KeyLookupField is below the value of LowRangeFieldName, 0 is returned.
If the value of KeyLookupField is equal to or above the value of HighRangeFieldName, the value of [ReturnFieldName] in the row with the highest range value is returned.
If the value of KeyLookupField does not fit in any range, 0 is returned. This implies that the ranges are not continuous, and the KeyLookupField value falls in a gap between ranges.
If the value of KeyLookupField is valid in more than one set of ranges (rows) in ESM ModelName, the value of [ReturnFieldName] in the row with the highest range value is returned.
Decimal_Precision is optional. It indicates to what decimal place numbers should be compared. In other words, how far out to the right should the KeyLookupField be compared to the low range and high range. For example, if Decimal_Precision is 6, KeyLookupField is 0.12345 and the low range is 0.12 and the high range is 0.123456, then KeyLookupField is found in the range. If not provided, the default is 4. Valid values for Decimal_Precisionare integers 0-9.
HighRangeFieldName has a maximum value of 922 trillion, if using 4 decimal places.
Lowering the number of decimal places from the default of 4 increases the maximum of HighRangeFieldName by a factor of 10 for each decimal place.
Increasing the number of decimal places from the default of 4 reduces the maximum of HighRangeFieldName by a factor of 10 for each decimal place.
As a best practice, using decimal precision greater than 4 is recommended only when the range values are small numbers.
To look up text instead of a number, see LOOKUP under Text Functions.
Example: Using the RANGELOOKUP Function
The RANGELOOKUP function allows two ESM models to communicate with each other. There must be one or more matching fields in both models, called the Key Fields.
In the following example, Company and Region are the Key Fields. Models Commission Ranges and Commissions Looked Up will interact. Model Commission Ranges contains the information that model Commissions Looked Up will look up.
Here is the list of fields in model Commission Ranges.
Here is the data for model Commission Ranges.
Model Commissions Looked Up will look up data in model Commission Ranges based on the common key fields, Company and Region.
Here is the list of fields in model Commissions Looked Up.
To calculate the RANGELOOKUP function, you need to load data into the first four fields. The formula fields are derived. Copy and paste the raw data into columns A-D, then click Load Data.
Click Refresh and then you will see the remaining columns calculated and filled in.
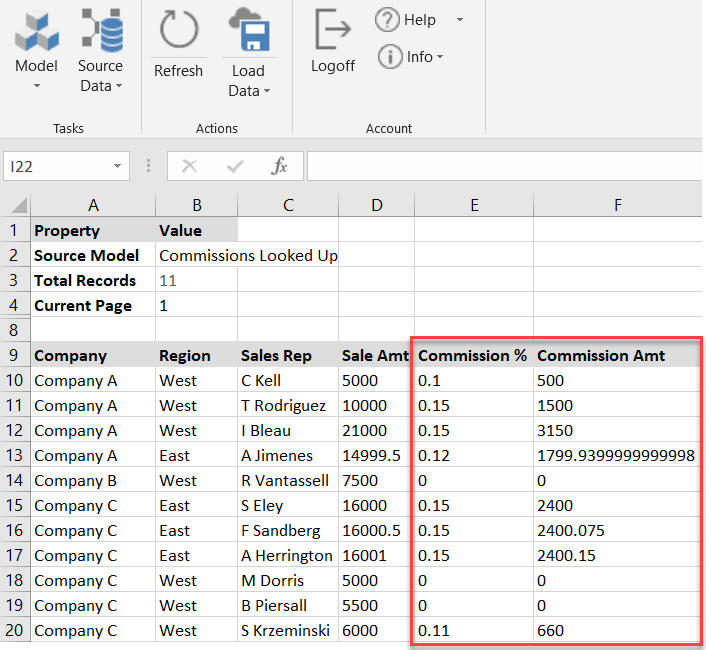
Explanation
Reminder: here is the syntax for the RANGELOOKUP function:
RANGELOOKUP("ESM ModelName", "ReturnFieldName", "LowRangeFieldName", "HighRangeFieldName", {KeyFieldName1}, ..., {KeyFieldNameN}, {KeyLookupField})Model Commissions Looked Up has six fields:
The first two fields are text fields that serve as the Key Fields: Company and Region.
The third field is a text field that is informational: Sales Rep.
The fourth field is a numeric field that serves as the Key Lookup Field: Sale Amount. This is the number that is used to look in the ranges of numbers in the model Commission Ranges.
The fifth field is Commission % and contains the following formula:
RANGELOOKUP("Commission Ranges","Comm%", "Sales Amt Low", "Sales Amt High", {Company}, {Region}, {Sale Amt})Commission % is derived by matching the Key Fields Company and Region (from row 1 in Commissions Looked Up, "Company A" and "West"), to the fields of the same name in model Commission Ranges. In Commission Ranges, "Company A" and "West" are found in row 1.
Next, the value of Sale Amt is matched to the range of values between Sales Amt Low and Sales Amt High in row 1 of Commission Ranges. If Sale Amt >= Sales Amt Low, and if Sale Amt < Sales Amt High, the range is a match. Since the Sale Amt was 5000 and the Low and High Ranges were 0 to 10,000, then the range is row 1 is a match.
Next, the value in the field Comm% from the row where the range matches in Commission Ranges is returned and placed into the Commission % field in Commissions Looked Up. The value of Comm % is 0.1 and this is returned to Commissions Looked Up and placed into the field Commission %.
The sixth field is Commission Amt and it is a formula of Commission % * Sale Amt. This formula takes place within the Commissions Looked Up model and results in 500. To further refine this formula, a rounding function could be added to it: ROUND([Sale Amt]*[Commission %], 2)
The rows of data in Commissions Looked Up demonstrate the rules for the ranges:
Commissions Looked Up |
| Commission Ranges |
|
| ||||
Company | Region | Sale Amt |
| Sales Amt Low | Sales Amt High | Returns this Comm% Value | Evaluation | Notes |
Company A | West | 5000 | matches to | 0 | 10000 | 0.1 | 0 <= 5000 < 10000 | The range fits and the Comm% value is returned. |
Company A | West | 10000 | does not match | 0 | 10000 |
| 0 <= 10000 but is not < 10000 |
|
|
|
| matches to | 10000 | 20000 | 0.15 | 10000 <= 10000 < 20000 | The range fits and the Comm% value is returned. |
Company A | West | 21000 | is higher than | 10000 | 20000 | 0.15 | 10000 <= 21000 but is not < 20000 | The lookup is higher than the range, and the Comm% is returned. |
Company A | East | 14999.5 | matches to | 0 | 15000 | 0.12 | 10000 <= 14999.5 < 15000 | The range fits and the Comm% value is returned. |
Company B | West | 7500 | is lower than | 10000 | 20000 | 0 | 7500 < 10000 | The lookup is below the range, so 0 is returned. |
Company C | East | 16000 | matches to | 0 | 16001 |
| 0 <= 16000 < 16001 |
|
|
|
| also matches to | 16000 | 21000 | 0.15 | 16000 <= 16000 < 21000 | The lookup fits in two ranges, so the highest range Comm% is returned. |
Company C | East | 16000.5 | matches to | 0 | 16001 |
| 0 >= 16000.5 < 16001 |
|
|
|
| also matches to | 16000 | 21000 | 0.15 | 16000 >= 16000.5 < 21000 | The lookup fits in two ranges, so the highest range Comm% is returned. |
Company C | East | 16001 | does not match | 0 | 16001 |
| 0 >= 16001 but is not < 16001 |
|
|
|
| matches to | 16000 | 21000 | 0.15 | 16000 >= 16001 < 22000 | The range fits and the Comm% value is returned. |
Company C | West | 5000 | does not match | 0 | 5000 |
| 0 >= 5000 but is not < 5000 |
|
|
|
| is lower than | 6000 | 10000 | 0 | 5000 < 6000 | The lookup is between the two ranges provided, so 0 is returned. |
Company C | West | 5500 | is higher than | 0 | 5000 |
| 0 >= 5500 but is not < 5000 |
|
|
|
| is lower than | 6000 | 10000 | 0 | 5500 < 6000 | The lookup is between the two ranges provided, so 0 is returned. |
Company C | West | 6000 | does not match | 0 | 5000 |
| 0 <= 6000 but is not < 5000 |
|
|
|
| matches to | 6000 | 10000 | 0.11 | 6000 <= 6000 < 10000 | The range fits and the Comm% value is returned. |
Modeling 2.9: External Source Model Formulas: Support for Date Arithmetic and the SUM Function
In this release, you have the option to use date arithmetic and a SUM function for calculating dates in External Source Models.
For basic information on External Source Model formulas, see External Source Model Field Types, Expressions, and Formulas.
Date formulas now support the basic arithmetic operators: + -
Plus you can use the SUM function.
SUM([datefield], n), returns the date that is indicated by the number of days, n, added to the datefield. To add to the datefield, n should be a positive number. To subtract from the datefield, n should be a negative number.
Example: Using Date Arithmetic Functions
The following External Source Model uses five input fields and three formulas.
Five fields are inputted:
Name
Work Start Date
Duration in Days
Bid Amount
Status
The other three fields are calculated:
RFP Start Date uses date arithmetic to subtract 30 days from the Work Start Date. This date provides a timeframe for the Request for Proposal to be written.
Midpoint Date uses date arithmetic to calculate the midpoint date of the project. It uses the input field Duration in Days, divides it in half, and adds that number to the Work Start Date.
Projected End Date uses the SUM function to demonstrate how to add the input field Duration in Days to the input field Work Start Date.
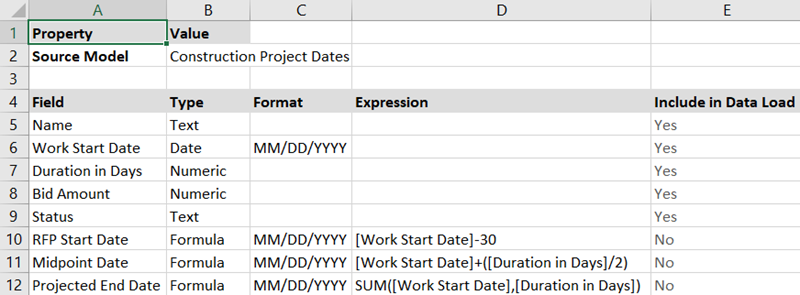
The external data source contains the following fields.

After loading this data into the External Source Model, the three formula fields are calculated. You can see that Projected End Date is the Work Start Date plus the Duration. The Midpoint Date is halfway between the Work Start Date and the Projected End Date. The RFP Start Date is 30 days before the Work Start Date.

Modeling 2.9: Administration: Consolidated Settings for Model Keys and Model Value Block Size in Application Settings
In this release, we are simplifying the Application Settings and changing some defaults. These changes aim to make your models more balanced and to avoid exploding model sizes which will increase calculation and reporting times. These settings are available only for Admin users.
Application Settings are found on the Manage menu, Application Administration sub-menu.
Settings for Dynamic Models are removed. They were used only in the case where a user selected Design Model from a view. That menu item is also removed from Modeling in this release.
Master and Analytical model settings are now combined. There was no difference between settings for master and analytic model settings previously, other than their default values, so they have been combined.
Master Model keys and Analytical Model keys are combined into Model keys.
By default, Model keys is 1,000,000 combinations of key dimension members.
If you had previous settings for Master Model keys and Analytical Model keys, your new value for Model keys will be the higher of the two keys settings that you had.
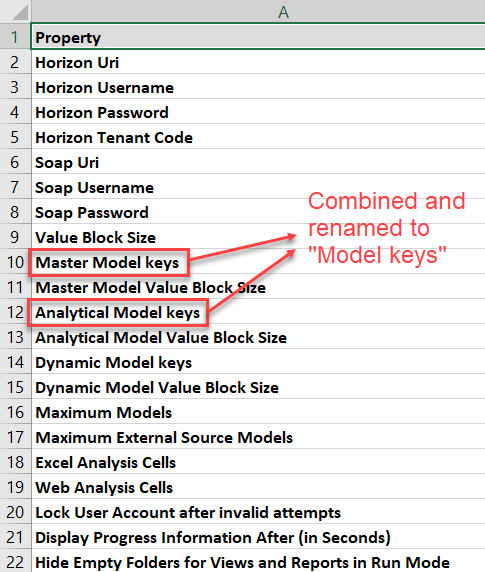
Master Model Value Block Size and Analytical Model Value Block Size are combined into Model Value Block Size.
Model Value Block Size is 20,000 combinations of value dimension members per block by default. It has a maximum value of 1,000,000.
If you had previous settings for Master Value Block Size and Analytical Value Block Size, your new value for Model Value Block Size will be the higher of the two keys settings that you had, but not more than 1,000,000.
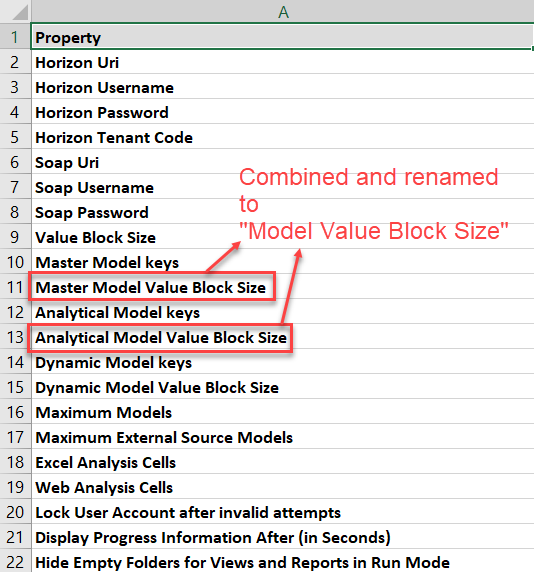
Value Block Size is removed because it was obsolete.
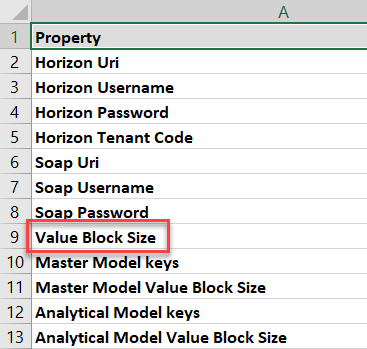
- Maximum Models and Maximum External Source Models are now read-only settings. To modify these settings, you must submit a Host Analytics Support case. The default value and recommended maximum for both is 20.
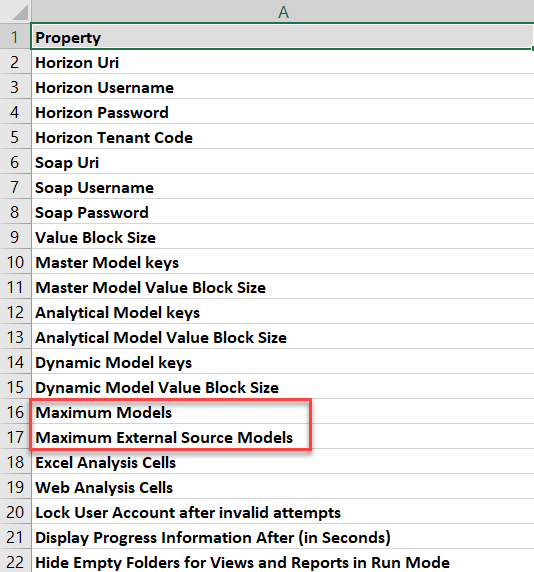
The Application Settings page is shown below.
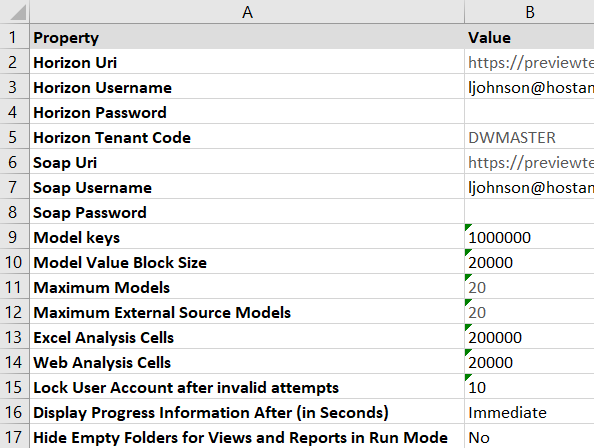
Platform: NetSuite Connect RESTlet
NetSuite Connect now uses RESTlet mode and supports the loading of data from formula fields, multi-select,
multi-joins, summary fields and unsupported transaction types of Web Services. In addition, a Saved
Search can now be Public, Private or Shared.
For detailed information, access the Data Integration Admin Guide and locate the NetSuite Integration topic.
Auto-Load Missing Segment Members (Available for Customers New to Host as of this Release)
This feature eliminates data load failures due to missing segment members. Missing segments represent those that are not in Host Analytics but exist in the data load. For example, during a web service file load, if Host Analytics encounters segment members that are not in the system, the load will fail. However, with this feature enabled, the missing segment members will be loaded automatically.
This feature works for GL Data Load types only and all forms of data loads (for example, web services and file loads) except for copy/paste. Auto addition of missing segment members works for all segments except the Legal entity segment.
When missing segment members are loaded into the segment, those members are created under the rollup name DI-AutoCreated-Members.
In the image below, 3 members (leaf minus, leaf plus, and plus) were created for the Account dimension hierarchy under the DI-AutoCreated-Members rollup.
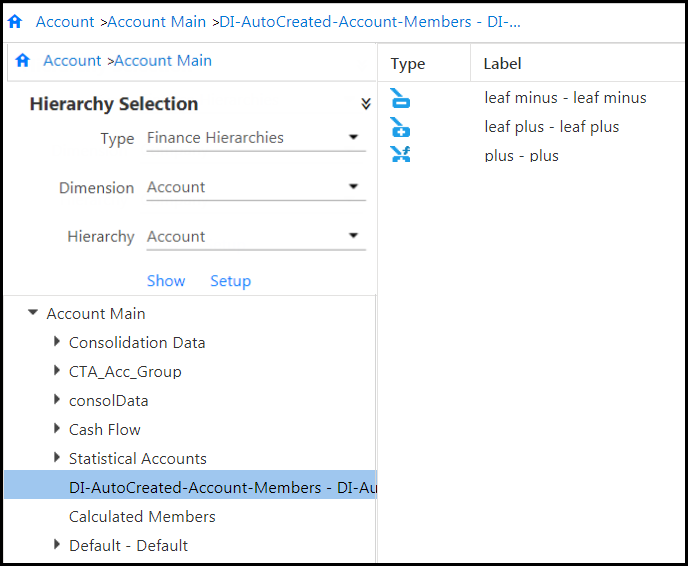
While loading the missing segment members, the system verifies whether the corresponding segment hierarchy roll-up contains more than 25, if it does the load will fail. To ensure that this does not occur, you should regularly move the members from the DI-AutoCreated-Members rollup to another rollup.
Platform: Ability to Copy Data Structure When Copying a Data Load Rule
A Data Load Rule (DLR) tells the Host Analytics system how to handle data values in the data source during a data load. Instead of creating a completely new DLR, you can use the Copy functionality to make a duplicate of a selected DLR.
Prior to this release, when you made a copy of a DLR, only the following settings were copied from the source to the target:
General settings (Name, description, etc.)
Sample input file format information
Overall rule settings
Now, all metadata (the structure of the DLR) is copied. Metadata includes things like data mappings and the manipulations done to an input file. In the image below, the Define Data Mappings page is shown. The Data Load Rule is a “copy of” the Spring19 Data Load Rule. The data mappings were copied from the source Data Load Rule named Spring19 to the target (copied) Data Load Rule automatically named Copy of Spring19.

In the image below, the Manipulate Input File page is shown. The Data Load Rule is named “copy of” Spring19 as it is a copy of the Spring19 Data Load Rule. The manipulations were copied from the source Data Load Rule to the target.
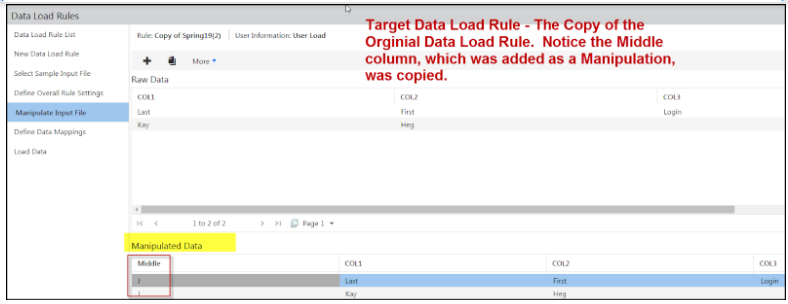
Here is the original/source Data Load Rule.
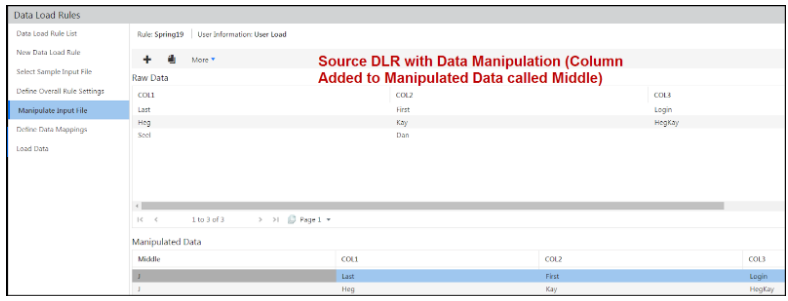
In Practice:
Follow the steps below to copy a DLR (which now includes all associated metadata):
Navigate to Maintenance > DLR > Data Load Rules. The Data Load Rule List page is displayed.
Select the DLR you want to copy.
Click the Copy button.

When the Copy Dataload screen appears, enter a name for the duplicate DLR.
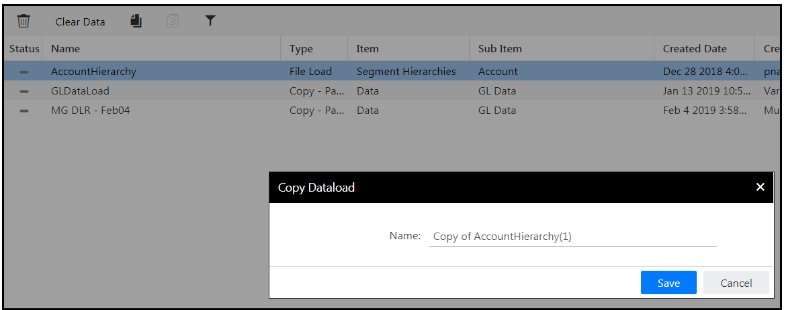
Click Save. Once the copy is complete, the system will inform you and the DLR List is automatically updated to include the new rule.
- See Also: For detailed information on Data Load Rules, see the Admin Guide to Loading Data.
Platform: Ability to Change NetSuite Connect Type of Data Load Rule
In the Winter19 release, we released the ability to change any type of existing Data Load Rule (File Load/Copy Paste/Web Services) to a NetSuite Connect type. Now we are releasing the ability to change a NetSuite Connect Data Load Rule type to a File Load, Copy Paste, or Web Services type. This is beneficial because instead of re-creating the entire DLR (Data Load Rule), you can simply edit it and change the Load Type. This flexibility saves time and ensures consistency in loading data when the same DLR is used.
In Practice
Access the Data Load Rules pages by navigating to Maintenance > DLR > Data Load Rules.
Check the Usage Report of the NetSuite Connect DLR to find out if the DLR is being used in any Process Flow.

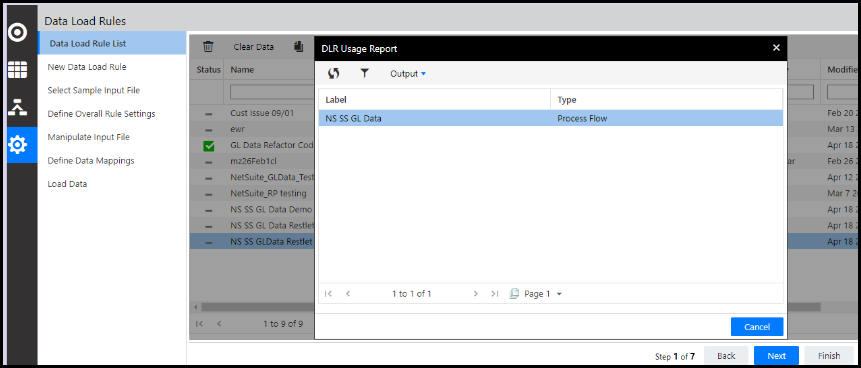
If the DLR is being used in a Process Flow, as shown in the above screenshot, edit the Process Flow and remove the Task with that DLR. If there is only one Task in the Process Flow, then you will have to delete the Process Flow to continue changing the DLR type.
Return to the Data Rule Page and double click a DLR on the Data Load Rule List page. The Data Load Rule opens.
Change the load type as needed.
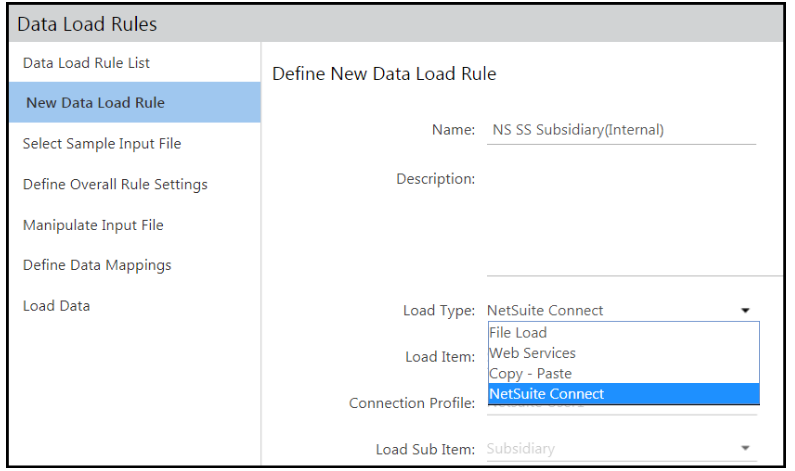
Complete the remaining steps from Select Sample Input File to the Load Data step to use the DLR.
- To use NetSuite Connect there are required setup steps. Click here to learn all about NetSuite Connect and how to perform the setup.
- For detailed information on Data Load Rules and how to load data, see the Admin Guide to Loading Data.
Platform: Ability to Copy Data Integration Service Processes
Now, you can make a duplicate copy of a Data Integration process. Then, you can change the copied version as needed. Copying a Data Integration process saves time and is convenient.
The Data Integration Services feature allows you to manage the Integration Process with Boomi from within the Host Analytics application. Use the Integration Service to execute a custom Integration Process to load metadata, summary data, transactions data and operational data to Host.
For information on how to configure Integration Services, click here.
In Practice
To copy a Data Integration process, complete the steps below.
Navigate to Maintenance > Admin > Configuration Tasks.
On the Configuration Task page (under Data Integration Configuration), click Cloud Services.
On the Cloud Services page, select Integration Service as shown below.
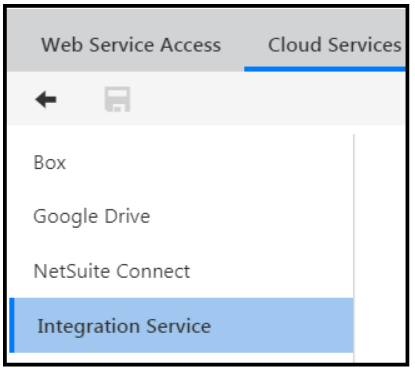
Integration Service process are shown (an example is provided below). Select the three vertical dots for a process and select Duplicate.
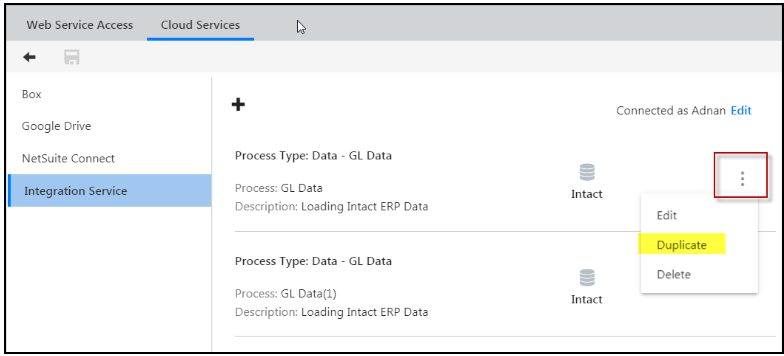
The Duplicate Process screen appears. The name of the process is the same name of the selected process you are copying, but it is preceded with “Copy of” and an incremental number for the times a copy is made is also added as a suffix. You can keep this name or rename the process. Then, click Create.

Platform: Custom Parameters as Required or Optional Now Available for Data Integration Services
Host provides you with the ability to customize your data integration processes You can now mark custom parameters as Required or Optional to an Integration Service Process and during run time the required custom parameters need to be completed mandatorily by end users. For example, let’s say you have a process to load all GL Data for your South American subsidiary. You also load GL Data for the North American subsidiary as a separate process. You want users to specify which subsidiary data is being loaded for. As another example, you might load sales data based on product and location. There are endless ways you can customize data integration.
This portion of the document discusses:
How to Add Required Custom Parameters
How to Add Optional Custom Parameters
How to Setup an Integration Process to Load Data with Custom and Optional Parameters
In Practice: How to Add Required Custom Parameters
Navigate to Maintenance > Admin > Configuration Tasks.
Select Cloud Services.
Click the Integration Service tab.
Add a new process or edit an existing.
On the Add/Edit Configure Process page, there is a new Customer Parameters field as shown below. Click Add to create custom parameters.
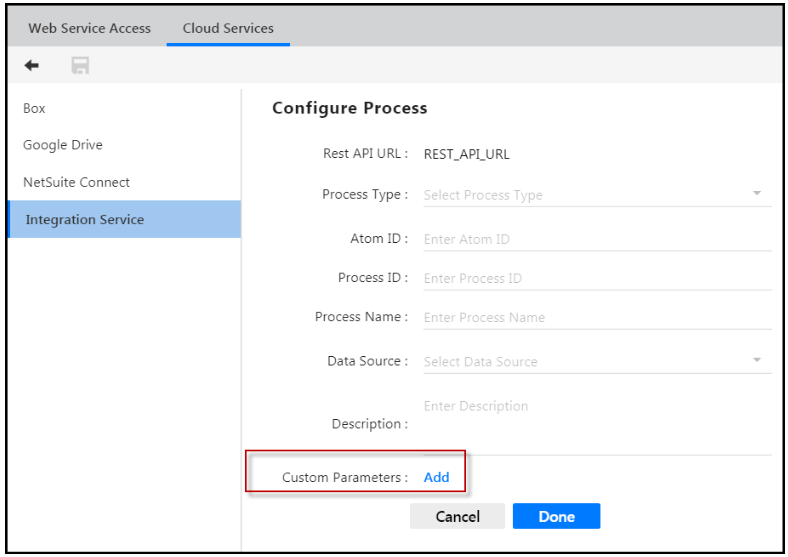
When you click to add custom parameters, the Custom Parameters page displays as shown below. Enter a name for the custom parameter and provide a label. Note that these two fields can be the same.
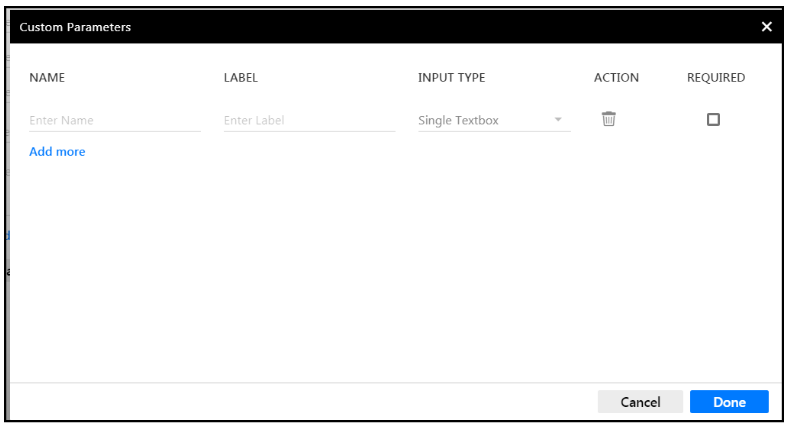
For Input Type, select to present the user with a textbox or a dropdown list box. If you select Dropdown, you will be prompted to enter selectable options.
Select the Required checkbox as shown below. By selecting Required, users executing the process will be required to provide an input value for the parameter.
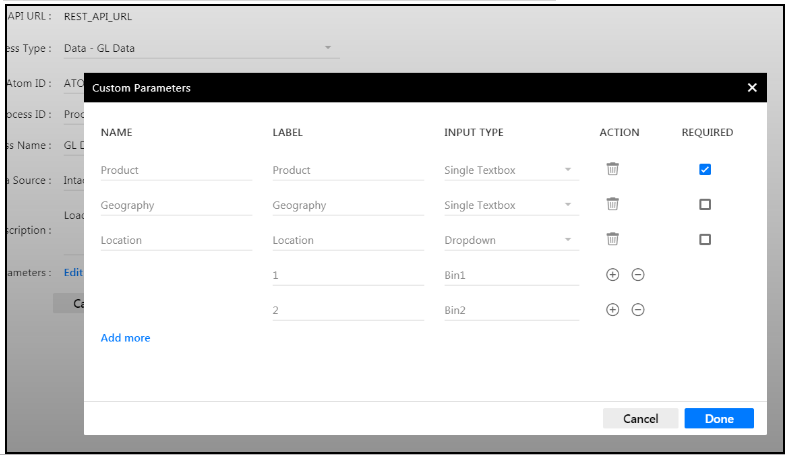
Click Add more to add additional custom parameters or click Done. Once complete, the number of parameters added (required or not) will display on the Configure Process page - Custom Parameters field as shown in the image below.
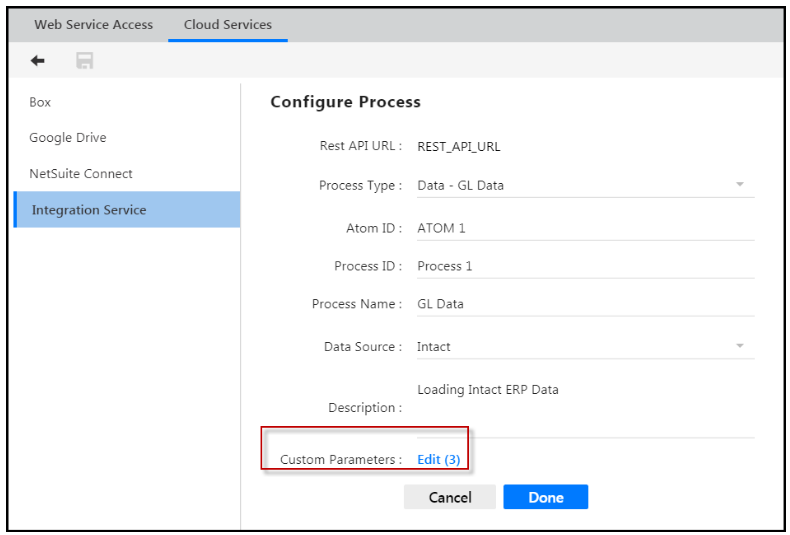
In Practice: How to Add Optional Customer Parameters
Navigate to Maintenance > Admin > Configuration Tasks.
Select Cloud Services.
Click the Integration Service tab.
Add a new process or edit an existing.
On the Add/Edit Configure Process page, there is a new Customer Parameters field as shown below. Click Add to create custom parameters.
When you click to add custom parameters, the Custom Parameters page displays as shown below. Enter a name for the custom parameter and provide a label. Note that these two fields can be the same.
For Input Type, select to present the user with a textbox or a dropdown list box. If you select Dropdown, you will be prompted to enter selectable options.
DO NOT select the Required checkbox as shown below. When you do not select Required, users have the option of completing the parameter when executing the process.
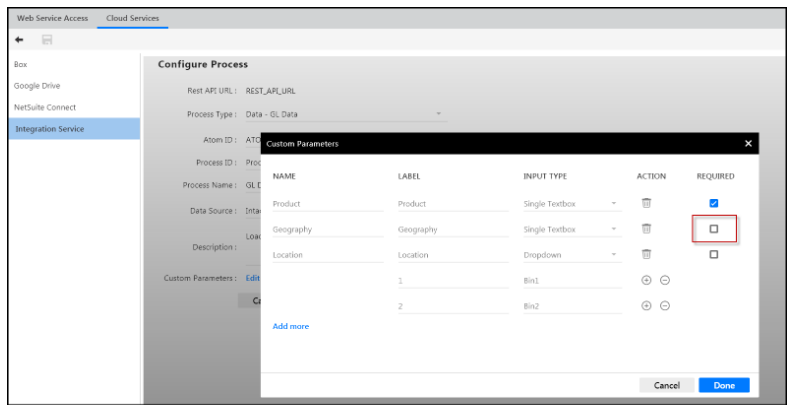
Click Add more to add additional custom parameters or click Done.
How to Setup an Integration Process to Load Data with Custom and Optional Parameters
Once admin users have set up custom parameters (optional or required or both), users should follow the steps below to execute an Integration Services process.
In this example, the Process to execute Segment Hierarchies Load is created as an Integration Service process as shown below. And, two custom parameters are defined; one being required and the other is optional (see second image below).
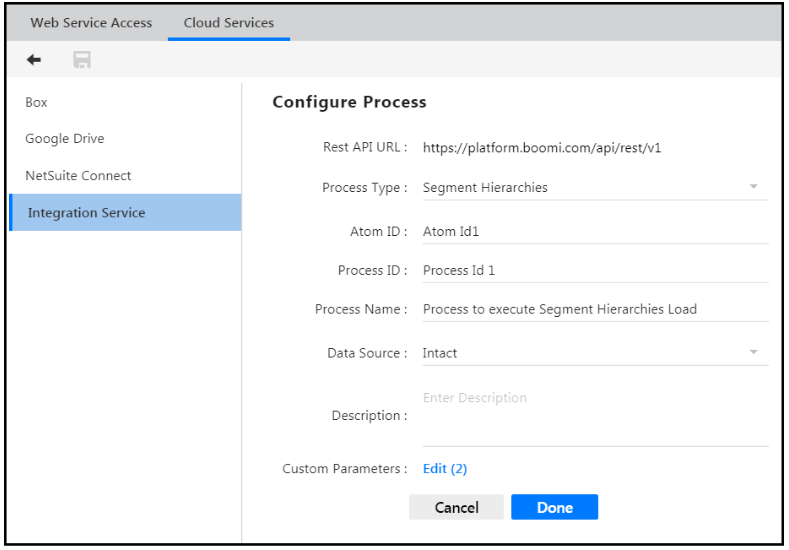
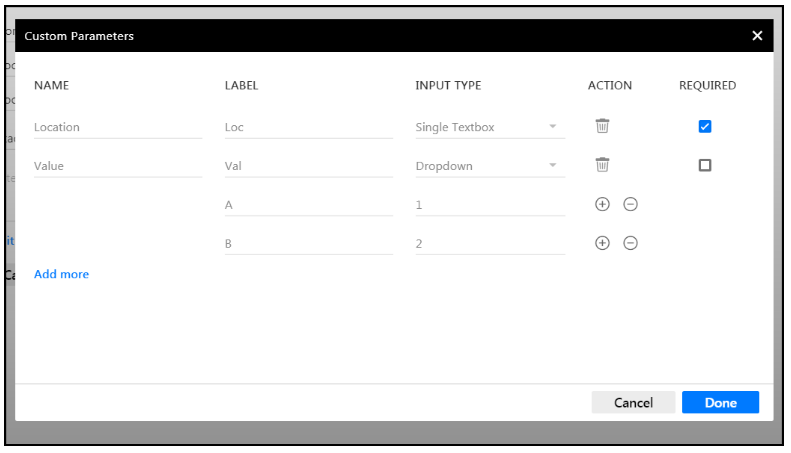
In Practice
Navigate to Maintenance > DLR > Integration Services.
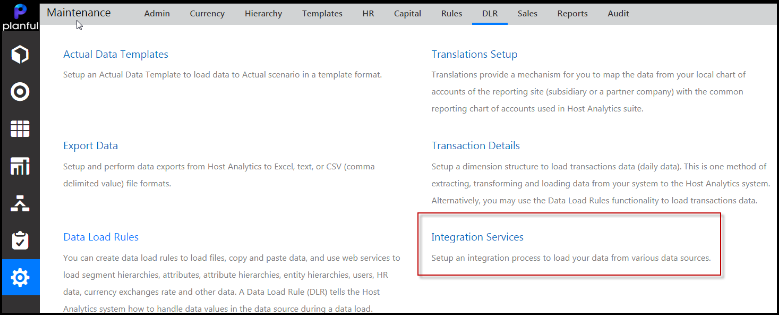
The Integration Service page is displayed. Select a process by name. Notice that the names in the Process Name list-box are populated from the processes defined on the Integration Process page.
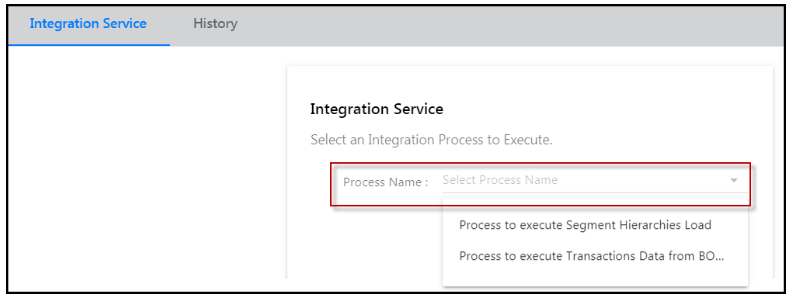
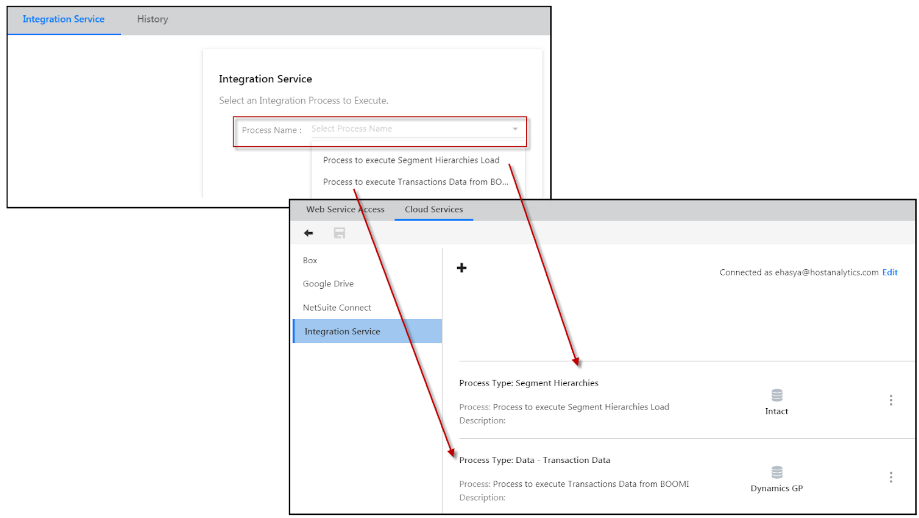
In this example, the Process to execute Segment Hierarchies Load is selected. Notice that the Loc (location) field is required, but the Val (value) field is optional. Required parameters are mandatory and the Integration Process will not execute without the parameter completed. Optional parameters are not required and it is up to the user as to whether the optional parameters are completed. If you execute the process without entering a value for the Loc field, the system will prevent it. The second image below shows the message that appears when a required field is not completed.
Complete the required fields (as shown in the 3rd image below) and click Execute Process.
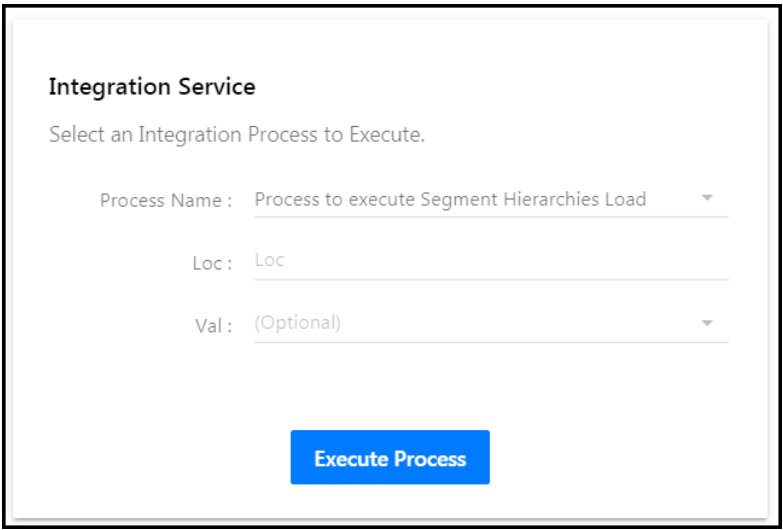
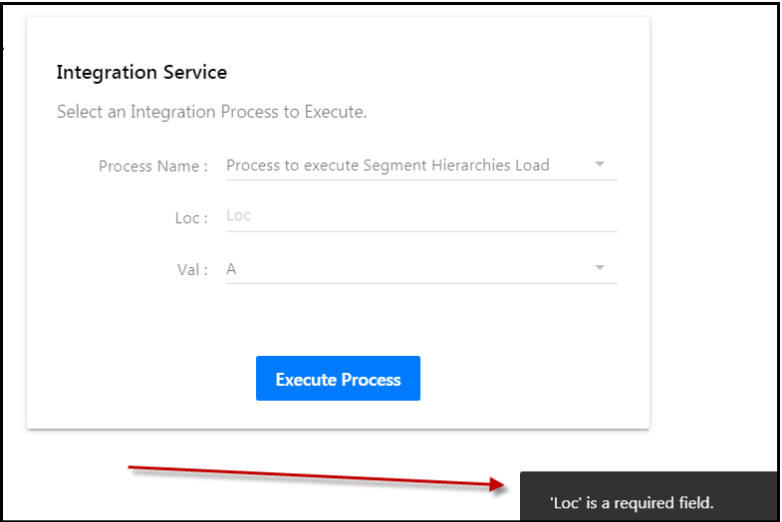
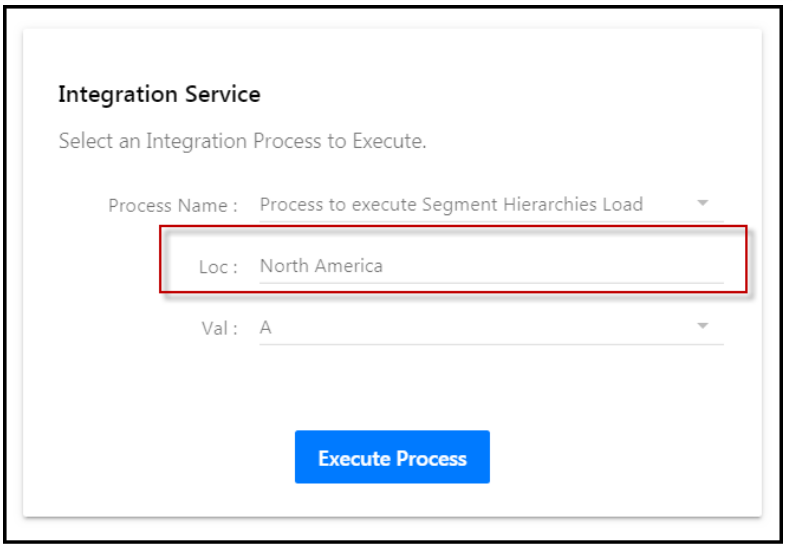
You can view all processes by clicking the History tab, selecting a process name and the dates for which it was executed.
Common: Ability to Add a Profile Picture to a User Account
With this enhancement, we have added the ability to add a profile picture to your account. Previously, only the initial letter of your first name was displayed as an image. You can now select any photo from your computer as your profile picture.
Once you add the profile picture, it appears at various places in the application, where your user profile was earlier displayed with the initial letter of your name, such as:
Profile Management/User Profile icon on the left options pane
Under the Assignee column on the Task Manager page
While searching for a new assignee on the Task Manager page
Dashboards
MyPlan
To add a profile picture, follow the steps below.
Navigate to the Maintenance > My Settings > User Information tab.
In the Profile Picture field, click the Camera icon to select a profile picture. By default, the image displays the initial letter of your first name.
In the Select Profile Picture window, click Browse and select a photo from your computer.
Adjust the image dimensions, and then click Set Profile Picture.
Click the Save icon. The profile picture that you selected is displayed in the Profile Picture field.
You can also remove your chosen profile picture and revert to the default settings. To do so, click Reset to Default from the Profile Picture field.
Best Practices
You can upload any image with the maximum size up to 1 MB.
The image can be of the following file formats: JPG, JPEG, PNG, and GIF.