1.9.1 Modeling Release Notes, December
- 10 Minutes to read
- Print
- DarkLight
- PDF
1.9.1 Modeling Release Notes, December
- 10 Minutes to read
- Print
- DarkLight
- PDF
Article summary
Did you find this summary helpful?
Thank you for your feedback
New Features and Enhancements
Improved User Experience When Refreshing View and Reports
Ability to Display Leaf Members of an Attribute’s Mapped Dimension
Selection to Map Leaf Level Members of a Dimension Hierarchy
Option to Create Dimensions as Attributes
Improved Dimension Security in Reports
Improved User Experience When Refreshing View and Reports
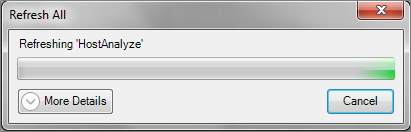
We’ve added a progress indicator that is available when refreshing views and reports using the Refresh all Open Reports or Get Data for all Open Views actions. The indicator is shown below.

You can opt to cancel the refresh by selecting the Cancel button.
Select the More Details button to view refreshing details, like which reports/views have already been refreshed and those that have not.
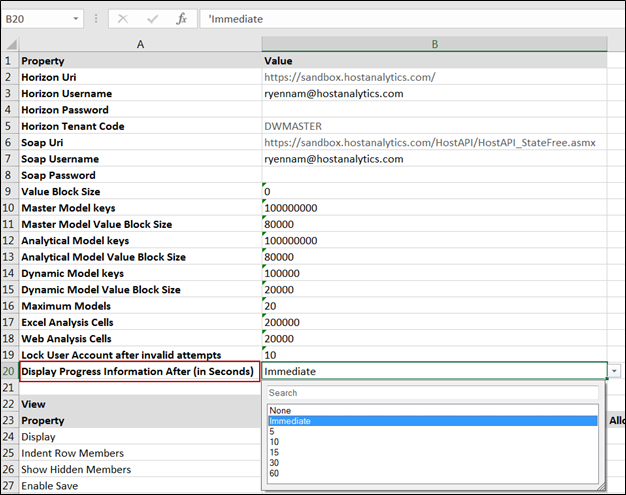
To enable this indicator, access the Manage task and the Application Settings subtask. For Display Progress Information After (In Seconds), select immediate, or you can select to delay the progress indicator from displaying for 5, 10, 15, 30, or 60. The default is None, meaning that the progress indicator does not display at all.
Ability to Display Leaf Members of an Attribute’s Mapped Dimension
With this release you can select to display leaf level members of an attribute’s mapped dimension in views and reports. For example, let’s say you have an attribute called Product Type, which is an attribute of the Product dimension. Leaf level members of this Product dimension include; electric, single gear, and competitive. Within a view or report, you can now select the Product Type attribute and view the Product leaf level dimension members (electric, single gear, and competitive).
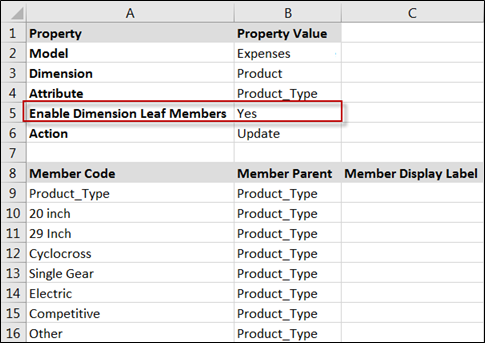
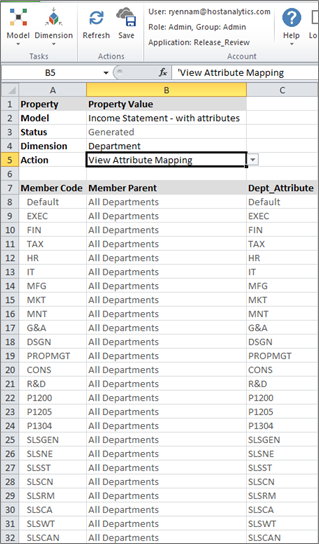
To enable this feature, access the Model task and the Attribute subtask. Select Yes for Enable Dimension Leaf Members as shown below.
Now, when you view the Product Type attribute in a view or report for the Expenses model, you can see the leaf level dimensions for the Product dimension. An example is provided below.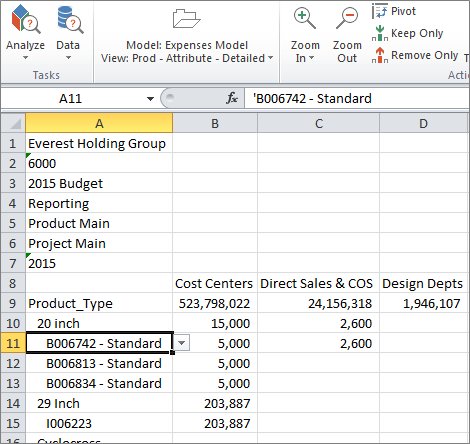
In the example above, ’20 inch’ is the product type attribute member whereas ‘B006742’, ‘B006813’, and ‘B006834’ are the product dimension members.
If Enable Dimension Leaf Members is set to No, the leaf level dimension members will not be available to view in a report or view.
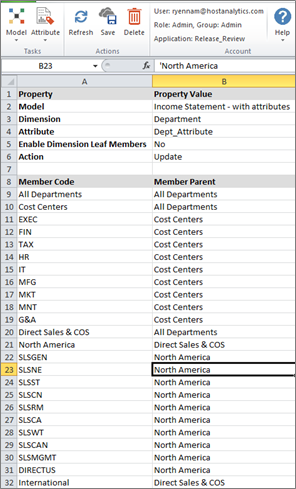
In some cases, selecting Yes for Enable Dimension Leaf Members may result in a duplication conflict due to your naming convention for dimension and attribute members. For example, you might have a dimension named Sales in your dimension hierarchy. You might also have an attribute named Sales in your attribute hierarchy. This conflict may occur due to the attribute Member Code or Member Display Label. In order for the application to respond properly, you must change the Member Code or Display Label of the attribute.
To change the Member Code or Display Label of the attribute, access the Model task and the Attribute subtask. Select the Model, Dimension, and Attribute. Change the Member Code or Display Label and click Save.
When Enable Dimension Leaf Members is set to Yes and a duplicate is detected by the application, an email will be sent to the user. You can also view duplicate members, by accessing the Model task and the Model Validation subtask. The Model Validation page as well as the duplicate Sales Member Code (which is SALES) for the AllReportingResponsibility attribute is shown below.
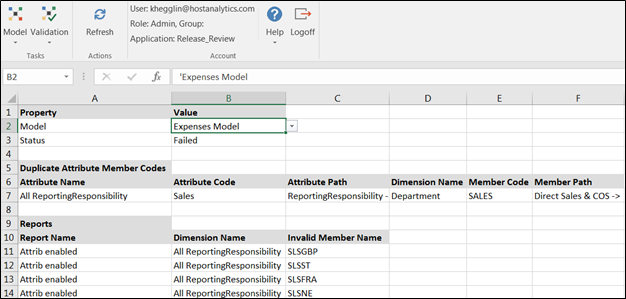
The fields under the Duplicate Attribute Member Codes heading are described below.
Attribute Name | The name of the attribute that has either a duplicate Member code or Display Label. |
Attribute Code | The code of the attribute member that has either a duplicate Member code or Display Label. |
Attribute Path | The location of the attribute within the hierarchy. |
Dimension Name | The name of the dimension that has a duplicate name. |
Member Code | The name of the dimension member that is duplicated. |
Member Path | The location of the leaf level dimension member within the hierarchy. |
IMPORTANT!
The Drill Through action for a view or report does not work when Enable Dimension Leaf Members is set to Yes. This is a Known Issue and will be addressed in a future release.
Selection to Map Leaf Level Members of a Dimension Hierarchy
We’ve added a new filter selection to the Model Map page that allows you to map leaf level members of a specific dimension. You might use this functionality, when for example, you want to create a model with all leaf level members of the Company dimension only. You do not want rollup members.
Access the Model task and the Map subtask. Select LeafMembers for the Company source and target filters. Specify the root member name of the dimension. In this example it is Company Main.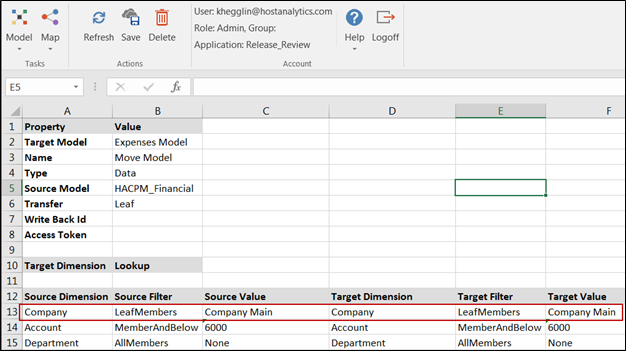
Option to Create Dimensions as Attributes
You now have the option to create dimension as attributes when moving the metadata from Core applications to Modeling. Doing so results in performance improvement and produces enhanced results for applications where all dimensions are not needed in Modeling, but you still want to have the ability to analyze the data related to the dimension.
Aggregating and calculating a model with fewer dimensions results in an improved experience and performance. The larger the model, the longer processing time. So, when building larger models with multiple dimensions (for example, 10- 12 or more) and huge volumes of data, we recommend you create some dimensions as attributes for reporting and analysis needs. Doing so will reduce the model aggregation time.
You can create a dimension / attribute that is available in Core applications as a dimension in the model, or, you can create a dimension as an attribute.
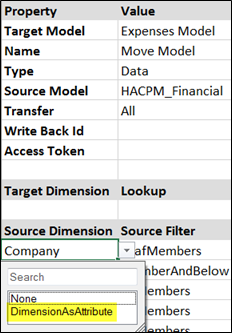
You can select to create a dimension as an attribute on the Map page. Select the Model task and the Map subtask. For Source Dimension, there is a new DimensionAsAttribute as shown below.
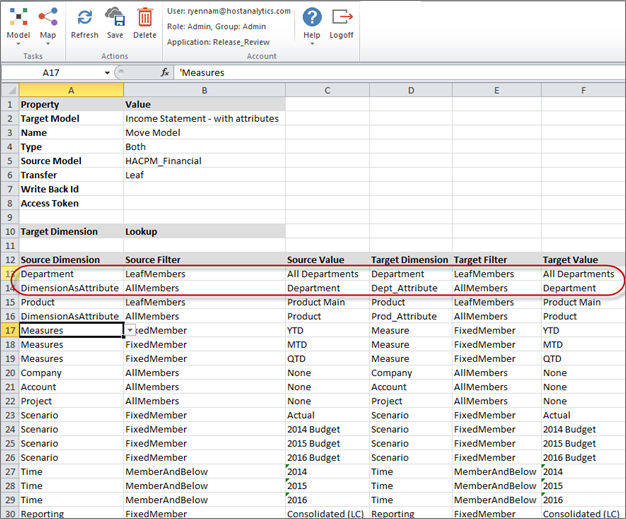
To create a dimension as an attribute you must define 2 lines your map (as shown below). Defining these two lines in the map creates a base dimension with leaf members as well as an attribute with all members (including rollups). For reporting and analysis purposes, use the Department attribute (which contains all members). For calculations and maps, use the base dimension (which contains leaf members).
Complete the following steps:
Define the dimension you want to create as an attribute (in this example the dimension is Department) with a source and target filter set to LeafMembers (shown above). Defining this line in this way in the map ensures that the dimension is created with all leaf members.
Define the same dimension (Department) as an attribute.
To complete this step, add an additional line in the map with the following selections:
Source Dimension - <DimensionAsAttribute>
Source Filter - <AllMembers>
Source Value - <Base Dimension Name>
Target Dimension - <Attribute name> Attribute name can be user defined and should not be same as the dimension
Target Filter - <AllMembers> AllMembers is the only filter type supported for DimensionAsAttribute
Target Value - <Base Dimension Name>
Note:
AllMembers is the only filter type supported for DimensionAsAttribute
When you map a dimension as an attribute, it creates a base dimension with leaf members, then it creates the attribute with all members including rollup members, and then it maps the base dimension members with attribute members.
Step 1 – Base dimension is created with all leaf members of
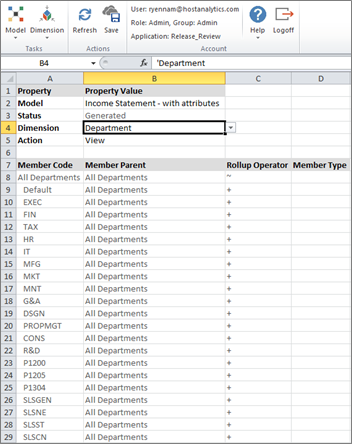
Step 2 – Attribute is created with all levels and members
Step 3 – Mapping between attribute members and dimension leaf members is complete so that the attribute can be used for analysis and reporting
Improved User Experience When Refreshing View and Reports
We’ve added a progress indicator that is available when refreshing views and reports using the Refresh all Open Reports or Get Data for all Open Views actions. The indicator is shown below.
You can opt to cancel the refresh by selecting the Cancel button.
The Progress Bar is enabled for the following areas of the application:
Refresh All Open Reports – when you refresh all reports
Get Data for All Open Views - - when you refresh all views
Report Run – When you run a report
Report Design – When you open a report in design mode
Report Save – When you save a report in design mode (there is no cancel button in this screen)
Design Manager – When you open the design manager in report design mode
Properties in report design mode
Click the More Details button to view refreshing details, like which reports/views have already been refreshed and those that have not.
When you click More Details in the progress bar, the details of all the workbooks being refreshed is displayed along with sheet names and the status of each sheet. There are 3 columns in the Model Details option. The first column is the workbook name, the second column is the worksheet name, and the last column is the status message.
If there are no cells in the sheet that need to be refreshed or the workbook has other sheets, the status will be ‘Not Applicable’. Once the sheet is refreshed, the status will change to ‘Completed’. When the sheet is refreshed, the status will change to ‘Processing’ as shown in the image below.
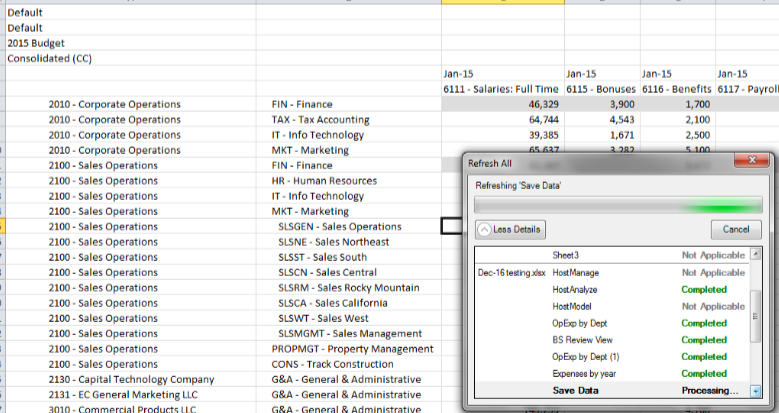
To cancel the refresh process, click the Cancel button in the progress bar. Canceling will complete the processing of the current worksheet and cancel the processing of remaining sheets (see image below).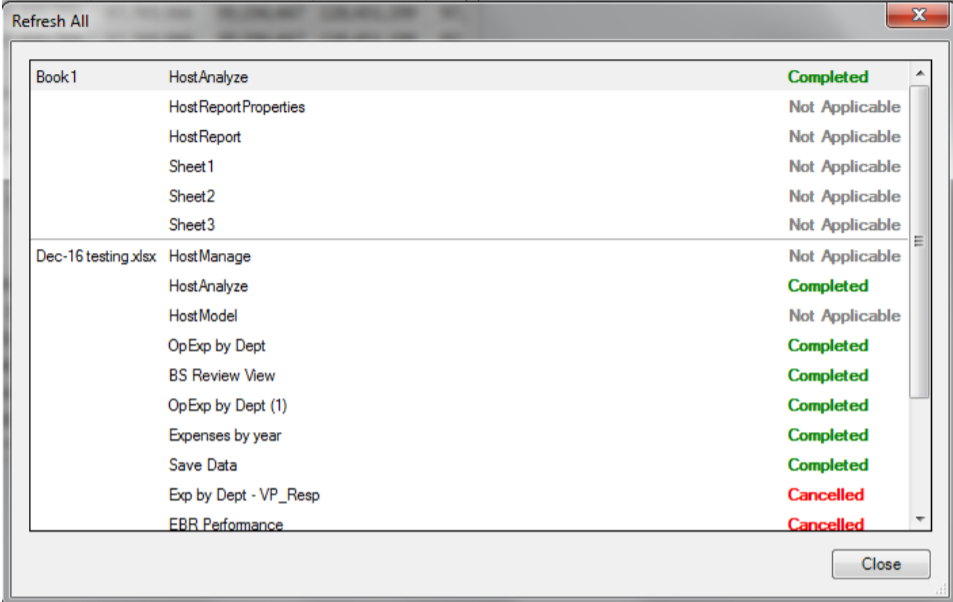
To enable this indicator, access the Manage task and the Application Settings subtask. For Display Progress Information After (In Seconds), select immediate, or you can select to delay the progress indicator from displaying for 5, 10, 15, 30, or 60. The default is None, meaning that the progress indicator does not display at all.
Improved Dimension Security in Reports
Prior to this release, in cases where a user did not have access to all members of a dimension located on the row or column of a report, the report would not display and result in an exception error. Now, the report will display and the exception error will not occur. However, to keep dimensions secure, the user will not be able to view the data in the report that the user does not have access to. That data will display as #NO ACCESS.
In the example report below, the user only has access to the 6700 – G & A dimension member. The report is displayed and only the data for that dimension member is displayed.
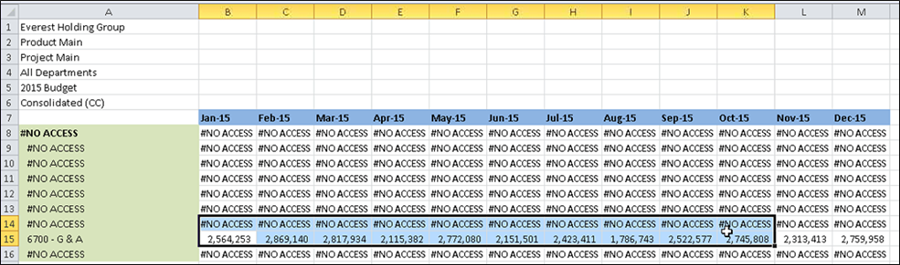
In cases where a member is deleted or not found in the model and there is a report defined that references the deleted member, #INVALID is displayed.
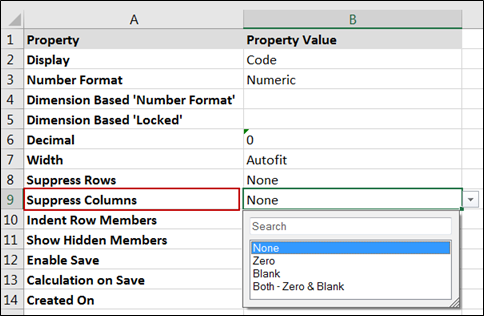
Suppress Columns in Views
A new option is available to suppress columns in views. To enable this option, select the Analyze task and Design View subtask. Click the Properties action. For Suppress Columns, select to suppress all columns with zero values, blank columns, or both blank columns and those with zero values. The default is None.
Known Issues
1756 | Worksheet name is not visible in Progress bar if the workbook name is very long. |
1723 | Drill Through is not supported from Analyze or Report if there are attributes in the View or Report where Enable Dimension Leaf Members is set to ‘Yes’ |
1671 | hen building formulas, Include a space before and after the subtraction sign in the Formula |
1527 | When a dimension is deleted then the map is not updated Delete the corresponding Attributes in Map when base Dimension is deleted. |
1492 | Using special characters for the model name results in errors. |
1464 | When suppress rows/columns is enabled, If Dimension Members and Data Intersection are available in same column/row in a report then dimension members will be suppressed along with data intersections. |
1457 | In some cases Suppress blank rows/columns is not working as expected when Groups are expanded in the report. |
1455 | Suppress blank rows/columns is not supported in Spotlight (i.e. Web Interface). |
1454 | In Some cases Suppress blank rows / columns is not working as expected if groups and freeze panes are enabled in the Report. |
1446 | Unable to navigate to Design View after rename or remove HostAnalyze worksheet. |
1406 | Excel a Chart Problems. |
1387 | Designer cannot generate external data source model. |
1322 | Unable to cascade with substitution variables. |
1321 | Substitution variables are not working as expected in Cascade Report. |
1277 | Permissions for view: Group setting not retained for New View. |
1273 | Cascade Report has inconsistencies with Filters. |
1144 | Freeze Panes location should not be outside of the sheet viewable range. |
765 | Exclude POV is not working in the cascade report |
687 | Modified Report definition by removing months column still retain after Refresh. |
477 | Cell scaling and Cell Locking options are not working in cascaded report |
405 | In Report Design, specify a dimension to be cascaded. Copy and paste the cascaded member/block in the same column. Select Save and Run and the following is displayed 'Cannot find variable '@Cascade' in model...'. Select Refresh and the following is displayed 'Object reference not set to an instance of an object'. |
Resolved Issues
1742 | Dimension Member IDs in the maps have to be updated before use. |
1740 | Updated the error message which will be displayed during the data download from Core application. |
1737 | Excel Workbook1 is frozen after selecting Design Manager in Workbook2 running in same instance. |
Was this article helpful?