2.0 Modeling Release Notes, February
- 6 Minutes to read
- Print
- DarkLight
- PDF
2.0 Modeling Release Notes, February
- 6 Minutes to read
- Print
- DarkLight
- PDF
Article summary
Did you find this summary helpful?
Thank you for your feedback
Features and Enhancements
Organization of Maps in Folders
Folder Structure Functionality Now Available in Spotlight
Organization of Maps in Folders
Similar to views, reports, calculations, and formulas, we’ve added folder structure functionality in SpotlightXL, which allows you to organize your Maps. Additionally, you can add Maps to your Favorites folder by right-clicking on the Map and selecting Add to Favorites. In the example below, the Move Model Map is located in the budget maps folder under the Attribute Example model.
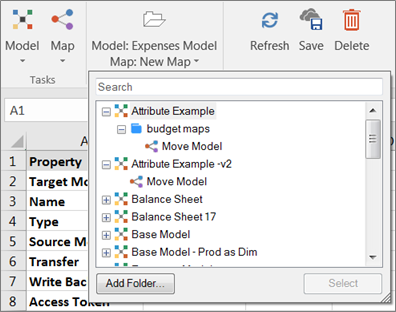
Use the Search functionality at the top of the screen to search for Maps, then use the up and down arrows to scroll through the results.
Favorites and Recent folders are user specific. The Recent folder displays 10 recently accessed Maps by user. The Favorites folder displays 10 Maps. If you add more than 10 items, the most recent 10 are displayed.
You can add folders, delete and rename folders as well as move Maps from folder to folder by dragging and dropping.
Note:
Folders are not based on security role (Admin, Designer, Reviewer), so any user role can add, edit, rename, or delete a folder, or move any maps they have access to from folder to folder.
Folder Structure Functionality Now Available in Spotlight
The folder structure functionality, currently available in SpotlightXL for Views and Reports, is now available in Spotlight (the web interface).
You can access this functionality by:
Logging into your Host Analytics Planning application from the web interface and navigating to Modeling.
Or, via a web browser by entering your Spotlight url.
Folder Structure for Views
In the image below, Views is selected and the folder structure for all Views (and related models is displayed). Move views to a folder or from one folder to another by dragging and dropping the view.
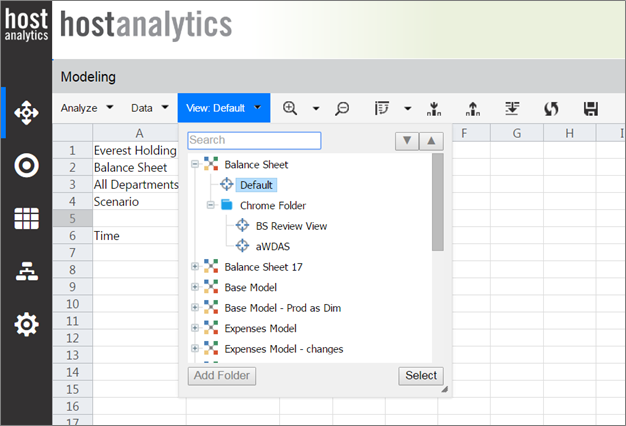
You can add folders to organize your reports by clicking the Add Folder button or perform a search to find specific reports.
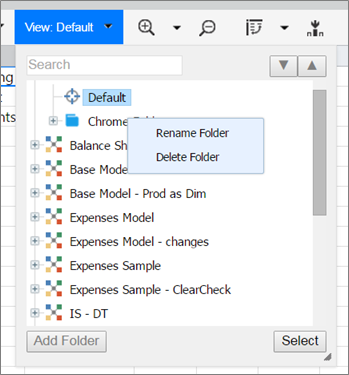
To Rename or Delete a folder, right-click as shown below:
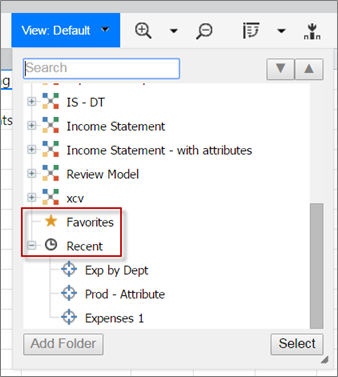
Use Favorites and Recent folders to quickly access your favorite Views or recently accessed Views.
Favorites and Recent folders are user specific. The Recent folder displays 10 recently accessed Views by user across all Models. The Favorites folder displays 10 items. If you add more than 10 items, the most recent 10 are displayed.
Open the folder structure (as shown below) and scroll to the Favorites and Recent folders.
Folder Structure for Reports
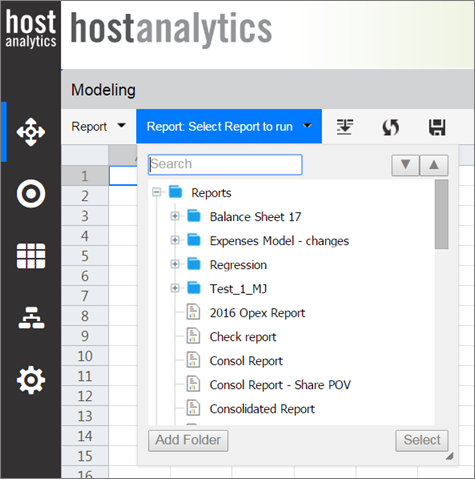
If you select Reports, click the Report: Select Report to Run to display the folder structure with reports.
Click Add folder to add a new folder. Drag and drop reports to a folder or from folder to folder.
Rename, Delete, Recent, and Favorites functionality is available for reports as it is for views.
Note:
Planning and Modeling applications must be integrated. The Support team can configure the integration between your Planning and Modeling applications if not already integrated. Also, you can access Modeling directly from the web interface by entering the URL and providing your user name and password.
Enhanced Dimension Browser
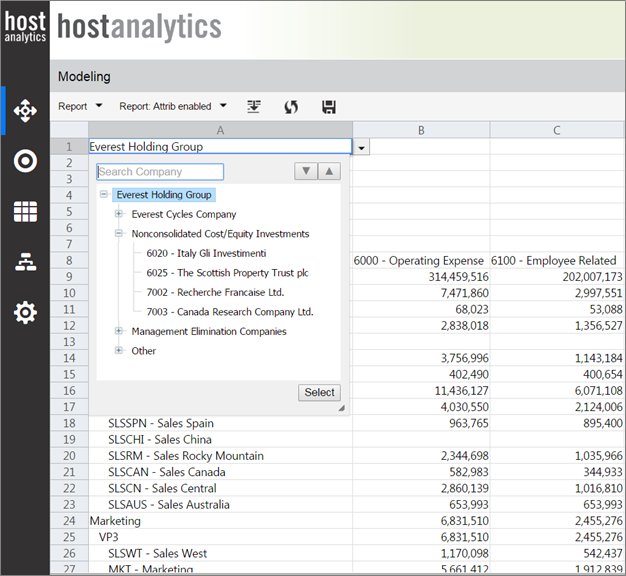
With this release we have enhanced the dimension browser functionality available in Spotlight (the web interface) to support level based hierarchies for easy navigation within the dimension. In the example below, the Company dimension is displayed. Browse through the level based hierarchy and select a member to display. In the Company hierarchy below, the Everest Holding Group is the root member, Everest Holding Company rolls up to Everest Holding Group, and Canada Research Company is a leaf level member.
Enhancements to API library
With this release we have enhanced the APIs available to load and clear data for external source models.
Clear Data API
The Clear Data API clears existing data from Master and Analytic models based on the scope of the definition. With this release, when clearing data from an external source model, you can opt to clear specific data versus the entire model. To clear specific data, you'll use filters. To clear all model data, you'll use the API without filters. For example, you might opt to clear data for a specific period, a department or a company.
The syntax below provides example syntax to clear data for two fields (each of which have 3 values) from an external source model.
Clear Data - External Source Model
<clear-data-payload>

<model-name>$SourceModelName</model-name>

<filters>

<filter>

<field> </field>

<field-value></field-value>

<field-value></field-value>

<field-value></field-value>

</filter>

<filter>

<field> </field>

<field-value></field-value>

<field-value></field-value>

<field-value></field-value>

</filter>

</filters>

</clear-data-payload>
The sample payload syntax below provides an example to clear data for month 1, 2 and 3 (Periods 1, 2, and 3) for the Sales and Marketing departments.
Sample Payload
<?xml version="1.0" encoding="UTF-8">

<clear-data-payload>

<model-name>My external model</model-name>

<filters>

<filter>

<field>Department</field>

<field-value>Sales</field-value>

<field-value>Marketing</field-value>

</filter>

<filter>

<field>Period</field>

<field-value>Period1</field-value>

<field-value>Period2</field-value>

<field-value>Period3</field-value>

</filter>

</filters>

</clear-data-payload>
Load Data API
With the Load Data API you can now opt to have a success and / or failure notification emailed to you. Sample syntax is provided below.
Notify on Success
<notify-on-success>

<email>email1@domain</email>

<email>email2@domain</email>

</notify-on-success>
Notify on Failure
<notify-on-failure>

<email>email1@domain</email>

<email>email2@domain</email>

</notify-on-failure>
Note:
Success/failure notifications will only be sent to registered users. Add users in the application before including the users in the email notifications.
Undo Option in Design Manager
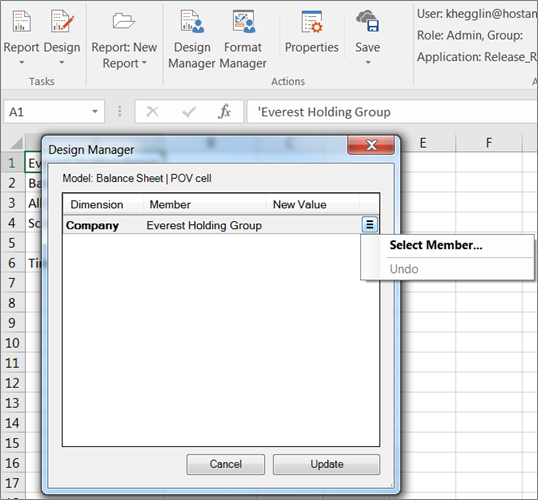
The “Undo” option (shown below) is available in Design Manager when selecting a new member value for a dimension. For example, if you select a new Company instead of Everest Holding Group, and then decide you don’t want to change the value, you can click Undo prior to clicking the Update button, which commits the change.
Additional Enhancements
Calculation Status
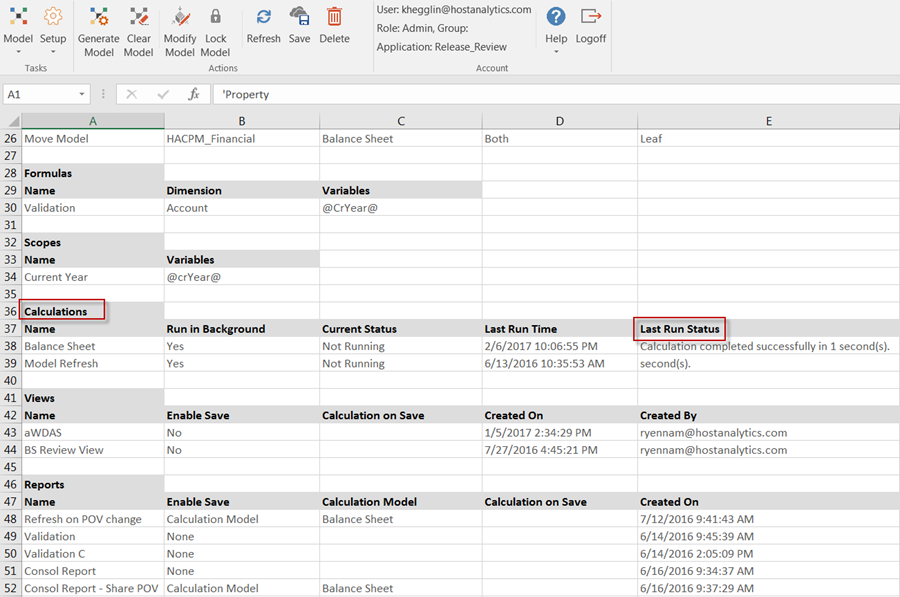
The Last Run Status column available in the Calculations section of the Model Setup screen (shown below) will display the last run status only and will not display detailed steps of the Calculation.
Lock / Unlock Model
While hierarchy updates are being processed, the application will not allow a user to unlock a model.
Process Management
On the Manage, Application Administration - Process Management page, Admin users can now see a list of active background calculations that are currently running along with information on the user that submitted the Calculation.
Known Issues
2113 | Integration between Planning & Modeling applications from web interface is best supported in Google Chrome browser. Users cannot navigate from Planning to Modeling if Internet Explorer compatibility mode is turned on. |
2108 | If dimension member names are too long then design manager window does not appear correctly. |
2080 | If users are using Firefox browser, right clicking an item in the Folder structure may display an incorrect menu. |
2017 | If users are using Firefox browser dimension hierarchy dropdown will only show up to 30 levels. |
1882 | Once the model that a variable refers to does not exist, the user is not able to delete or fix the invalid variable in the associated report. |
1845 | If POV member defined is removed or renames, it cannot be fixed in report design mode and error is displayed. |
1492 | Using special characters for the model name results in errors. |
1464 | When suppress rows/columns is enabled, If Dimension Members and Data Intersection are available in same column/row in a report then dimension members will be suppressed along with data intersections. |
1457 | In some cases Suppress blank rows/columns is not working as expected when Groups are expanded in the report. |
1455 | Suppress blank rows/columns is not supported in Spotlight (i.e. Web Interface). |
1454 | In Some cases Suppress blank rows / columns is not working as expected if groups and freeze panes are enabled in the Report. |
1446 | Unable to navigate to Design View after rename or remove HostAnalyze worksheet. |
1406 | Excel 2016 Chart Problems. |
1387 | Designer cannot generate external data source model. |
1322 | Unable to cascade with substitution variables. |
1321 | Substitution variables are not working as expected in Cascade Report. |
1273 | Cascade Report has inconsistencies with Filters. |
1144 | Freeze Panes location should not be outside of the sheet viewable range. |
687 | Modified Report definition by removing months column still retain after Refresh. |
405 | In Report Design, specify a dimension to be cascaded. Copy and paste the cascaded member/block in the same column. Select Save and Run and the following is displayed 'Cannot find variable '@Cascade' in model...'. Select Refresh and the following is displayed 'Object reference not set to an instance of an object'. |
Resolved Issues
1277 | Permissions for view: Group setting not retained for New View. |
2033 | Switching Excel sheet causes delay when the sheet has too many rows. |
885 | Groups are not retained when using Save As in Design View. |
Was this article helpful?