23.2 Release Notes
- 13 Minutes to read
- Print
- DarkLight
- PDF
23.2 Release Notes
- 13 Minutes to read
- Print
- DarkLight
- PDF
Article summary
Did you find this summary helpful?
Thank you for your feedback
Budget Manager Experience: Access Signals from the Menu Bar
Budget managers can directly access the Predict Signals-related options along with the Projection-related options from the top menu of a template using the Predict option.
.gif)
Read More...
With this release, budget managers can access the Predict Signals-related options from the top menu bar when they open a template or report. This enhancement eases the way budget managers access the Predict Signals feature. Instead of using this feature from the context menu, budget managers can now directly use the Predict option on the menu bar to access the Signals-related options.
.png)
Budget managers can select any cell in the template and do the following:
- Click Predict on the menu bar.
- Select any of the following options to generate signals:
- Check All Lines
- Check Selected Line(s)
To know more about Predict Signals in Budget Manager Experience, click here.
Budget Manager Experience: Search Option in WFP Templates
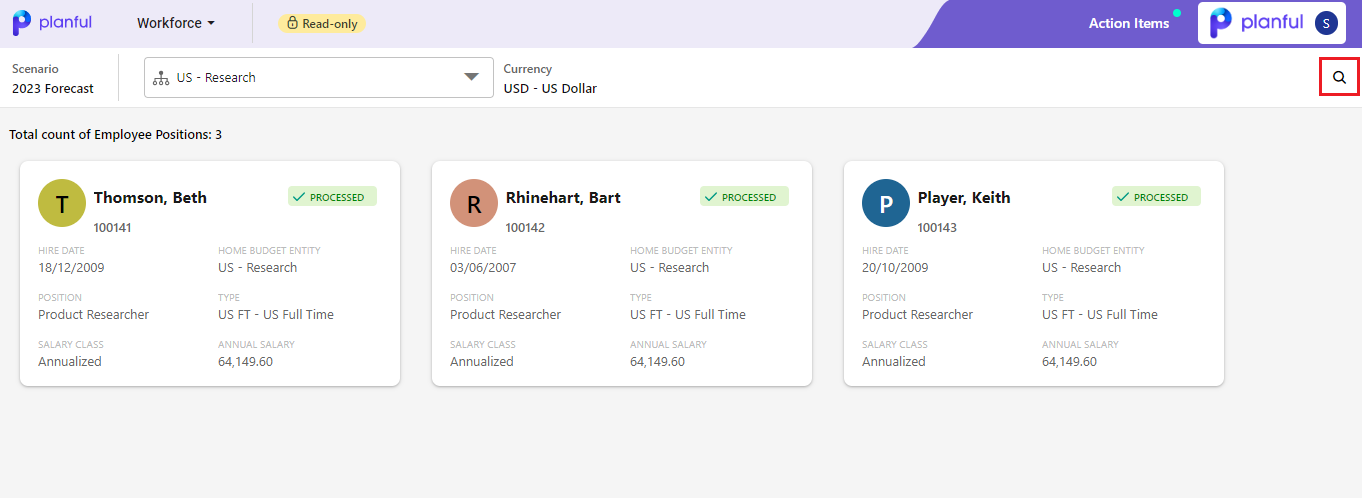
Workforce planning templates in Budget Manager Experience now have an Advanced Search feature. Budget managers can use this feature to find any specific employee's details or filter the list of employees they see in the template as per their requirements.
.gif)
Read More...
With this release, budget managers can use the Search option in WFP templates to find any specific employee's details. In addition to finding specific employees, budget managers can use the Search option to filter down the list of employees they view in the template using different filter options available on the Search screen.
The Advanced Search screen contains all the fields listed in the employee details as default search options.
Note
The search options that budget managers see in the Advanced Search screen depend on the configuration set on the respective workforce planning template by the admin.
In Practice: Using the Search Option
- After opening a WFP template, budget managers can click on the Search icon in the screen’s top right corner. The Advanced Search screen appears.
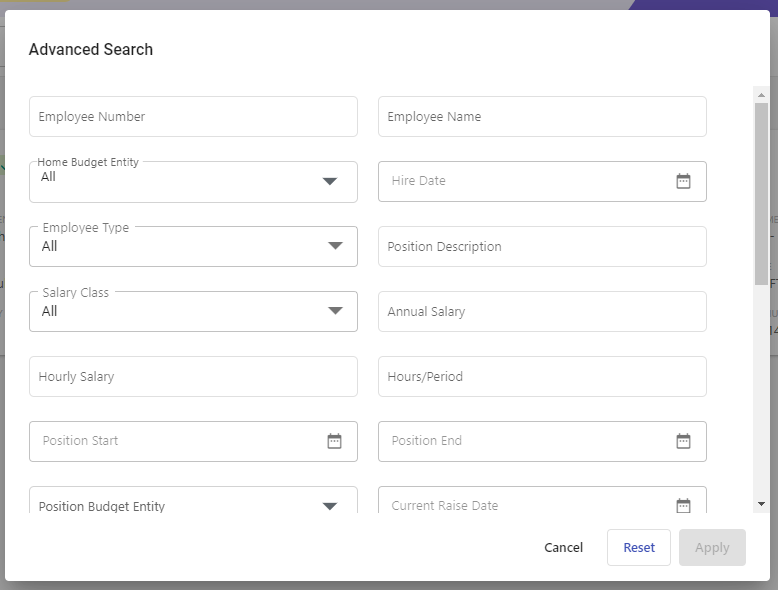
- To find a specific employee or to filter the list of employees, budget managers can use any of the advanced search options or a combination of these options based on their requirements and click Apply. The application will display the list of those employees who match the selected search criteria.
- Following are other options that budget managers can use while accessing the advanced search screen:
- Reset - Use this option to clear the values provided in any Advanced Search field(s).
- Cancel - Use this option to close the Advanced Search screen.
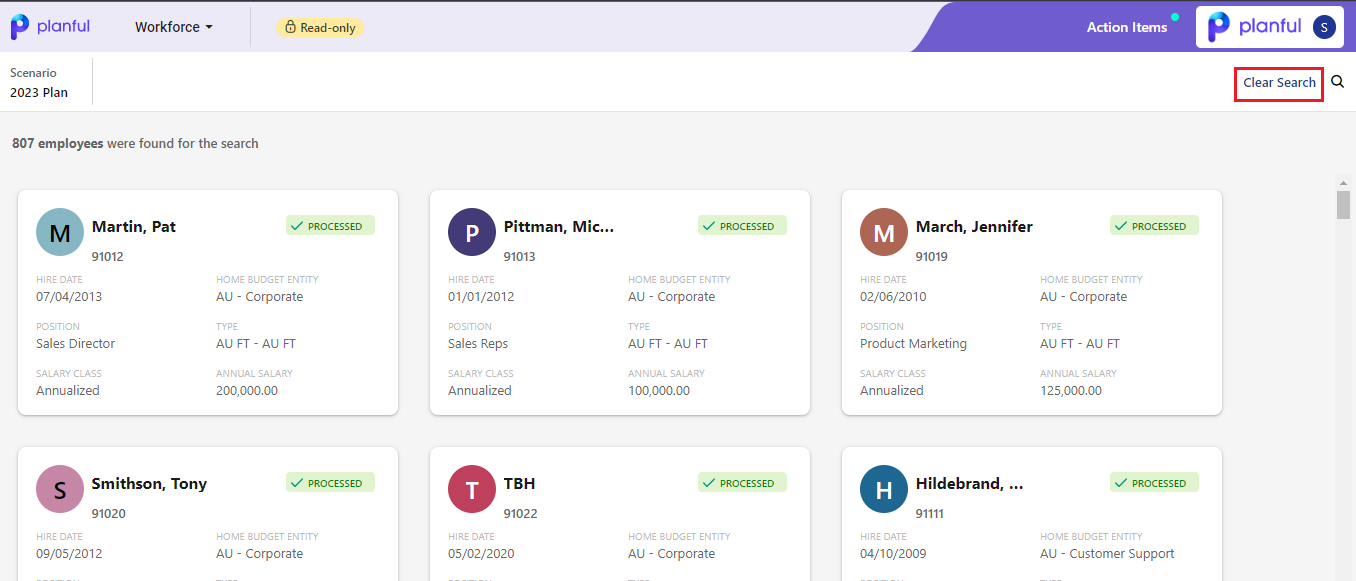
- To clear the search results and view the list of all employees in the template, budget managers can click Clear Search on the screen’s top-right corner.
To know more about workforce planning templates in Budget Manager Experience, click here.
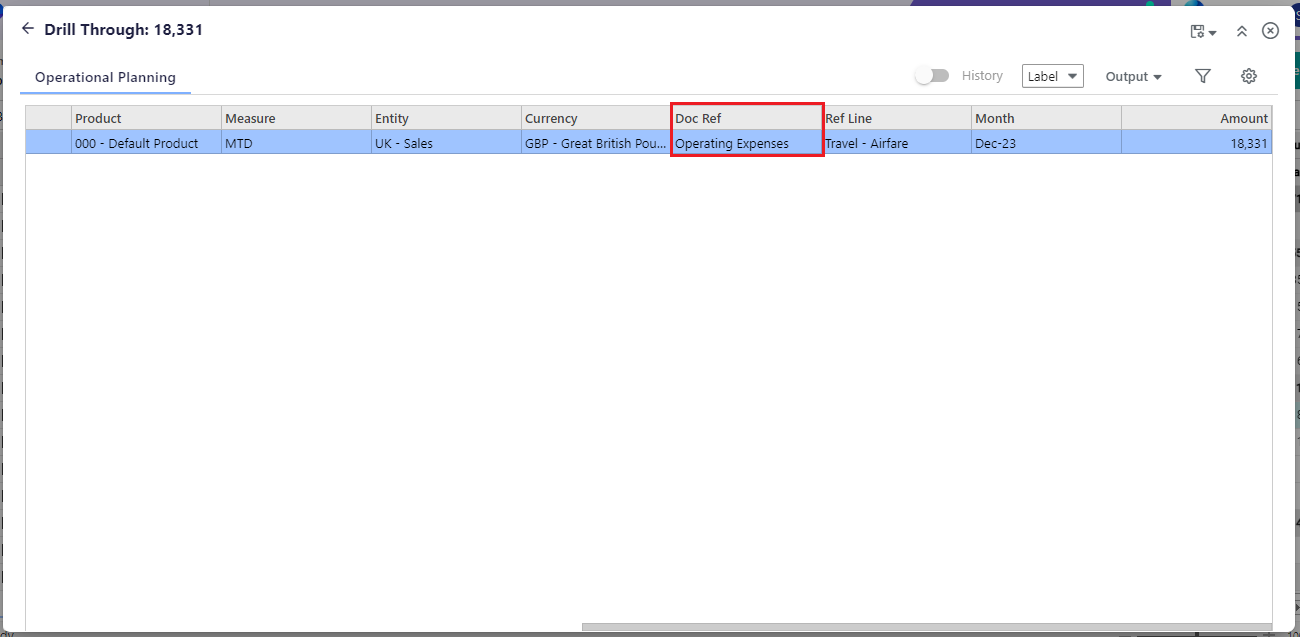
Budget Manager Experience: Read Only Doc-Ref
The Doc-Ref link in the Drill Through report is now a read-only text while analyzing a generated signal.
.gif)
Read More...
The Doc-Ref link in the Drill Through report is now a non-clickable text. As budget managers have access to only shared templates, they might not have access to the Doc-Ref linked source template. Therefore, to avoid any confusion, the Doc-Ref link is now a read-only text.
In Practice: Accessing Doc-Ref
- After generating Signals, budget managers can right-click on any signal and click Signal Context Screen.
- Right-click on any signal in the Signal Context table and click the Drill Through option.
- In the Drill Through report, the value in the Doc-Ref column is now a read-only text.
To know more about Predict Signals in Budget Manager Experience, click here.
Dynamic Planning: Planful Spotlight for Google Sheets
With the Planful Spotlight add-on, use Google Sheets to create detailed reports and run ad hoc analyses while keeping data synced with the Planful Platform. Analyze, present, and report with a sense of familiarity, quickly build management and financial reports directly in Google Sheets, and always keep data updated from Planful's single source of truth. With one click, refresh your data and move on with confidence!
.gif)
Read More...
With this release, Planful has introduced an add-on for Google Sheets, which creates a sync with your Dynamic Planning modules. This is the perfect addition to any finance team's stack, providing a comprehensive, flexible, and robust tool for all your analyzing and reporting needs. You will now have the ability to easily view the updates on a view or report for complex budgeting, forecasting, and ad-hoc analysis within Google Sheets.
With the Planful Spotlight add-on, you can access data sets from the Dynamic Planning interface using your login and specifying environment details. Once connected, you can perform tasks such as
- Quick ad-hoc analysis using the Default view even if you do not have a view setup.
- Zoom in to a specific level within the hierarchy.
- Zoom out from a specific level within the hierarchy.
- Swap row and column dimensions using different Pivot options.
- Quickly segregate data and only see what you want using the Keep Only or Remove Only options.
- Customize your view and organize your data the way you like by using the different More options like Display, Suppress Rows, Indent Row Members, Number Format, etc.
- View the reports and analyze the data further through graphs and charts available in the reports.
Previously, this feature was available only for Excel and Web, not allowing users using Google Sheets to integrate.
With this add-on, you can quickly view the updates in model data, collaborate with colleagues in real-time, and track changes to the budget and forecast, making it easy to transfer data from SpotlightXL or Spotlight Web to Google Sheets and ensuring accuracy and consistency of data across your organization.
Additionally, you can copy and paste the Google Sheets data into Google Slides by linking it to the spreadsheet. When you make any changes to the Google Sheets, you will be notified to refresh the Google Slides to refer to the latest changes. For more information, please refer to the Planful Spotlight for Google Sheets.
Dynamic Planning: Introduced a New Cell Dropdown Option in the SpotlightXL Menu Bar
A new Cell Dropdown option has been added as an additional option to SpotlightXL's menu bar to enable users to display any list data or dimension members. This option is in addition to the present functionality of double-clicking on the cell to view members of the dropdown.
.png)
Dynamic Planning: Added Four New Options in the Pivot Menu
In SpotlightXL, four new options have been added to the Pivot menu, in addition to the drag and drop functionality which is running into errors for some users who are on the Current Channel of Excel update. These new options provide users with an alternative way to carry out the Pivot Functionality within the Adhoc view. The four new options are:
- Pivot
- Pivot to Page
- Pivot to Row
- Pivot to Column
.png)
Dynamic Planning: Update to the SpotlightXL Add-In
If you have automated installation for SpotlightXL, then there is nothing you need to do as the update will be done automatically. If you manually install SpotlightXL and related updates, then you must access the Spotlight for Office Installation Guide and download the latest update.
Consolidation: Introduced Sort Order Option in the Journal Entry Report
With the Sort Order option, generate your Journal Entry report more precisely by selecting Period, Status, or Period & Status to get your desired report.
.gif)
Read more...
A Sort Order option has been introduced to quickly sort data before generating a Journal Entry Report, making it convenient for you to analyze and review the data. The following Sort Order options are now available:
- By Period: By selecting Period, you can choose a range that displays the entries in that particular range.
Note:
The latest entry will appear first.
- By Status: By selecting Status, you can generate a Journal Entry report for a specific status by choosing any of the below options:
- All (Status)
- In Process
- Pending Review
- Approved
- Posted
- Unposted
- Rejected
Let’s consider you have multiple entries in a given period, and you want a report with entries of a specific status. You can fetch that data by selecting any of the above options.
- By Period & Status: By selecting both you can have greater control over the accuracy and completeness of the reports that you generate.
Previously, the Journal Entry Report did not display or export data based on any order, making it difficult to read the report on the screen or in the exported excel.
Overall, the Sort Order option in the Journal Entry Report allows you to review and analyze the organized data in reports quickly, reducing the time and effort spent to sort or organize the data.
In Practice: To run and view the Journal Entry report
- In the Consolidation Control Panel, under Processes, select a process. The grid for the process you have selected appears.
- Under Reports, click Journal Entry Report. The Journal Entry Report dialog appears.
- Select the Scenario.
- Select the Period by selecting a date range using the calendar icon.
- Select the Journal Types. Available values are Standard Journals, Dynamic Journals, and All Journal Types.
- Select the Status for journal entries. Available values are:
- All (Status)
- In Process
- Pending Review
- Approved
- Posted
- Unposted
- Rejected
- Select the required Journal.
- Select the Display for journal entries in report results, available options are:
- Code
- Name
- Label
- Select the Sort Order, available options are:
- By Period
- By Status
- By Period & Status
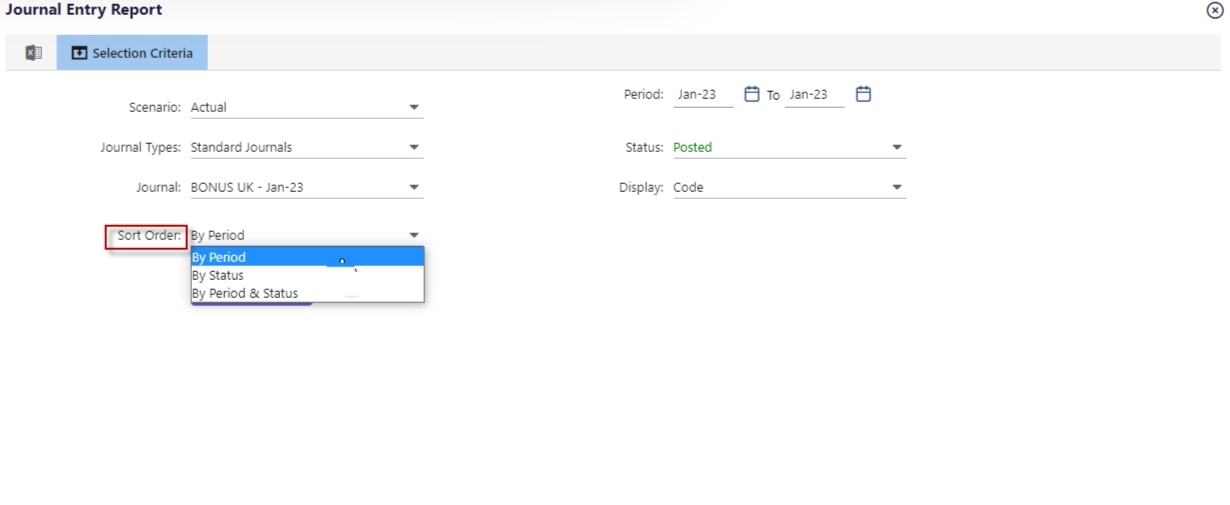
- Click Apply & Open. The report details appear within the Journal Entry Report dialog at the bottom.

.png)
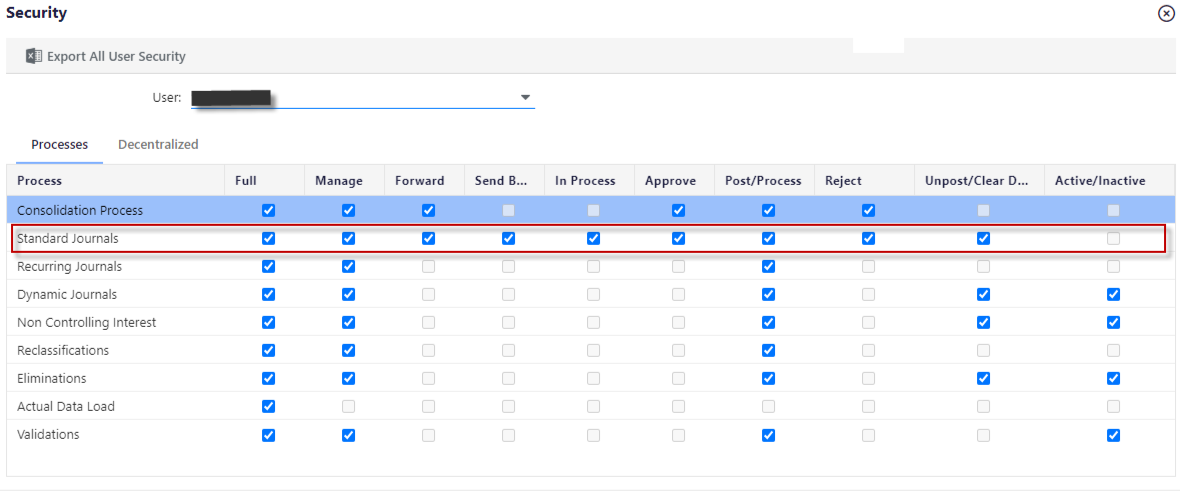
Consolidation: Enhanced Workflow Action to Post Standard Journals
With the enhanced workflow action, post one or multiple Standard Journals in a single click.
.gif)
Read more...
An enhanced workflow version to post Standard Journals is now available, reducing the required process time. Users with full permission can skip the workflow actions, such as Forward, Approve, etc., and directly post the Standard Journals. Now, you can select different statuses and post them in a single action, eliminating the need for multiple clicks and making the process more efficient.
Previously, posting any Standard Journals required multiple clicks, and users with full permission needed to perform different actions, such as:
- In Process
- Forwarded
- Approved
- Rejected
- Posted
- Unposted
This made the entire procedure tedious and time-consuming. Also, the application did not allow users to select and post multiple journals in different process states or carry out additional workflow tasks.
Overall, this enhancement in the workflow to post Standard Journals makes the process easier and faster. Furthermore, the reduced number of clicks will help minimize the chances of errors and provide a better user experience by making the process simpler and easier to understand.
In Practice: To Post Standard Journals
- In the Consolidation Control Panel, under Processes, click Standard Journals. The Standard Journals grid appears.
- Select the required Standard Journals that you want to Post.
- Under the Entry Actions, click Post. The Post Status dialog box appears. The Status column displays Success if the journal entry is posted successfully. Otherwise, the Status column displays Failure.
.png)
- Click OK to exit the Post Status dialog. The Standard Journal status is changed to Posted.
(1).png)
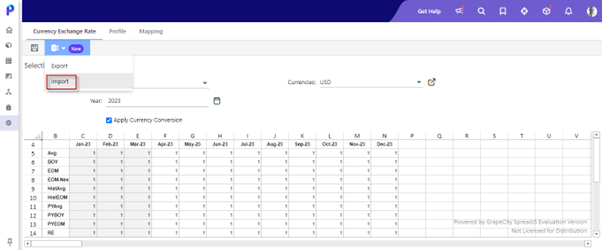
Consolidation: Introduced Import Option in Currency Exchange Rates Screen
Now, import your currency exchange rates in the exported file format without any hassle. You no longer have to edit/update exchange rates on the screen.
Read more...
With this release, we have introduced an Import option in the Currency Exchange Rate screen. This option allows you to import the exchange rates from the exported file format consisting of the updated exchange rates from one scenario to another.
Once the file is imported you can see the updated exchange rates on the Currency Exchange Rate screen. Previously, users had to edit currency exchange rate data on the screen and there was only an option of Exporting the data.
Business Value:
This feature eases the process of exporting currency exchange rates file from one scenario and importing it to another scenario. It allows you to edit the data of an exported file with errors and import it again.
In Practice: How to Import Currency Exchange Rates
- Navigate to Maintenance> Exchange Rates> Currency Exchange Rate tab.
- Select the Scenario, Currencies, Year, and Apply Currency Conversion checkboxes.
- Click the Excel icon from the menu bar.
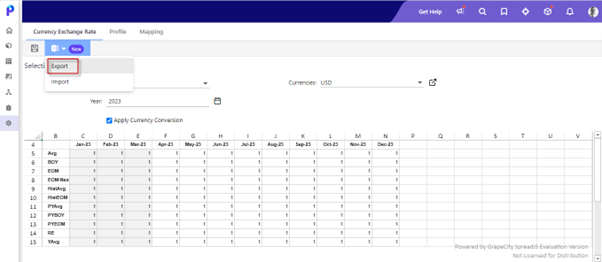
- Select the Export option from the drop-down list. Currency Exchange Rates visible on the screen will be downloaded in an excel file format.

- Edit the file and save it.
- Select the Import option from the excel icon drop-down list. Import Exchange Rates pop-up will appear.
- Upload the edited excel file and click Submit.
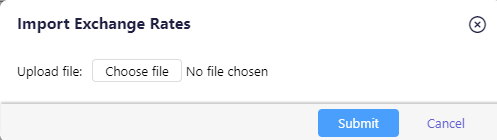
- You will receive a notification once the import is successful.

Note
In the import file avoid the following:
- You should not hide rows or columns
- You should not add blank rows or columns
- In case there are multiple exchange rate sheets, only the active sheet consisting of values is considered for import.
Consolidation: Delisting Unused Currency Types
Delist the unused currency types in the Currency Exchange rates screen and avoid scrolling through the long list of stored Currency Types in the system.
.gif)
Read more...
Now, you can manage the display of currency types in the currency exchange rates screen. Previously, all the unused currency types were displayed while defining the exchange rates in the currency exchange rates screen. So, with this option you can hide the currency types you no longer wish to use it. The List in Exchange Rates option is available in the Currency type tab.
Business Value:
This feature limits the display of currency types on the Exchange Rates screen, thus making it easy for the users to choose the required currency type instead of long scrolling. It also helps in organizing the display of data on the screen.
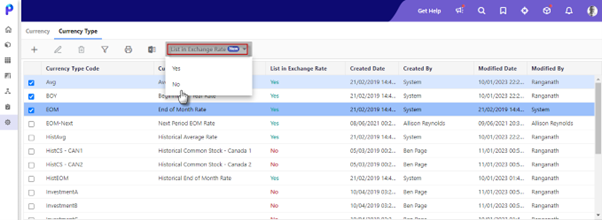
In Practice: How to Delist Currency Types
- Navigate to Maintenance > Multi-Currency > Currency Setup > Currency Type tab.
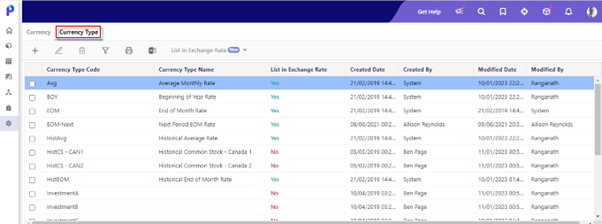
- Select the Currency types you want to delist.
- Click List in Exchange Rate option in the menu bar.
- Select No from the drop-down list.
Consolidation: Standard Journal Async Processing
Now, you need not wait on the screen while multiple Standard Journals are being processed. The journal processing has been upgraded to provide an effortless experience, and you will be notified once the processing is complete.
Read more...
With this release, you no longer have to wait on the Standard Journals screen while multiple standard journals are under the posting process. Previously, while a user was processing multiple standard journals, they had to wait on the screen until the posting process was complete. Now, when a user starts the post process for journals, an async task gets triggered in the background and the user is notified once the process is complete.
Predict: Revamped Admin Screen
Predict admin screen turns more intuitive with a unified configuration page. A General Settings pane has been introduced to configure common settings for Signals and Projections.
Read more...
With this release, the revamped admin screen allows you to perform all Predict administrative configurations from a single page. A General Settings pane has been introduced to the admin screen, enabling you to configure common settings for both Signals and Projections.
.png)
In Practice: Enabling Predict Signals
To enable Predict Signals, do the following:
- Go to Maintenance > Admin > Configuration Tasks > Planful: Predict.
.png)
The Planful: Predict configuration page is displayed.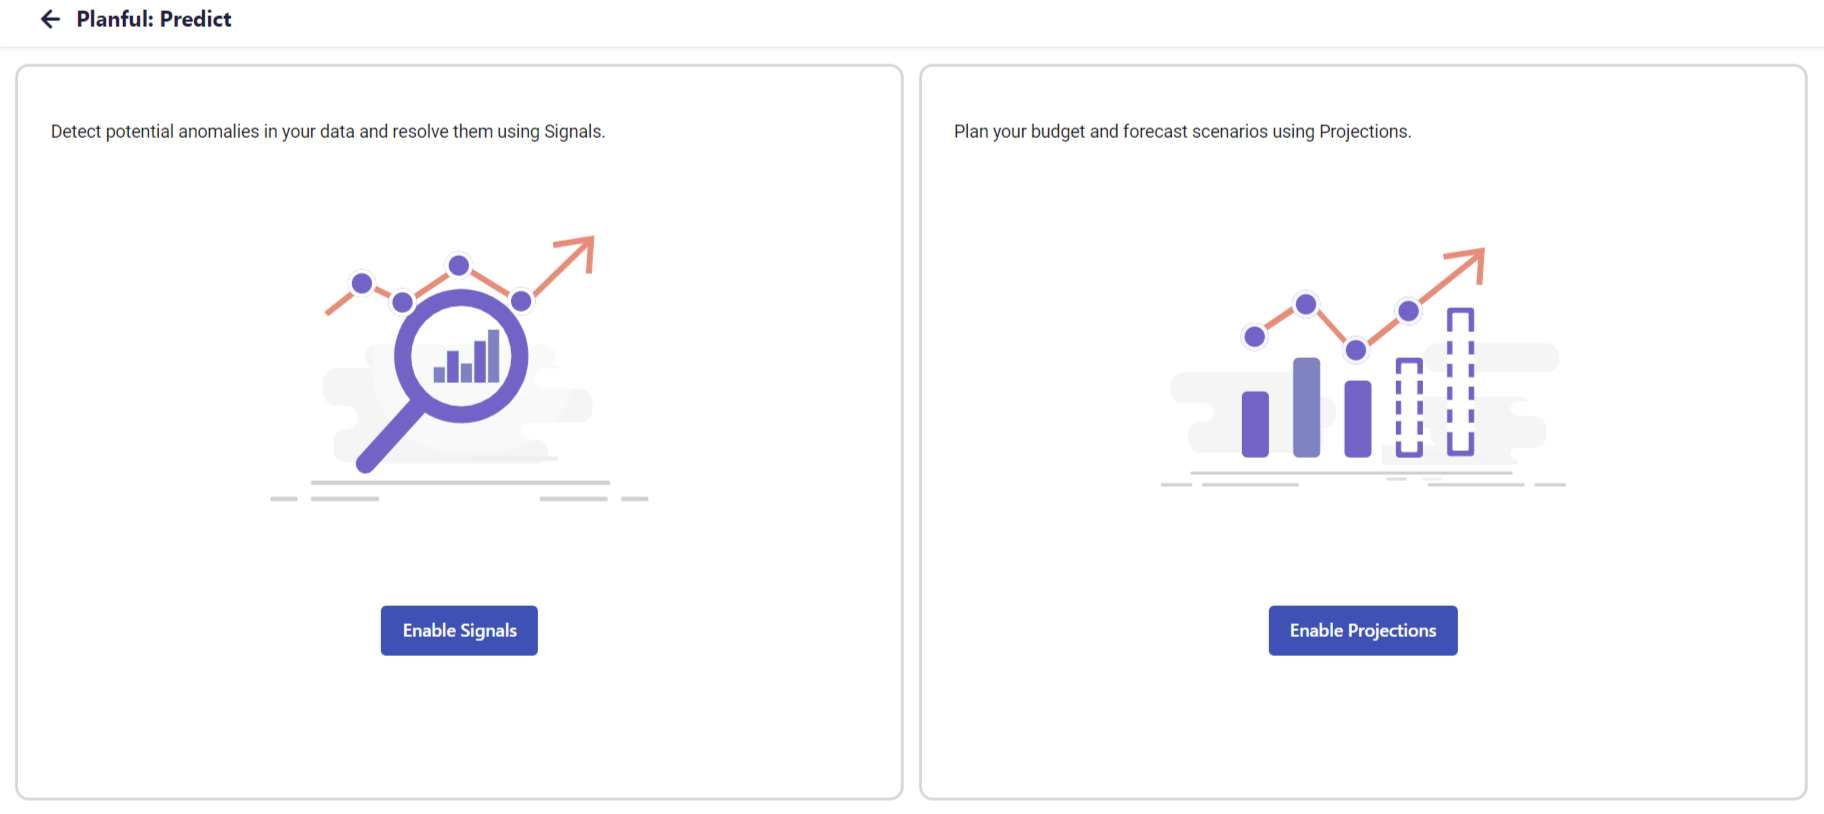 Note:Only new users will be directed to this page while configuring Predict Signals.
 - Click Enable Signals.
- Enter the passcode in the given text box and click Verify.
The configuration page is displayed.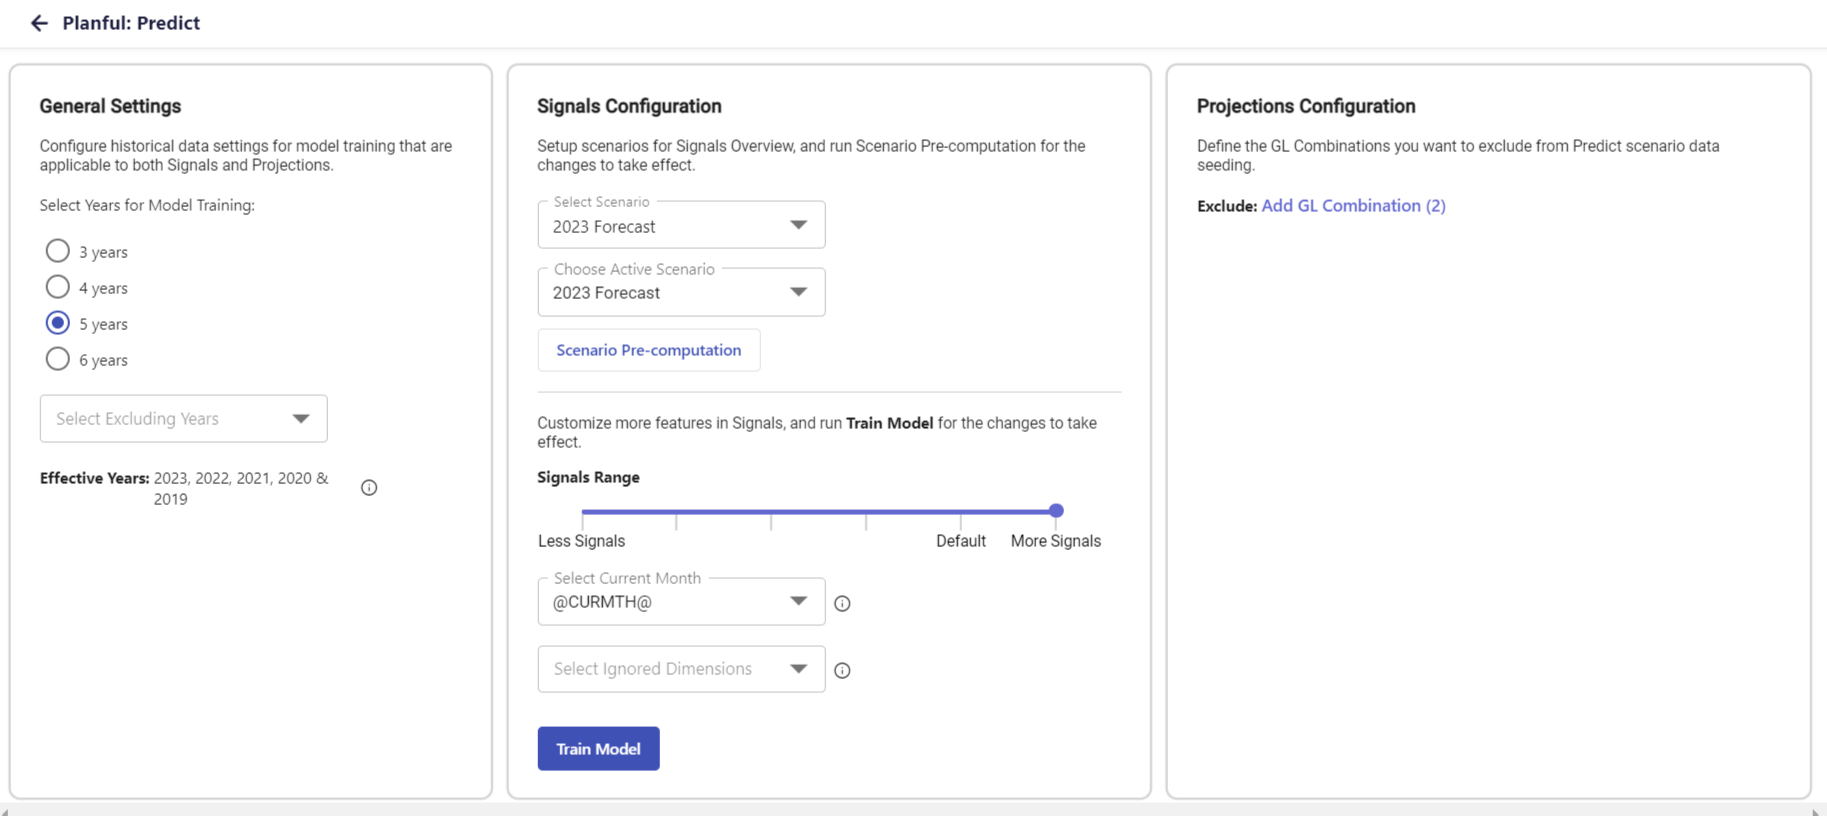 Note:The existing users can manage the Signals configurations on this page.
 - Select the years from the General Settings pane.Note:You can now select the years that will be excluded from Model Training. You need at least 3 years of historical data for Signals and Projections.
- In the Signals Configuration pane, select the Scenario(s) for Pre-computation and choose the Active Scenario from the respective fields to generate the Signals Overview Report.
- Click Scenario Pre-computation.
- You can choose to adjust the Signals Range and the Current Month as per your requirement from the respective fields.Note:The current Calendar month will be considered as the value of the System Default option. Using the drop-down menu, you can select 3 months before and after the current month.
- You can also select the dimensions you want to ignore.Note:You can ignore a maximum of two dimensions.
- Once you have configured the required fields, click Train Model.
In Practice: Enabling Predict Projections
To enable Predict Projections, do the following:
- Go to Maintenance > Admin > Configuration Tasks > Planful: Predict.
The Planful: Predict configuration page is displayed.Note:Only new users will be directed to this page while configuring Predict Projections. - Click Enable Projections checkbox.
- Enter the passcode in the given text box and click Verify.
The configuration page is displayed.Note:The existing users can manage the Projections configurations on this page. - In the Projections Configuration pane, click the Add GL Combinations link to exclude unwanted GL combinations.
The Add GL Combinations screen appears.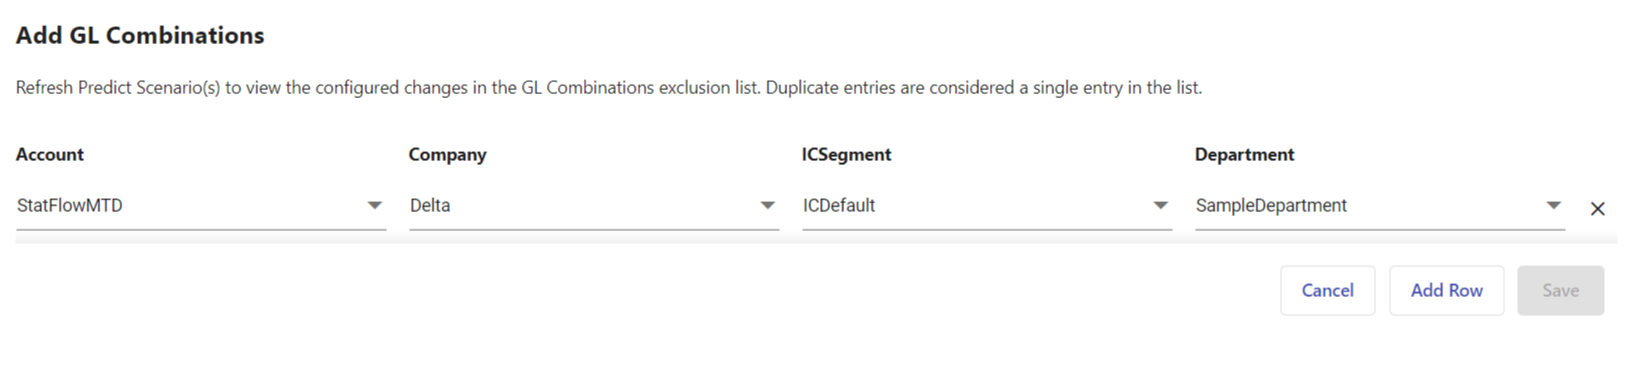
- Select the dimension members from the respective fields, and click Save.Note:You can add a maximum of 10 rows to the list.
- To reflect the configured GL combinations in the Signals Overview Report, click Train Model.
Was this article helpful?