- 10 Minutes to read
- Print
- DarkLight
- PDF
22.3 Release Notes
- 10 Minutes to read
- Print
- DarkLight
- PDF
Structured Planning: Enhancement to Employee Allocation Method
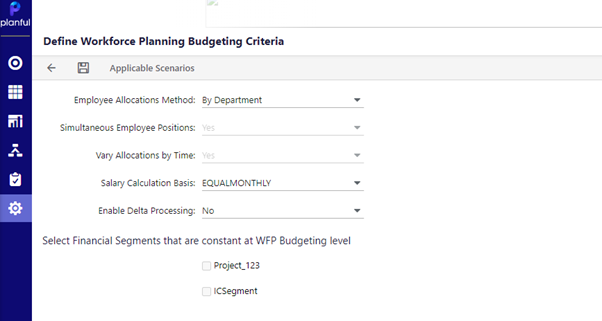
With this release, in the configuration tasks Define Workforce Planning Budgeting Criteria screen, you will see By Department set as the default option for the Employee Allocation Method drop-down. This update has been introduced for new tenants who do not have Workforce planning configured in their systems.
Structured Planning: Clear Data
With this release, as a Workforce admin user, you will have the ability to Preview, Export, and Delete workforce actuals data based on Employee and Position. This will provide you the ability to preview multiple employees and delete and reload the wrong actual amounts loaded into the system.
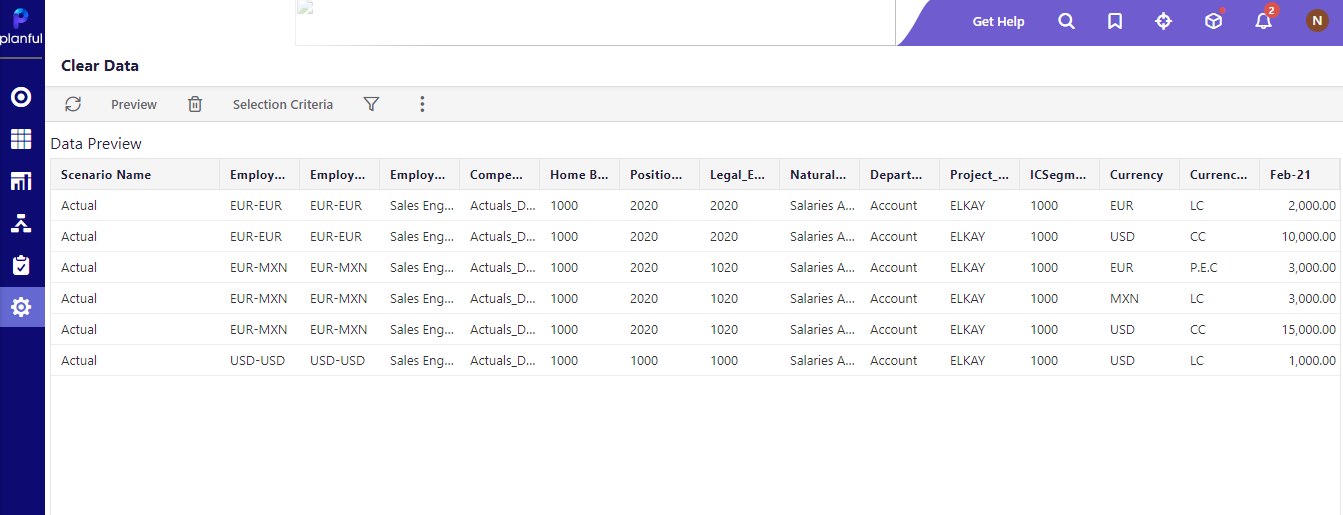
The Preview option allows you to view the details of actuals data of employees such as Scenario Name, Employee Number, Employee Name, Employee Position Description, Home Budget Entity, Position Budget Entity, Account, other finance segments, Currency(LC), and loaded amounts for selected time periods. Once the selection is complete, you can click Delete, and a job will be scheduled. The Export to CSV option allows you to export all the data for a selected employee and positions. You can select the employee and positions and click Export to CSV to submit a request to export data. You can view the export status in the Job Manager. You will also receive a message containing links to download the exported file. The data is exported as a ZIP file. You can extract the ZIP file to see the exported data.
Business value
This change will give the flexibility of deleting the amounts for a specified Entity and for a set of employees or positions, which saves time involved in selecting multiple finance segments. This change also helps users to know the impact of the deletion.
In Practice: To preview for specified employee and position
- Navigate to Maintenance > Data Load Rules.
- Click Clear Data. The Clear Data screen is displayed.
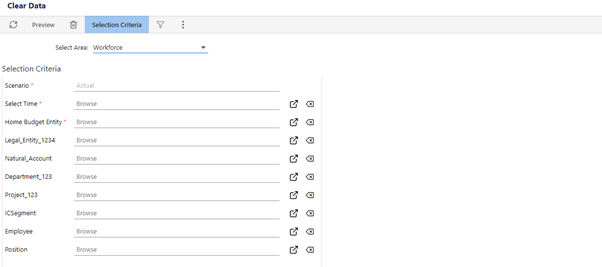
- Select Area as Workforce from the drop-down list.
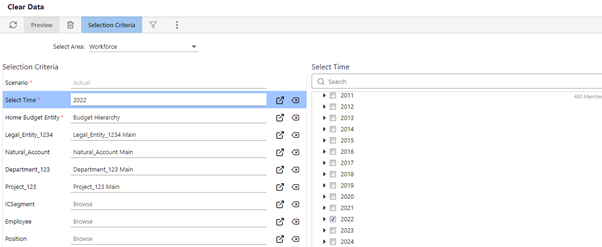
- In the Selection Criteria, the Scenario is set to Actual by default.
- Select time from the Select Time drop-down menu. You can select multiple time periods.
- Select an entity from the Home Budget entity drop-down menu. You can select multiple entities.
- Select an employee from the Employee drop-down menu. You can select multiple employees.
- Select an employee position from the Position drop-down menu. You can select multiple employee positions.
- Click Preview.
In Practice: To delete data using the specified employee and position
- Navigate to** Maintenance** > Data Load Rules.
- Click Clear Data. The Clear Data screen is displayed.
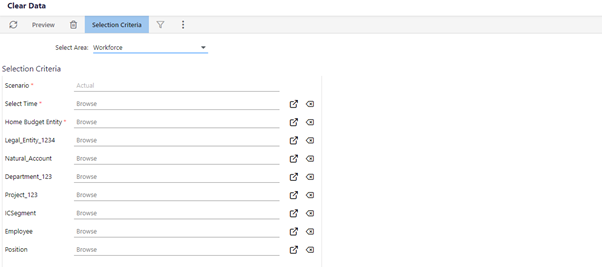
- Select Area as Workforce from the drop-down list.
- In the Selection Criteria, the Scenario is set to Actual by default.
- Select time from the Select Time drop-down menu. You can select multiple time periods.
- Select an entity from the Home Budget entity drop-down menu. You can select multiple entities.
- Select an employee from the Employee drop-down menu. You can select multiple employees.
- Select an employee position from the Position drop-down menu. You can select multiple employee positions.
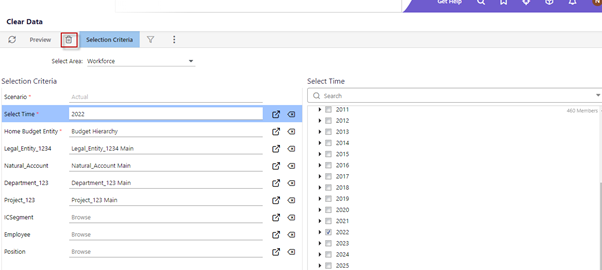
- Click the Delete icon. The data for the selected combination will be deleted.
In Practice: To export data using the specified employee and position
- Navigate to Maintenance > Data Load Rules.
- Click Clear Data. The Clear Data screen is displayed.
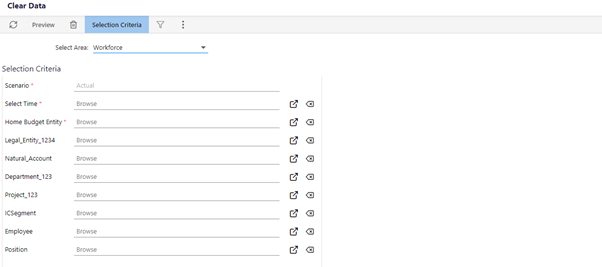
- Select Area as Workforce from the drop-down list.
- In the Selection Criteria, the Scenario is set to Actual by default.
- Select time from the Select Time drop-down menu. You can select multiple time periods.
- Select an entity from the Home Budget entity drop-down menu. You can select multiple entities.
- Select an employee from the Employee drop-down menu. You can select multiple employees.
- Select an employee position from the Position drop-down menu. You can select multiple employee positions.
- Click Export to CSV. A message is displayed confirming the submission of the export request.

- A message is displayed once the file is exported.
- Click the download link in the confirmation message to download the zip file containing the data.
- Click the other link in the confirmation message to view the status in the Job Manager.
Dynamic Planning: Variable Management
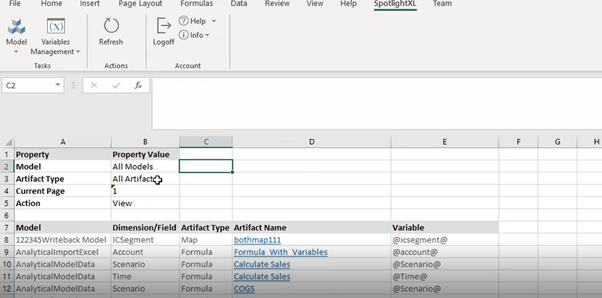
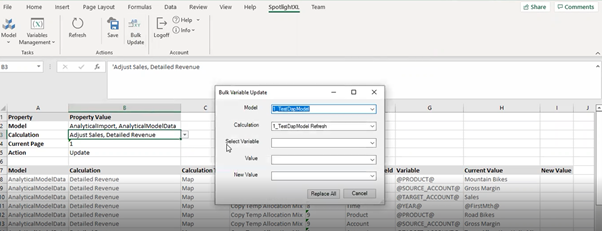
With this Release, a Variable Management screen has been introduced to view and update multiple variables across multiple models. In the variable management screen, you can view and update Variables. In the Variable Management Landing screen, which is also the view screen, you can view all the variables defined in the application across different artifacts. You can navigate to specific artifacts by using the hyperlinks. You can view and update variables based on model and calculation combination in the update variable screen. You can update variables for one or more models on one or more calculations at a time.
You can either update each variable by adding the new value or perform a Bulk Variable update across one model for multiple calculations. You will have the ability to choose dimension member/substitution variables. The variable list will be generated based on the model and calculations selected. You can select a new value for the selected variable from the drop-down list. You cannot perform bulk operations on a variable that does not have any value assigned to it.
Variable Management screens would be accessible to all the power users,and contributors can view or update the variables from only those models that they can access.
If all the models and calculations are selected in the View screen, you might face some performance delay.
In Practice: To view variables in the Variable Management Screen
- Open SpotlightXL, go to your profile, and click Manage Your Account.
- Select Subtask and scroll down to select Model Administration.
- Select Variable Management in the Model Administration drop-down list.
- In the Variable Management screen, the default value for the Action drop-down list is View. You can view all the variables on this screen.
In Practice: To update variables in the Variable Management Screen
- Open SpotlightXL, go to your profile, and click Manage Your Account.
- Select Subtask and scroll down to select Model Administration.
- Select Variable Management in the Model Administration drop-down list.
- Select a Model from the drop-down list.
- Select a Calculation from the drop-down list.
- Select a New value from the drop-down list to update variables individually.

- Or Select the Bulk Update option from Actions in the toolbar to add a new value for selected variables across multiple calculations for a model.
To view Audit Log:
- Select Task > Manage > Subtask > Application Administration > Audit Log
The power users can see the audit log for the below user activities:
- Users navigating to variable management landing page (view)
- Users updating the variable value individually
- Users updating the variable values via bulk update
- Variable update failure
Dynamic Planning: ESM Filters
With this release, you can filter data with ESM filters in the application. Previously, there was no filtering ability to analyze, edit or delete any data.
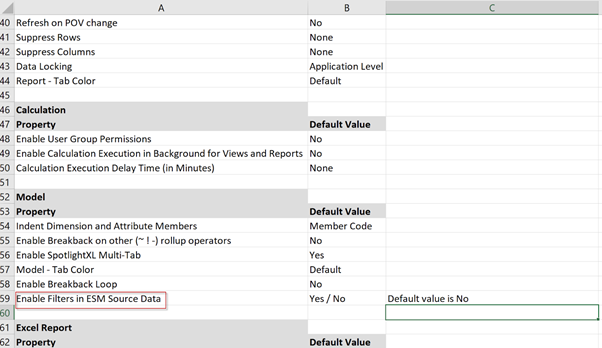
You must set the 'Enable Filters in ESM Source Data' to yes to filter data.
When you enable the flag, you can see the 'Include in Filters' column in the source Model screen. To provide value for the filter, you can either copy-paste or type the value. Also, you can only enable the Include in filters column for a maximum of 5 fields.
You can filter ESM data only based on Text and Date fields.
Business Value
It significantly reduces the time and effort previously involved to update and delete required data instead of going through the entire list of data.
In Practice: Enabling the Filter Flag
- In SpotlightXL, select the Manage screen.
- In the Application settings drop-down, select Application Administration and then click on Application Settings.
- Scroll down to enable the 'Enable Filters in ESM Source Data' flag. The value for this flag is set to ‘No’ by default.
In Practice: Filtering data in Source Data load
- Select the Model task, and from the Source Model drop-down, select Source Model.
- Define Source Model Name in the Source Model page.
- Define Field and type in the Source Model page and click Save.
- You will see the 'Include in Filters' column available.
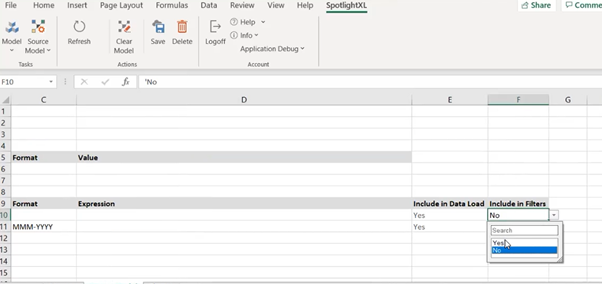
- You can set this column value to ‘Yes’ for the specified fields.
In Practice: Loading data in the Model
- Select the Model task, and from the Source Model drop-down, select Source Data.
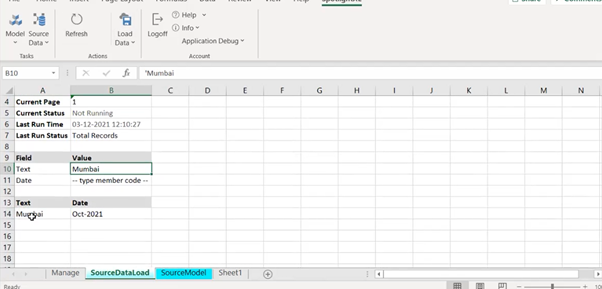
- You can either copy-paste the values or enter them manually to load the data.
- For the Filter field, specify the name of the field in the Source ESM to filter the data you want to load. Under the Value column, you can specify the value name.
- After you refresh the page, you will see the filtered data based on the specified field.
User Experience: Heads Up! Online Help in the Upcoming Release
Online help with improved navigation, fast and effective search, feedback mechanism, multiple versions, etc., will be available in the upcoming release. You must use the help.planful.com URL for accessing the online help. The existing online help URLs will no longer be available from the upcoming release, and you will need to update the existing bookmarks with the new ones. For example, the existing URL- https://help.hostanalytics.com will change to https://help.planful.com.
Platform: Update to Get Data Load Status API
Now, the users can view updated status codes once the API is invoked. The updated response code against the old codes are as follows:
| Old Response | New Response |
|---|---|
| Cancelled | > Aborted |
| Duplicate | > Aborted |
| Aborted | > Aborted |
| Discarded | > Aborted |
| Failed | >Failed |
| CompletedWithErrors | > Failed |
| None | > NotStarted |
| Scheduled | > NotStarted |
| Queued | > NotStarted |
| WaitingForExecution | > NotStarted |
| Running | > Running |
| KillRequested | > Running |
| Success | > Success |
Platform: Update to Transfer Data API
The request of the Transfer data API is updated and a parameter is added in the request parameters. Now, you can provide a call back URL in the first request is the Transfer Data API. You can add the response you got from Get Data Load Status API as body in the call back. It is the clients responsibility to provide a working URL that accepts the PUT/POST calls that is accessible over internet to Planful system.
This parameter is not mandatory.
Updated Request:
{
    "DataLoadRuleConfig": {
      "dataLoadRuleId": {DataLoadId},
      "dataLoadRuleName": "{DataLoadRuleName}",
      "columnDelimiter": "{ColumnDelimiter}",
      "callbackOptions":{
          "httpMethod": "POST",
          "url": "{Client call back URL}"
  	}
	},
    "payload": "{Payload String}"
Platform: Enhanced the Export Icon
With this release, you will see intuitive icons on the following pages:
- Replaced the previous Export icon with the Excel icon in the Attributes Usage Report pop-up of the Cube Settings page.

Previously, the Export icon used to look like the following illustration.

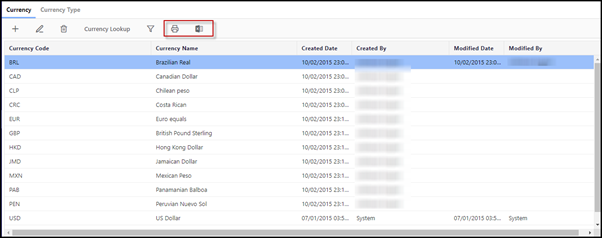
- Replaced the previous Export icon with the Excel icon and a Print icon in the toolbars throughout the Currency Setup page.
Platform: Enhanced the User Management page
With this release, we have further enhanced the look and feel of the User Management page under Maintenance > Administration > User & Role Management. The following are the changes you will be able to see on this screen.
- Previously, the default option in the Date Picker was** Equal**, which has now been changed to Greater Than or Equal.
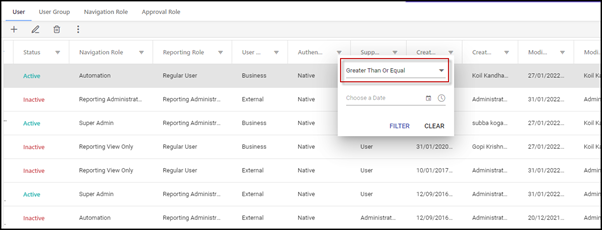
- Removed the time from all Date columns except for the Expiry Date column.
These changes are applicable to the exported Users list as well.
Predict: Introduced Predict Projections (Preview)
We are releasing this feature for Preview only! It will be available in the Sandbox environment. We suggest that you test this feature and familiarize yourself with the functionality.
We have introduced the Predict Projections feature. Predict Projections helps plan your budget/forecast scenarios in a data-driven approach as part of Structured Planning. Predict Projections generates future projections using Planful’s proprietary AI/ML algorithms through the Predict Projections AI engine.
The Projection's AI engine processes historical data from actual scenarios present in the system to understand the trend, seasonality, and statistical properties embedded in them by amalgamating standard AI Algorithms and Planful’s proprietary algorithms and techniques. It is built using a Human-in-the-loop (HITL) design that can take your annual budget as input and distribute the amount across the months of a fiscal year while adhering to the time-series properties found in the data by the AI engine.
For more information about Predict Projections, refer to Predict Projections Guide.
Predict: Added Support for Signals in Dynamic Reports using Dimension Attributes
With this release, you can generate and view Signals for Dynamic Reports that use Dimension Attributes and Attribute Hierarchies.
The hard and soft limits set for Signal generation on Dynamic Reports also apply to Dimension Attributes based Reports.
Predict: Enhanced the Support for Signals in Dynamic Reports for Consolidation Report
With this release, you can view the signals on Actuals for the Consolidation Report with Report Sets, Attributes & Attribute Hierarchies, and Alternate Hierarchies.
If you have selected Actuals and Budget or Forecast scenarios together or only the Actuals Scenario, the Signals will be shown on the Actuals data and not on the Budget or Forecast data.
Predict: Enhanced Signals Overview
We have now added the Reporting dimension filter to the Signals Overview. You can use this filter to select the available and applicable currencies such as LC, CC, etc.
By default, the selection will be set to G/L Data (CC).
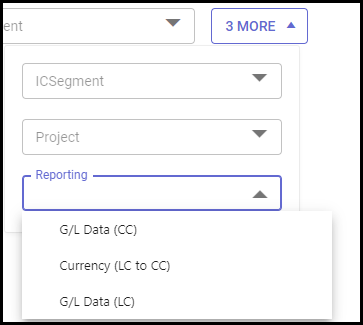
If you select higher-level roll-ups such as Company Main, you should ideally select CC to compare the dollar impacts of the Signals. However, if you select LC, the dollar impact will not be comparable.
In cases where LC is not configured, the default reporting behavior of LC = CC will apply.

