22.5 Release Notes
- 9 Minutes to read
- Print
- DarkLight
- PDF
22.5 Release Notes
- 9 Minutes to read
- Print
- DarkLight
- PDF
Article summary
Did you find this summary helpful?
Thank you for your feedback
Structured Planning: Clear Data-Currency types Updated
With this release, we have introduced a currency type in the Clear Data screen. Previously we only had Local Currency as a currency type mapped against the employees, which has now been updated to the Currency field. As an admin user you will now be able to view Local currency, Common currency, and Position Entity currency type against the employees. You can also see an ‘Amount in’ column in the Clear Data preview screen, that will display currency names mapped against the employees.
If the Local Currency and Common Currency are the same for an employee, then the duplicate row will not be displayed in the clear data preview screen.
Structured Planning: Dynamic Commentary in Planning Templates
With this release, we have introduced a Dynamic commentary feature in planning templates. This enables you to post and view comments in planning templates and reports. We have enabled this feature in the GTSC, GTEC, Line Item, andAllocation template types.
You can perform the following with this feature:
- Add cell-level comments
- Edit, Delete, Highlight, Reply or Resolve comments
- Add text, #tags, and hyperlinks in the comments
- Assign tasks and track their status from Task Manager
- Mark Task as Complete in the Comment(s) pane
- View all comments in the application and perform actions such as Delete and Highlight
- All posted comments and associated actions can also be seen in Comments Manager
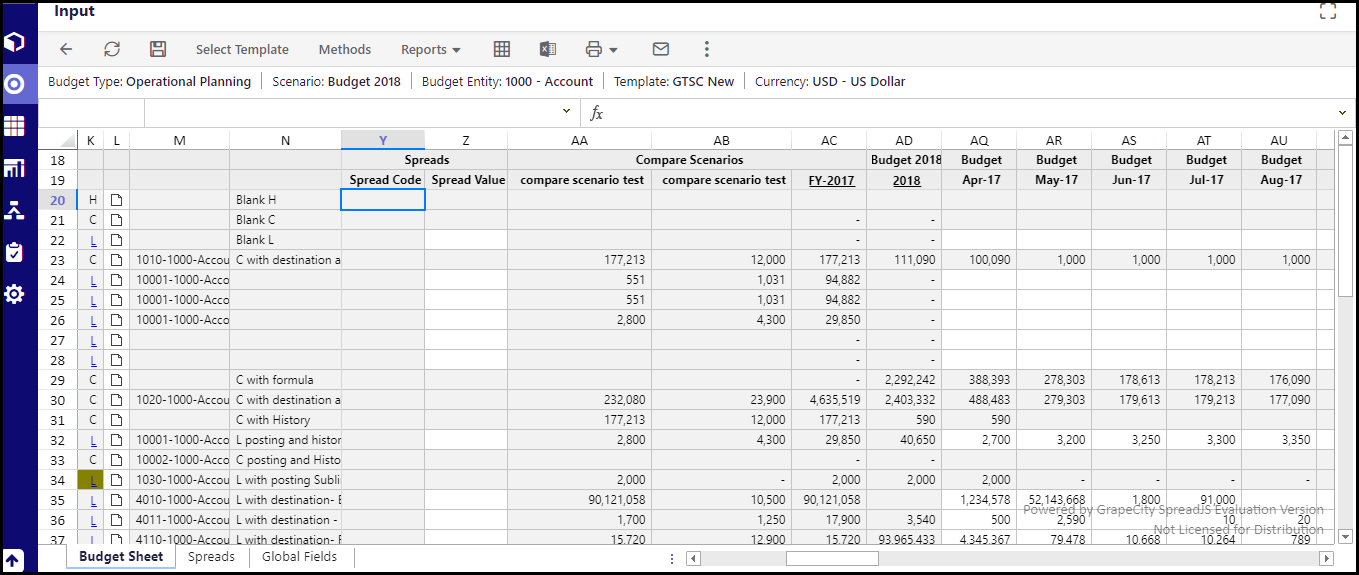
Comments are currently available only for open periods for below line types:
- RC
- L with posting (with or without sublines)
- L with posting and history accounts (with or without sublines)
- C with posting
- C with posting and history accounts
- RA with single account mapping
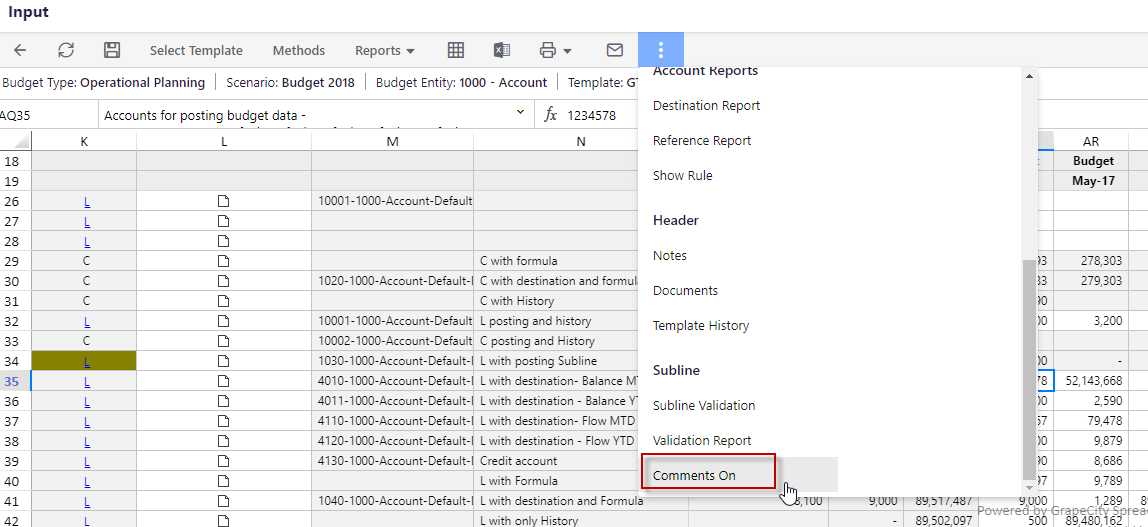
When you log in to the application, you must enable the Dynamic comment feature in the menu drop-down.
Business Value
This feature facilitates user collaboration over different tasks. In addition, the ability to access and review/update templates in a single place will save time and extra effort involved.
In Practice: To Post a Comment
- Click on the More drop-down menu in the toolbar and select the Comments On option.
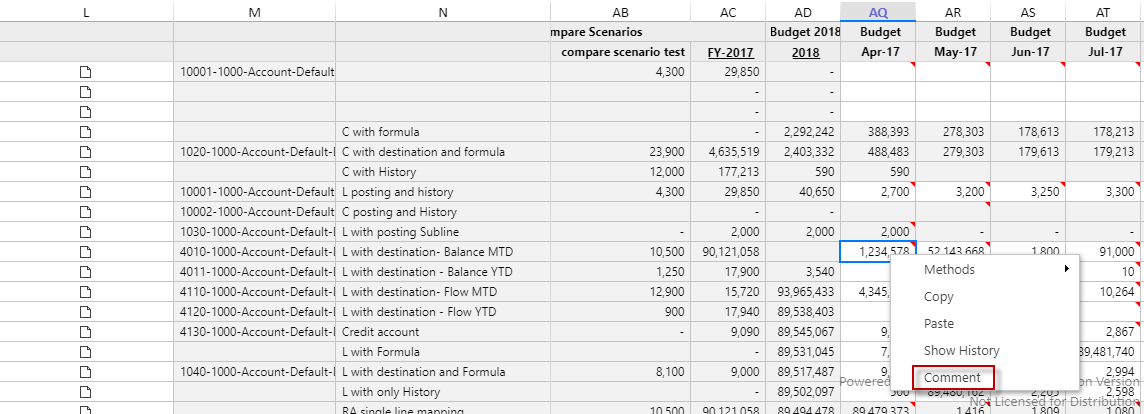
- Select the required cell and click Comments. The Comment(s) pane is displayed.
- Enter the required text and click Comment. The comment is saved and displayed in the Comment(s) pane.
You can view an indicator wherever a comment is posted for a line type.
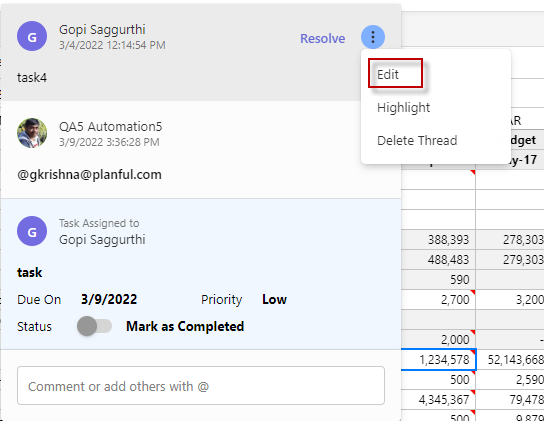
In Practice: To Edit a Comment
- Click the More icon on the right-hand side of the Comments pop-up window and select Edit from the menu list.
- Make the required changes and click Save.
Note
You can edit the comments posted by you or any user.
In Practice: To Highlight a Comment
- Click the More icon on the right-hand side of the Comments pop-up window and select Highlight from the menu list.
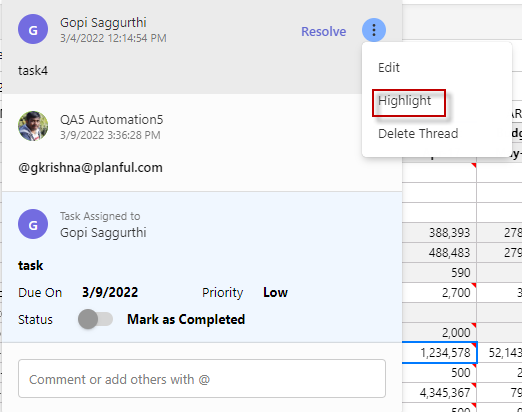
You can highlight comment(s) posted by you or any other user.
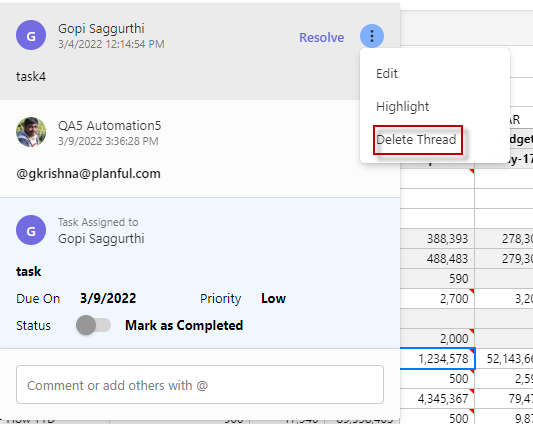
In Practice: To Delete a Comment
- Click the More icon on the right-hand side of the Comments pop-up window and select Delete Comment from the menu list. A confirmation message appears.
- Click Confirm to delete.
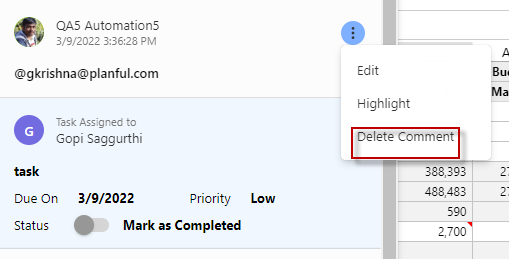
- You can only delete the comments posted by you or any other user.
- If you delete the first comment in a thread, all the subsequent comments on the thread are automatically deleted.
In Practice: To Resolve a Comment
- You can resolve a comment thread by clicking the Resolve option in the first comment of the thread.
Once you resolve a comment, the visual indicator is not displayed on the cells.
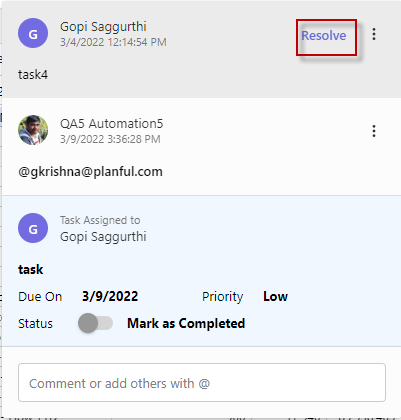
Note
If you resolve the first comment on a comment thread all the associated comments are resolved automatically.
In Practice: To Assign a task
- Right-click in the required cell and select Comment. The pop-up window appears.
- Enter + and type the user name.
- Select Assign.
- Add task title
- Due On - Select the required to date.
- Priority - Select any of the following:
* Low
* Medium
* High - Click Comment. A notification is sent to the mentioned user.
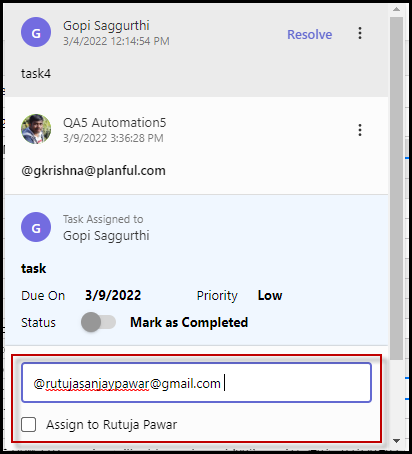
The assignees and admin will have access to the assigned tasks. You can view the task details from the Task Manager. You can change the Status of any of your assigned tasks or mark them as Completed directly from the Comments pop-up window. Once you mark a task as completed, the status will be updated on the Task Manager page.
Note
Comments posted/added for year and quarters in time sets are updated as months.
Dynamic Planning: Report Collection
With this release, we have introduced the Report Collections feature for the Spotlight and Excel Reports. You can schedule or send multiple reports as an email attachment to specific users or user groups. Reports in the Report Collection will be generated and distributed in Excel format.
Now, you will be able to schedule and distribute reports to end-users regularly without putting in hours of manual work.
Notes
For a user to add, edit, or view a report in reports collection, the following conditions should be satisfied:
- The tenant should be unified. For more details, please see Unified Tenant.
- The Enable Report Distribution Flag should be set to Yes. Please contact Planful Support to enable the flag.
- The user should be a Power User.
Business Value
Currently, report distribution by the Power users is done manually, which is both time-consuming and also prone to errors. To eliminate this and ramp up report distribution to end-users, we have automated the process. With a report scheduler, you will now have the ease of report distribution daily, weekly, or monthly depending on the date, time, and time zones to specific user/ user groups. In addition, with this enhancement, end-users will now be able to access the latest report data via Excel output.
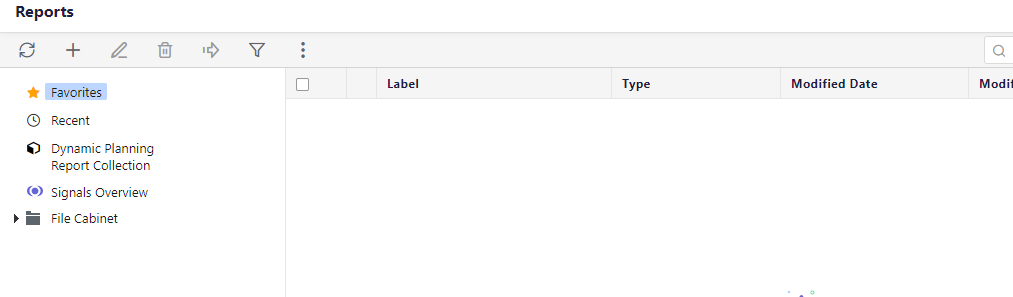
Dynamic Planning Report Collections feature would be available as part of the Reports screen.
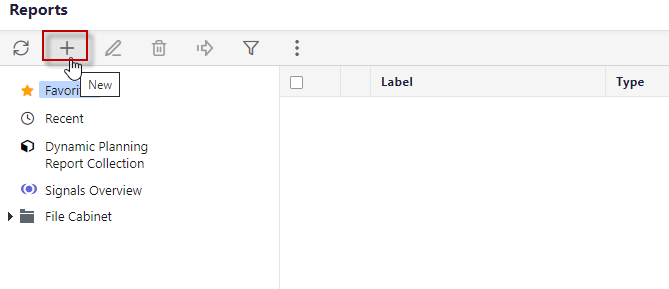
In Practice: To Create Report Collections
- Select Report Collection from the Add icon in the File Cabinet or Select Dynamic Planning Report Collection options displayed just above the File Cabinet in the side menu.
In Practice: To Identify report collection on the General Information page
- On the Report Collection General Information page, enter information to identify your Report Collection (Code and Name).
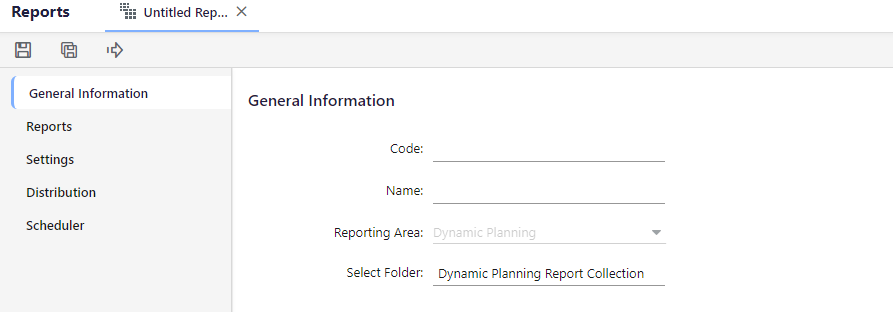
- Select Financial, Sales, or Dynamic Planning from the Reporting Area drop-down. Reporting areas must be configured and applicable to be displayed.
- Dynamic Planning Report Collection will automatically be selected for the Select Folder drop-down.
In Practice: To Select Reports
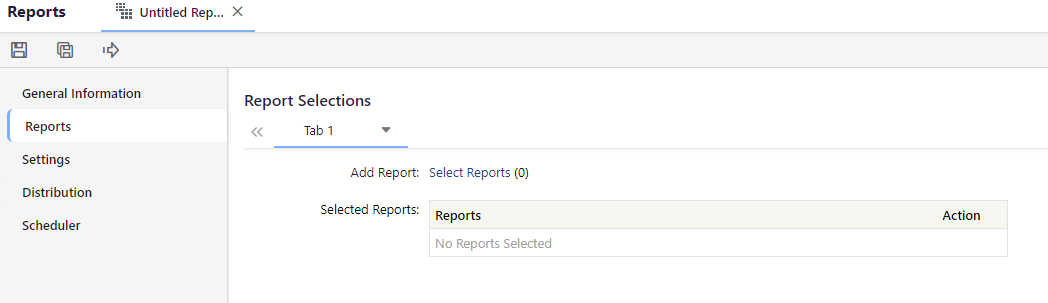
- Click Reports to open the Report Selections page.
- Click the Select Reports link to add reports to your Report Collection.
- Select the reports from the Select Dynamic Report pop-up window. You can select specific reports from the Spotlight or EBR reports.
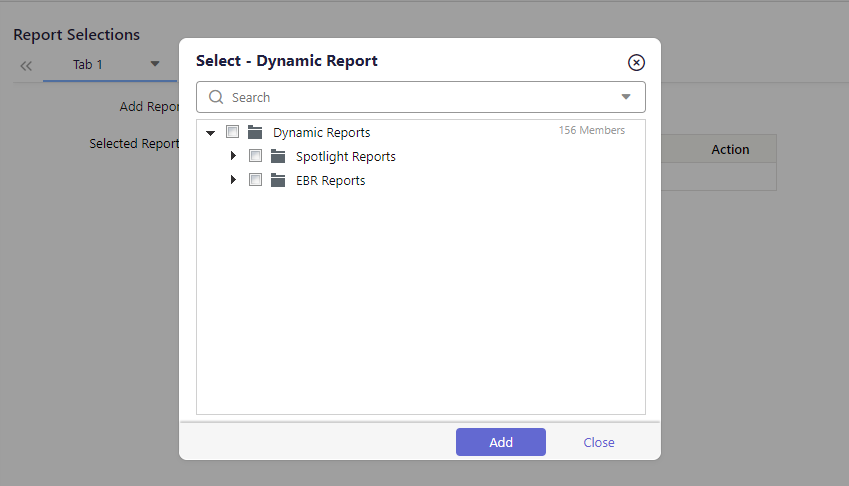
- Click Add to add all the selected reports to the Report Collection. Added reports are displayed in the Selected Reports pane.
- In the Action column, you can move the reports up or down or delete the reports you no longer wish to include in the Report Collection.
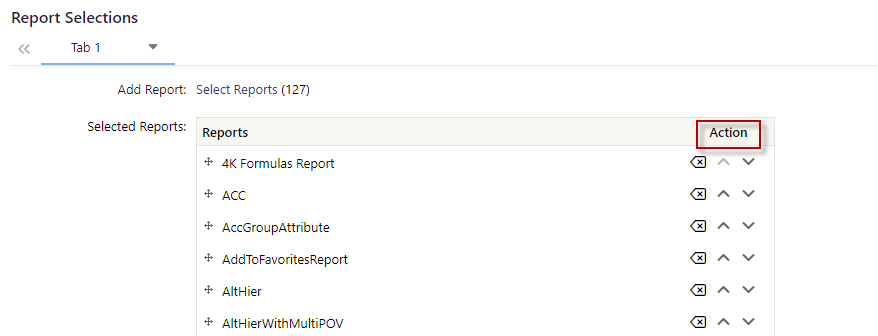
6. You can add a new tab to the Report Collection by selecting the Tab drop-down. This opens the list box where you can select Add, Duplicate, or Delete the current tab.
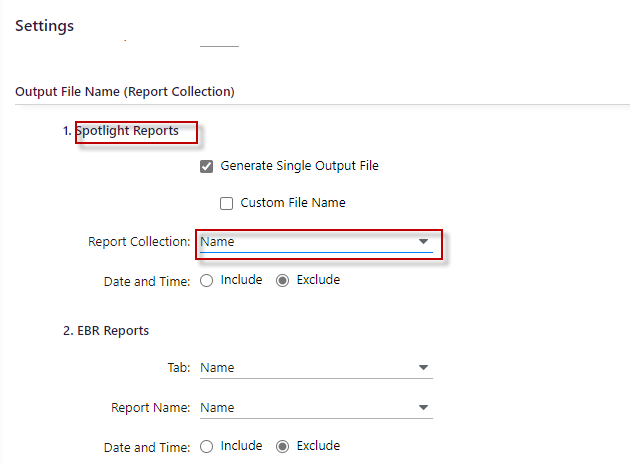
In Practice: To Generate Output file
- Click the Settings tab to select Report Collection output settings.
- Select an Output File Name (Excel) for both the Spotlight reports and EBR reports. Select Include to display the Date and Time in the exported report collection.
- Select Exclude to not display the Date and Time in the exported report collection
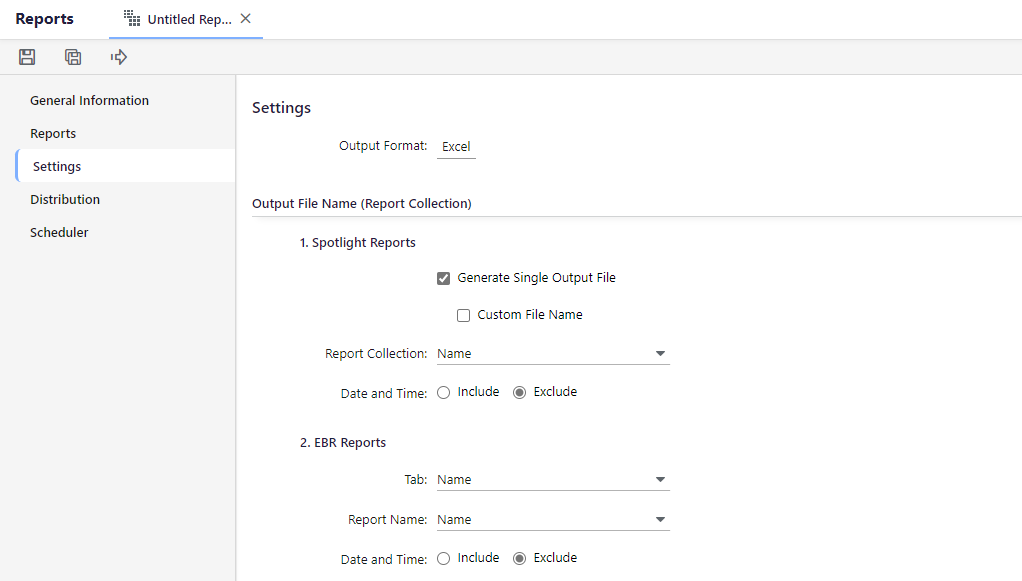
Spotlight Report: - Select the Generate Single Output File checkbox under Spotlight Reports to generate a single workbook with an individual sheet for each report in Excel. If None is selected, one output file is generated for each report.
- Select Custom File Name to enter a name for the report. If this option is not selected the default report name will be updated.
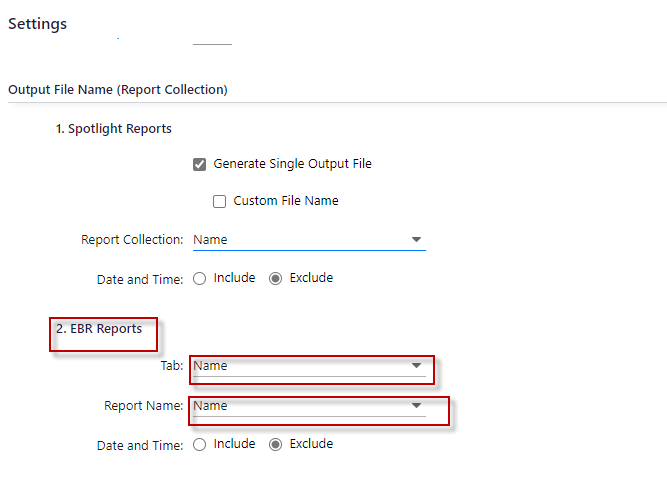
EBR Report: - Select Tab for EBR Report from the name drop-down list.
- Select Report Name from the name drop-down list.
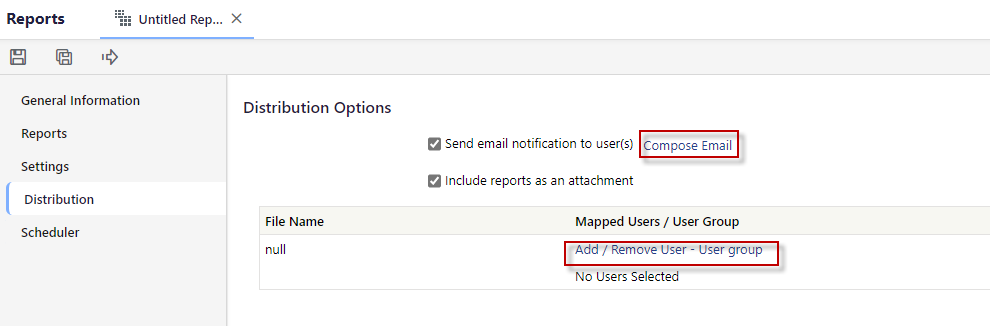
In Practice: To Distribute Report Collection
- Click Distribution Options to define Report Collection distribution preferences:
- Select Send e-mail notification to user(s) to send an email to selected users or user groups. Click Compose email link to create the email draft.
- Select Include reports as an attachment to attach generated Report Collection output to the email.
- Select report under File Name and Click Add/Remove User – User group to open a dialog page where you can identify Planful Users, Planful User Groups, and non-Planful Users (Other Users) to send the Report Collection with email or share the output file with the users/user groups selected.
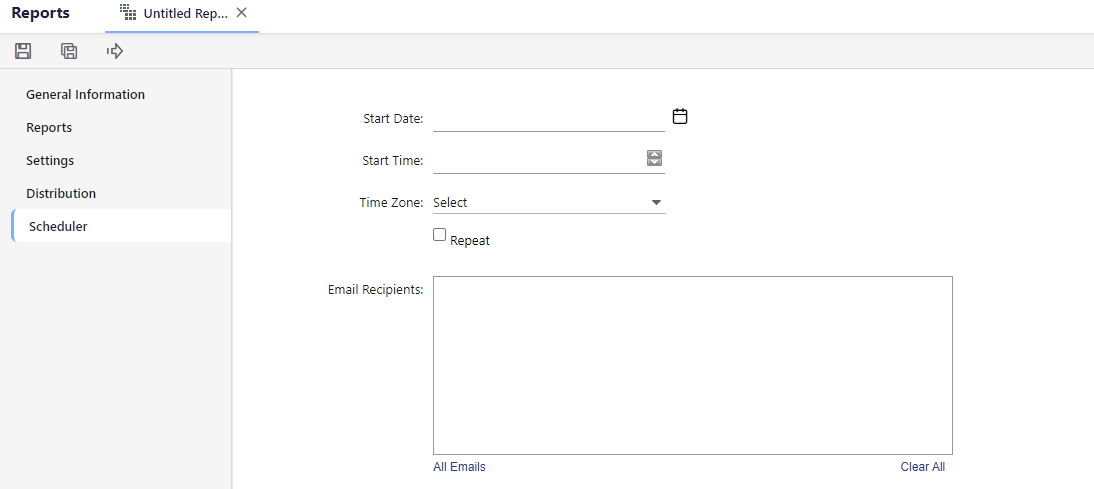
In Practice: To Schedule Report Distribution
- Select Start Date from the calendar pop-up.
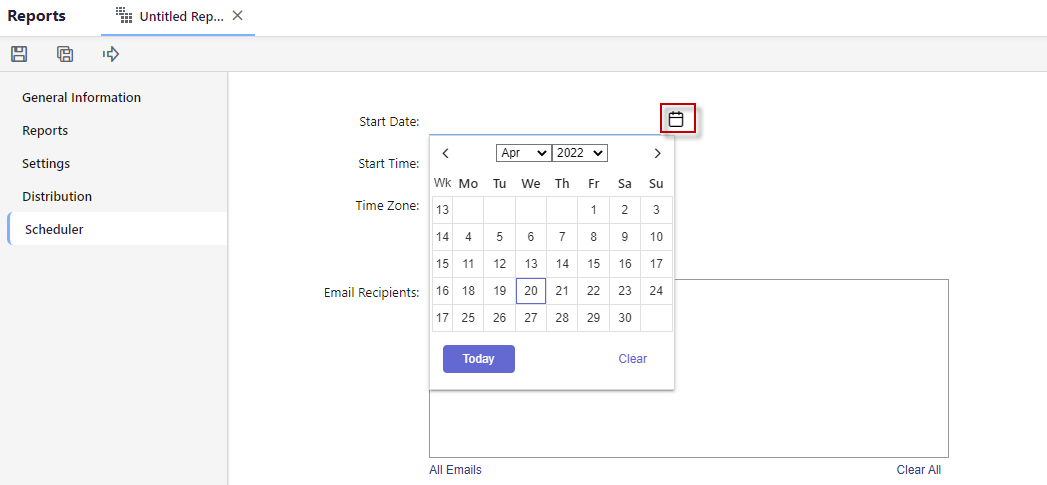
- Select Start Time from the Time drop-down list.
- Select Time Zone, and you can select the Repeat checkbox if you want to repeat the email schedule for the same date, time, and time zone.
- Select Repeats and Recurrence ends from the available options.
- In the Email Recipients text box, you can enter the email addresses of the users or user groups for whom you want to schedule the reports distribution
Predict: Introduced Predict Projections
We have introduced the Predict Projections feature. Predict Projections helps plan your budget/forecast scenarios in a data-driven approach as part of Structured Planning. Predict Projections generates future projections using Planful’s proprietary AI/ML algorithms through the Predict Projections AI engine. This helps you to quickly build accurate forecast and budget scenarios so that your planning cycles can start with a trusted baseline.
The Projection's AI engine processes historical data from actual scenarios present in the system to understand the trend, seasonality, and statistical properties embedded in them by amalgamating standard AI Algorithms and Planful’s proprietary algorithms and techniques. It is built using a Human-in-the-loop (HITL) design that can take your annual budget as input and distribute the amount across the months of a fiscal year while adhering to the time-series properties found in the data by the AI engine.
For more information about Predict Projections, refer to Predict Projections Guide.
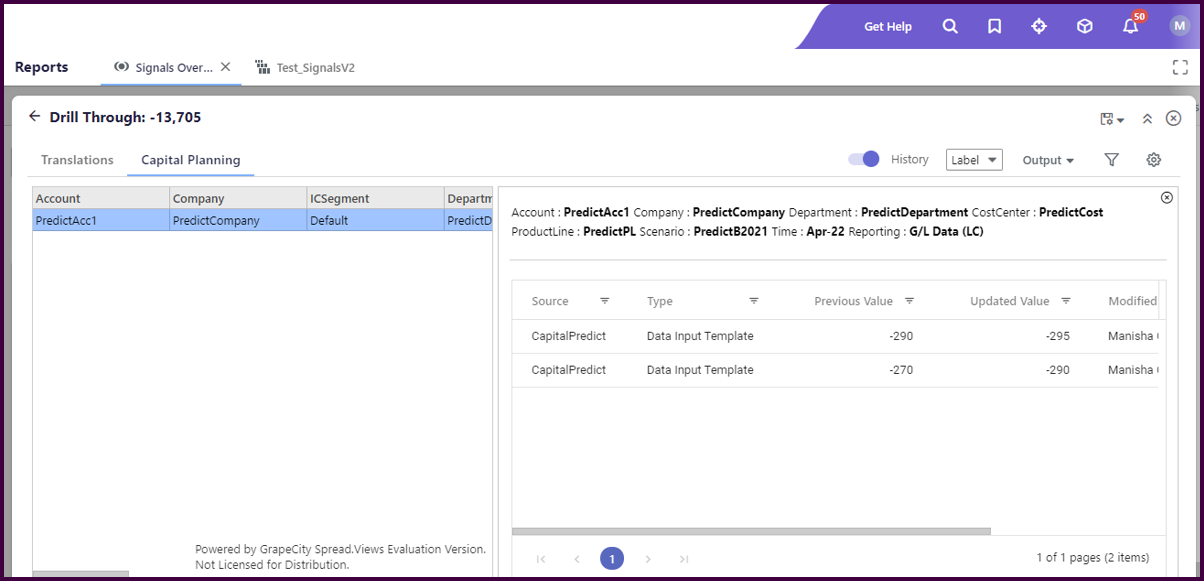
Predict: Added Support for Drill Through History in Predict Signals
In both Signals Overview and Signals in Dynamic Reports, you now have the ability to view the data change history of a selected record in the drill through window. You can view the history of the data changes on the source data available in Signals Overview and Signals in Dynamic Reports. You can toggle the History button on for any record from the template to view the history. The history contains information like dimension intersection details, who changed the data, the timestamp of the data change, and the details about the changes.
Business Value
This feature is introduced to verify the updates made to the source data in the templates. It provides information like who changed the data, the timestamp of the data change, and the details about the changes.
Platform: Introduction to Ivy
Ivy is available for all the customer applications provisioned after April 2022. In addition, Planful is incrementally rolling out Ivy for all the qualified existing customers in the upcoming months. If you want to know the status and eligibility requirements/recommendations, contact Planful Support or your Customer Success Manager.
Please refer to 22.4 Release Notes for more information about Ivy.
Was this article helpful?