- 71 Minutes to read
- Print
- DarkLight
- PDF
Dynamic Reports Options
- 71 Minutes to read
- Print
- DarkLight
- PDF
Intro to Dynamic Reports
Overview
Dynamic Reports is a reporting tool which provides easy-to-use, ad hoc query capabilities, as well as structured financial reports which utilize reusable report sets. Dynamic Reports use dimensional data and may use report sets and attributes to produce a specific output.
Composition of a Dynamic Report
Dynamic Reports have three components: page, row, and column.
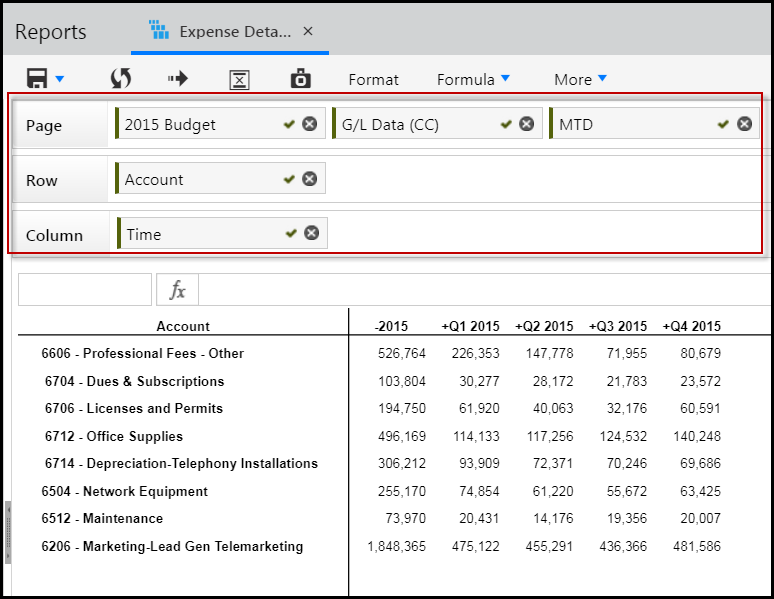
Dimensions, attributes, and report sets are defined for components by dragging and dropping them directly onto the component.
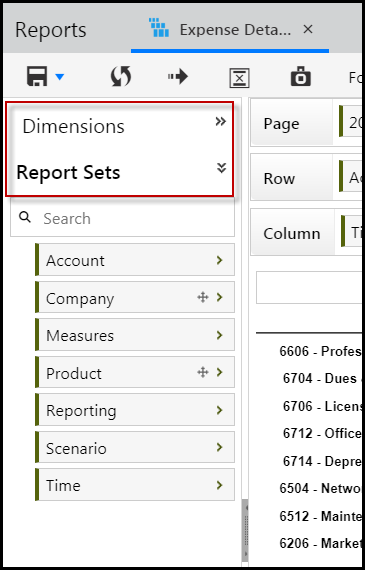
Components of a Dynamic Report
Dynamic Report Reporting Area
The first thing you will do when you add a Dynamic Report is to select a reporting area.
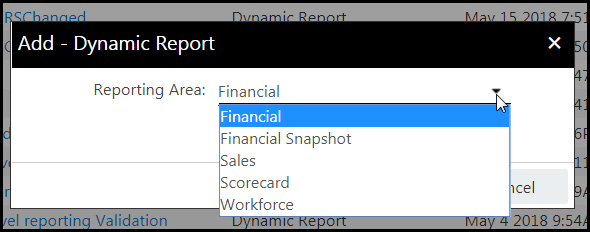
The Reporting Area represents the multidimensional cube upon which the report is built: financial, sales, workforce, or scorecard. Once you select a reporting area and click OK, the Dynamic Report page appears. Dimensions, attributes and report sets displayed are based on the reporting area selected. Report sets and dimensions do not appear when not applicable.
Page, Row, and Column Components
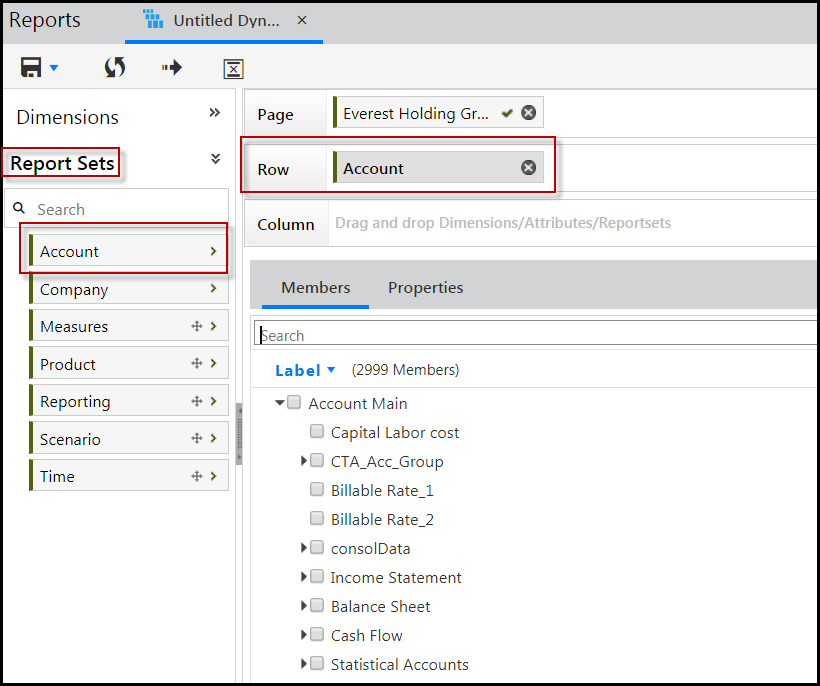
After you select the Reporting Area and click OK, the Dynamic Report interface is displayed. You'll build a Dynamic Report by dragging and dropping dimensions, attributes, and report sets (from the left hand pane) to the page, row, and column levels (in the top right of the page). Report sets can only be applied to row and column levels.
Page
Drag and drop dimensions at the Page level, which are applicable to the entire report. The Page axis is displayed in the report, when creating a report, when running a report, and when modifying an existing report.
Member labels are separated with a comma. When there are too many label names, an ellipsis appears.

You can reorder the labels by dragging and dropping them on the Mapped Members pane.
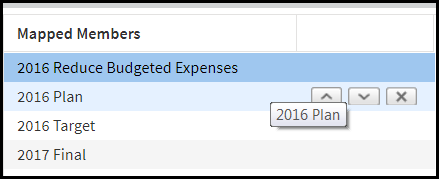
If you use the same dimension in multiple places on a page, column, or row using calculated members (MDX), the column axis is the highest priority followed by the row and lastly the page. In a typical situation where the same dimension is not used in multiple places, the page takes precedence, followed by the row and lastly the column.
Row
Drag and drop dimension(s) or report sets at the Row level, which will populate across the report horizontally based on the hierarchical structure. You can select multiple dimensions for the Row. The row axis does not contain object details like the page axis.
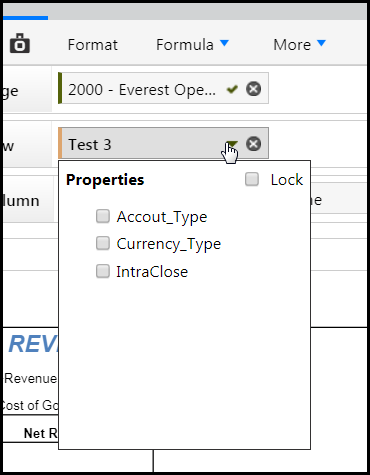
When a report set is on the row axis (also called a row set), you can open the report set directly from the Dynamic Report by clicking it. This eliminates the need to return to the File Cabinet to open the report set. Click the carrot icon to select and/or lock Report Set member properties as shown below.
Column
Drag and drop dimension(s) or report sets at the Column level, which will populate vertically based on the hierarchical structure. The column axis does not contain object details like the page axis.
When a report set is on the column axis (also called a column set), you can open the Report Set directly from the Dynamic Report by clicking it. This eliminates the need to return to the File Cabinet to open the Report Set. Click the carrot icon to select and/or lock report set member properties.
Using Report Sets on the Row or Column
As mentioned earlier, reports sets can only be used on the row or column axis of a Dynamic Report. You cannot use a report set on the Page axis. Therefore, drag and drop Report Sets to the row or column of your Dynamic Report.
Report Sets are created on a specific dimension and typically contain members of other dimensions. Report Sets contain the link from the report lines to the account segment hierarchies. These links are created using Rule formulas.
A list of all Standard Variables can be accessed from the File Cabinet by clicking the Report Sets folder. Open the Planful Default Report Sets folder and the Rule folder to view the Standard Variables list.
Report sets are applicable to a single axis only. Once report set row and column details are selected, click a selection to display the Member Selector. You can lock properties. The Lock icon indicates that there are locked properties.
Adding a Header and Footer to Your Dynamic Report
Once you've selected the data you want to display in your report, launch the Header and Footer ( ) pane where you select options as well as style, color, and format to display header and footer details in your report.
Using Variables in the Header and Footer
You can use Variables in the header and footer of your report. Drag and drop variables to the header and footer areas.
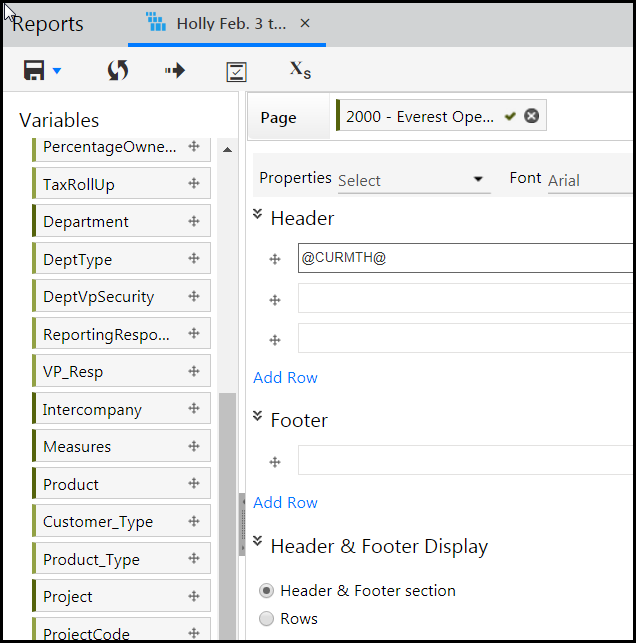
To remove a variable from the header or footer, drag and drop the selection back to the Variables list. Variables with an arrow contain sub-variables that can be added to the header or footer.
Header and Footer Properties
Click a header or footer and then select a property from the list box. Properties provide detailed information for headers or footers.
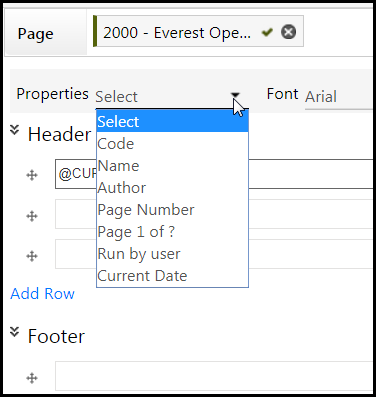
Code – Includes the report code in the header or footer.
Name – Includes the report name in the header or footer.
Author - Add the name of the report author to a header or footer.
Page Number – Add pages numbers to a header or footer; available when you export the report (not when the report is run).
Page 1 of ? - Add page number to a header or footer; available when you export the report (not when the report is run).
Run by user - Add the name of the user that runs the report to a header or footer.
Current Date – Add the date to a header or footer.

Font -Select a font to apply to a selected header or footer.
Size - Select the font size. The default font size is 10.
Bold the text for a selected header or footer.
Italicize the text for a selected header or footer.
Underline the text for a selected header or footer.
Change the color of the text for a selected header or footer.
Change the background color for a selected header or footer.
Decrease the indentation for a selected header or footer.
Increase the indentation for a selected header or footer.
Align the text to the left for a selected header or footer.
Align the text in the center for a selected header or footer.
Align the text to the right for a selected header or footer.
Open the Image Selector dialog page to browse and select an image from your computer or the File Cabinet to display in the selected header or footer. See Logo Limitations. Only image file types like jpeg, bmp, jpg, and png are supported.
View name, code, or label (name and code) details for each selected header or footer dimension.
Understanding the Header & Footer Section Option
The Header & Footer section option is selected by default and will be applied for both an Excel export in the report output menu and an Excel file attached to an email.
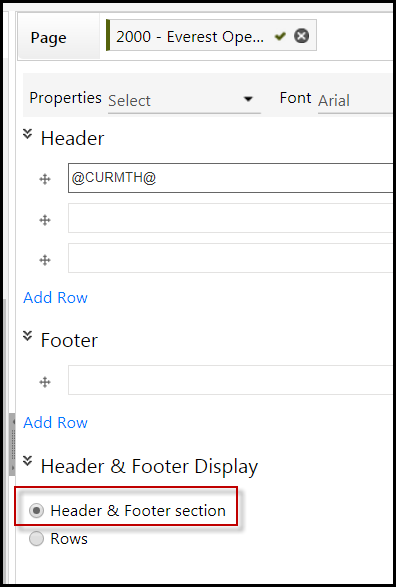
If you select Header and Footer section, then export the Dynamic Report to Excel, the report will be displayed in page layout view, not normal view. The purpose of page layout view is to provide better visibility for header and footer details.
Exporting Header & Footer Details as Rows
You can export header and footer details as rows in the Excel output and when attached to an email.
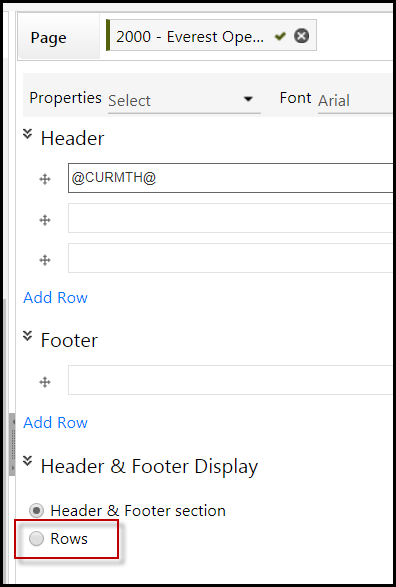
Logos, formatting, and positioning (left/center/right columns) should be adjusted to fit within the rows and columns of the Excel sheet. If you select Rows, the report is opened in Excel in normal view mode. You can change Header & Footer options at any time.
Using Point of View in Headers & Footers
Point of View (POV) is available for Dynamic Report headers and footers. POV and default members are applied to the page level dimensions selected in a header or footer.
How to Select and Display Dimension Members on the Page, Column, and Row
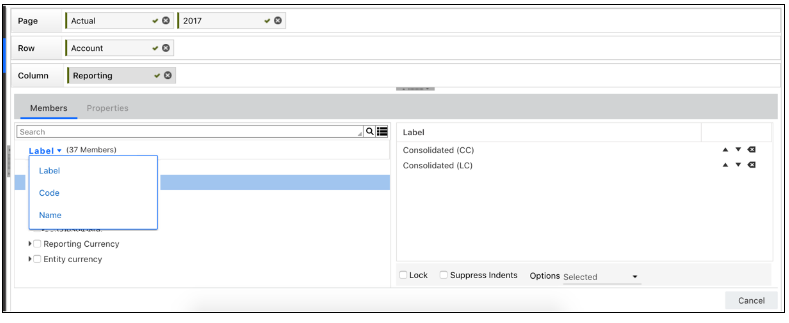
When you drag and drop dimensions to the report column and row levels, you will select members of the dimension that you want displayed on the report. For each member displayed on the report, select how you want it displayed. The options are Name , Code , or Label (name+code). On the Members pane, the Label selection is available as shown below.
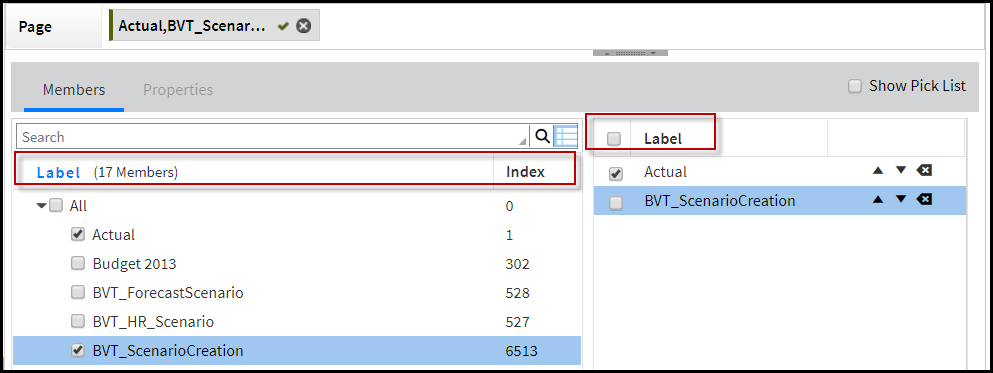
Click the Label selection in the left pane to display a list-box where you can select to show the Label, Code, or Name for the dimension members listed.
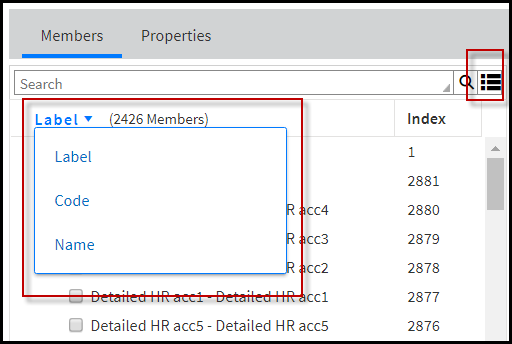
Whatever you select to apply here (Label , Code or Name ) will also appear in Dynamic Report output. By default, Label is selected and displayed.
This selection applies to Dynamic Reports added to a Report Collection or Financial Package.
Additionally, select the Index button to toggle the Index on and off. The Index number (also referred to as IDX) can be displayed in the Dynamic Report if toggled on.
What is a Pick List and How Do I Use It?
A Pick List is a quick selection list, which is similar to favorites. It is available on the Member Selector pane. Show Pick List is not selected by default and displayed for Page object selections only. Select Show Pick List to add member selections to the report pick list.

When the report is run, it uses the primary member selections only and not the pick list. You can add a pick list without adding members to the primary list. If this is the case, the report will run for the default members or Point of View as applicable. Lock, Suppress Indents, and Options details are displayed in the grid when Show Pick List is selected.
Notice in the image below that the checkbox next to Mapped Members is opened only when Show Pick List is selected. Select the checkbox next to Mapped Members to select all pick list members.
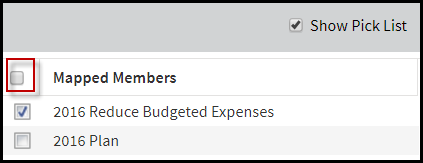
If Show Pick List is selected for the page object, a carrot icon is displayed for the object in the layout area. If you click the object, Member Selector is loaded. If you click the carrot icon, a pick list pop-up is provided for quick selection.

When member selections are complete and you click on an object in the Page axis (in setup, design, header/footer, and run modes), the name of the dimension and the list of primary and pick list selections for that dimension are displayed.
Applying Dimension Security does not remove the members from the Pick List. Report results display based on user if dimension security is available for selected members. If the object is locked, a regular user with read-only permissions can still run the report for members in the pick list, but cannot edit the pick list selections in member selector.
Why and How to Lock Dimension Members to Prevent Access by Regular Users
Is some instances, an admin user might lock dimensions. Locking dimensions prevents dimension member selections from being modified by regular users (with read-only access).
In Practice: How to Lock Dimension Members
Select dimension members to open the Member Selector pane.
Move the selected member to the Mapped Members area by clicking the forward arrow.

Click the Lock checkbox and select an option:
Selected - The report returns the members selected.
Children - The report returns the first level children of the selected members.
All Children - The report returns all of the descendants of the selected members.
Sel+Children - The report returns the selected members and the first level children of the selected members.
Sel+AllChildren - The report returns the selected members and all of the descendants of the selected members.
Leaves - The report returns the posting levels below the selected members.
Sel+Leaves - The report returns the selected members and the posting levels below the selected members.
Sel+Parents - The report returns the selected members and the summary levels above the selected members.
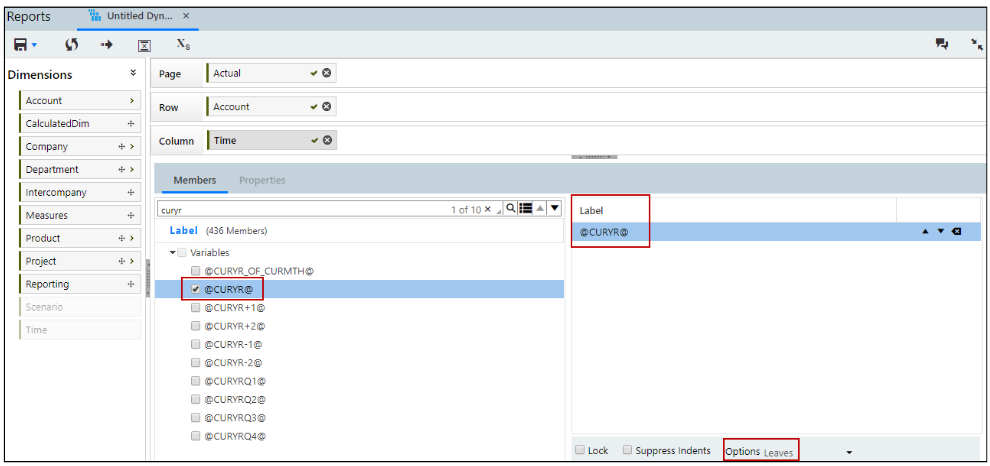
The option selected (i.e. Leaves, Children, etc.) also applies to substitution variables used. For example, if you select the @CURYR@ substitution variable as the member for a Time dimension on the column or a Dynamic Report and then you select the Leaves option, the Dynamic Report output will display with all current month output. This is because the @CURYR@ substitution variable has current month leaf members.
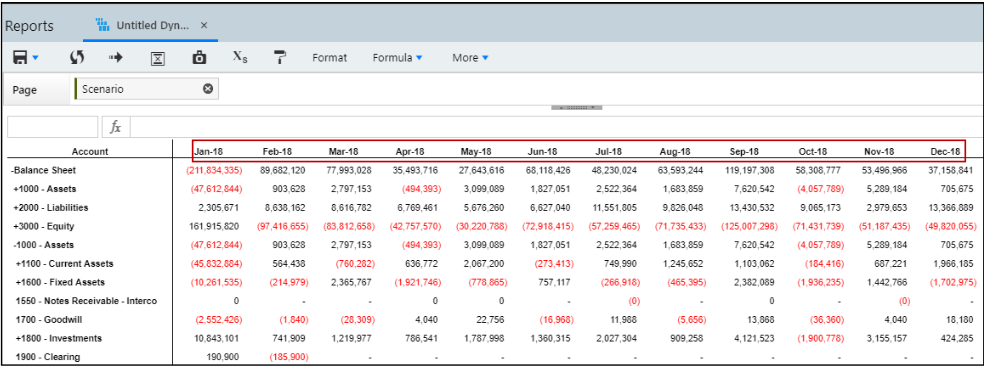
Formatting a Dynamic Report
Why Format a Dynamic Report
Formatting allows you to personalize your report. You can format negative numbers, choose number scaling and separators (i.e. comma or period displayed for numbers), and more.
How to Access the Format Pane
Within the Dynamic Report interface, click Format to launch the Format pane.
The format bar will appear differently based on if you have opted in to Cell Level Formatting , a feature that allows you to format Dynamic report output down to the individual cell level, or have Standard Formatting functionality.
Existing customers (prior to the Summer18 release) must contact Planful Support to enable Cell Level Formatting. This feature is enabled by default for new customers.
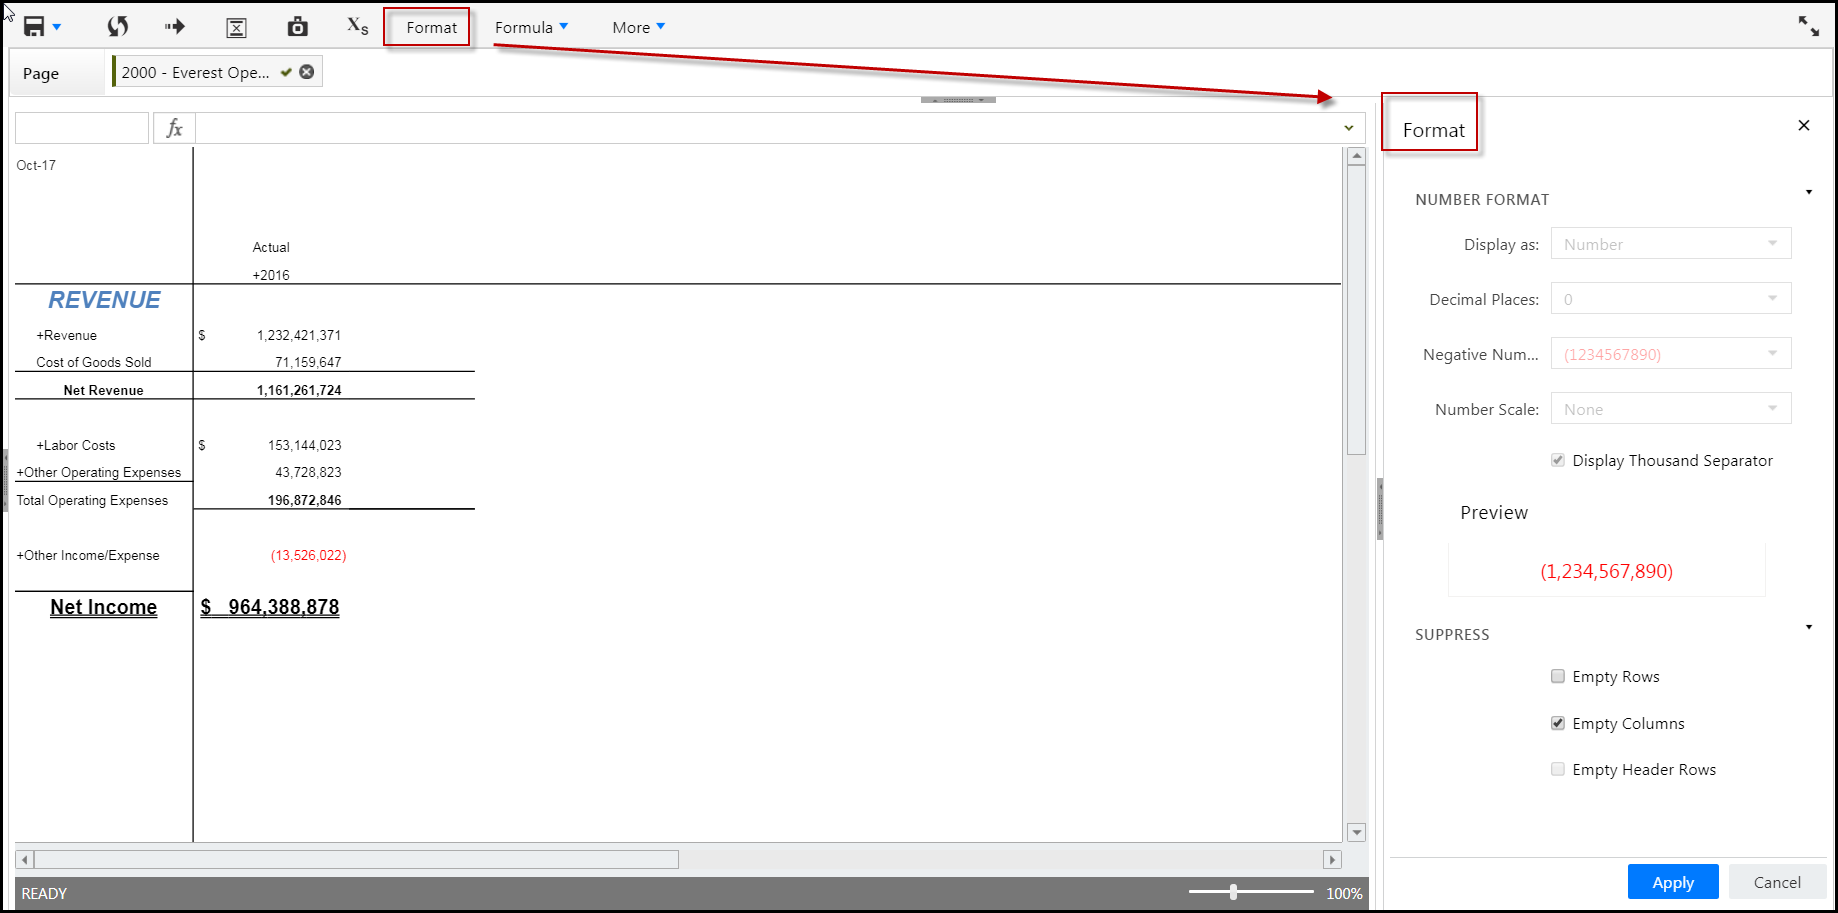
An Explanation of Standard Formatting Functionality - You Have NOT Opted In to Cell Level Formatting
A description of all fields is provided below:
Display as - The format in which you want your report numbers displayed.
Decimal Places - Choose up to 6 decimal places for numbers. Decimal places are displayed in Dynamic Reports based upon whether Report Sets are used or not. When Report Sets are not used in a Dynamic Report, decimal places displayed in quick functions are identical to those in the Dynamic Report. When Report Sets are used, decimal places in quick functions allow for the maximum number of decimal places allowed for a selected range.
Negative Numbers - Determines the format of the negative number. You can display negative numbers in parentheses, in color, or both. If you choose Absolute as the format, negative numbers will be displayed as positive numbers without any formatting.
Number Scale - Defines a value that the numbers displayed in the Dynamic Report must be multiplied by to get the actual number.
Display Thousand Separator - Determines whether a comma is to be placed to separate thousands.
Preview - Displays the format for negative numbers based on your selections.
Some options are disabled if report sets are used in the report.
Suppress -Suppress empty rows, columns or headers from view in the report.
Drill Through - Drill through translation and transaction details. Expand (drill down) and collapse (drill up) report detail.
Transaction and Translation data is not stored in the OLAP Cube from which the Dynamic Reports pull their data, which is why drill-through is required. This means that you cannot run a Dynamic Report to output Transaction or Translation data. For example, lets say you have a travel line item in your report that shows up as a number. You have to drill down to see what transaction data makes up that number. You cannot generate a report to open and display at the transaction level.
Cell Level Formatting Explained
With Cell Level Formatting, you to control the look and feel of report output down to the cell level. Apply formatting to the entire report, a row/column, a range of cells, or an individual cell. Additionally, you can:
apply formatting when using the insert formula row/column in a report
format a formula exception value
vertically top/center/bottom align headers and numbers in a report
If you opt-in, this functionality applies to all existing and new Dynamic Reports across all browsers. It is available for all reporting areas (Financial, Sales, Scorecard, Workforce).
Cell Level Formatting is enabled for Dynamic Reports that are designed using dimensions or attributes and Report Sets on the Row or Column axes.
The default format for a Dynamic Report is:
Column headers are center aligned and bold
Row headers are left aligned and bold
Drill down members are shown with indents
Numbers are right aligned
Font = Arial, size = 8, color = black, fill color = no color
Formatting is applied to all cells within the body of the report and:
Applies to row and column headers, numbers/data values in the report
Applies to merged cells (when multiple dimensions are used on the column axis)
Notes, Insert Formula row/column, Formula Exceptions
Formatting is retained when exporting a Dynamic Report, when it is included as an email attachment, linked report, and when used in a Report Collection or FPP.
When the structure of the report is modified by adding or removing dimensions from the row or column axis, formatting has to be readjusted for accuracy.
In Practice
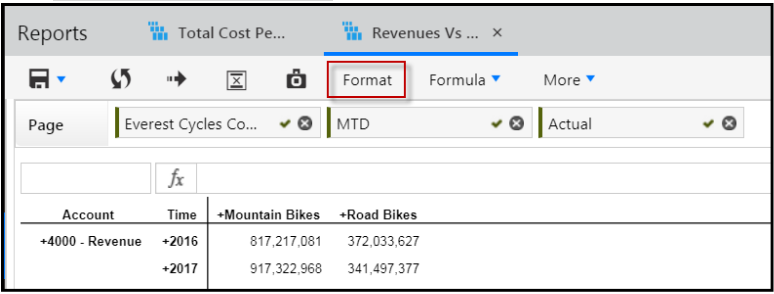
To apply cell level formatting to a Dynamic report, open the report, and click the Format icon (an example is shown below).
The Format pane appears as shown below. There are 3 tabs; Text , Data , and Other . Ensure the Text tab is selected.
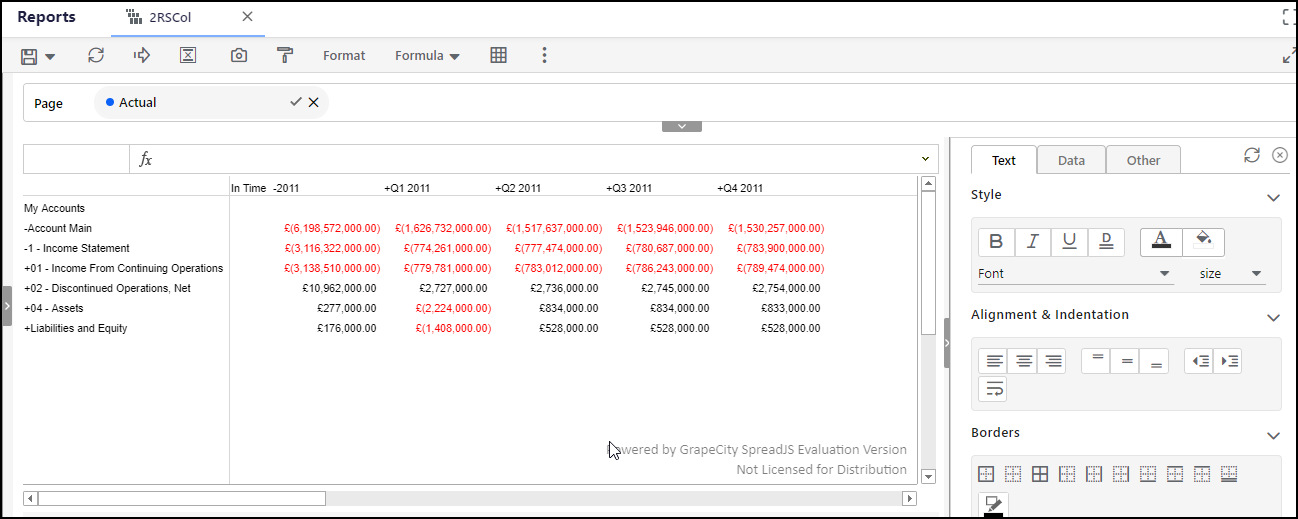
Select a cell and apply different styles. The same report shown above has been modified and is shown below.
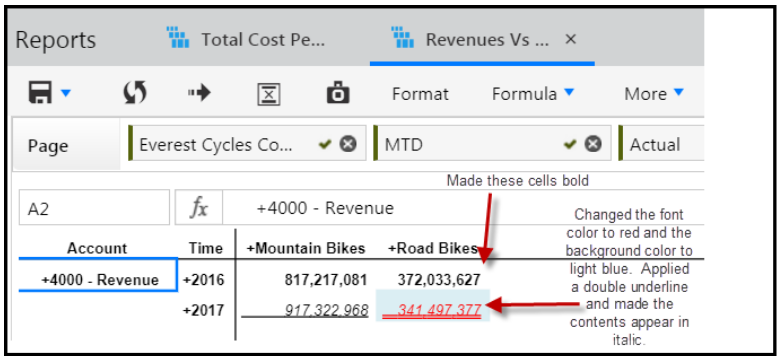
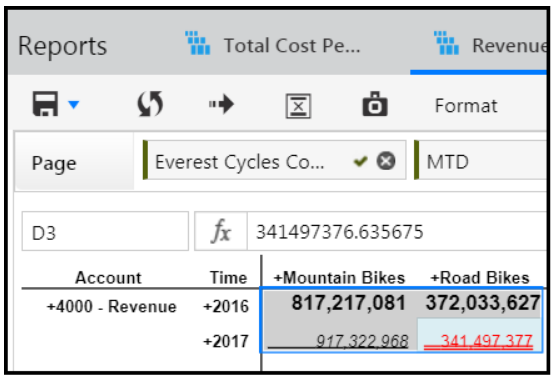
To select a range of cells as shown below, drag the cursor as you would in Excel.
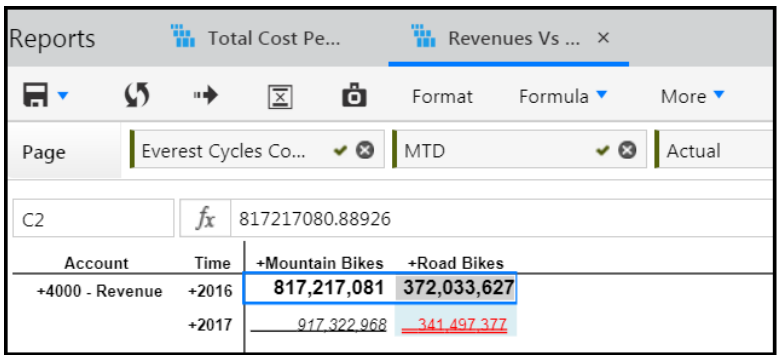
Change the font type and size. In the report below, 2016 font size is increased.
Planful supports a range of font types, which are enabled in Static Report Sets. Select the list-box to view all supported font types. Fonts size 8 through 32 px are supported. The default is set to 8 for all existing and new Dynamic Reports across all the lines. Based on the font size the row height automatically adjusts.
Select alignment and indentation options. In the report shown below selected cells are vertically aligned to the bottom of the cell. Select horizontal alignment (left, center or right). Select vertical alignment (top, center or bottom). Select to indent left or right. Indents, horizontal, and vertical alignment also applies headers and data values. Optionally, select Text Wrap. Note that Text wrap does not apply to data cells.
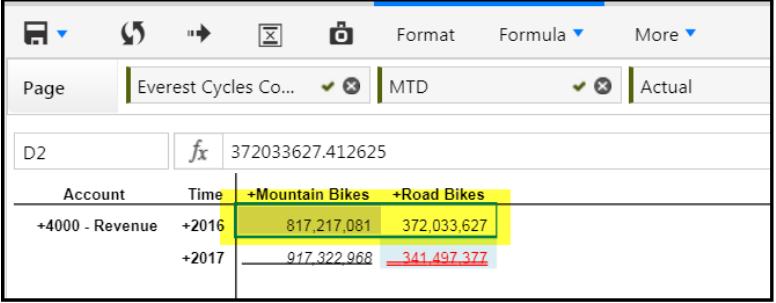
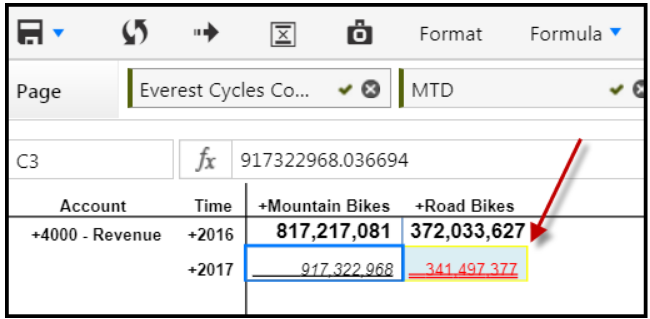
Apply borders to the report. Select a cell or cells, select a border color and click the border type to be applied. In the image below, a yellow border is applied to a cell.
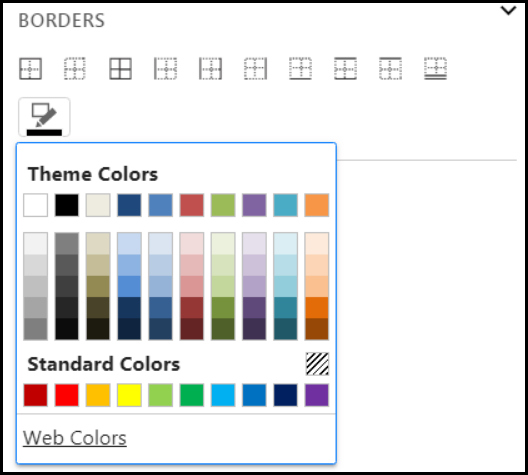
Here is the border color and border type selection pane. There are many options to choose from including, no border, left and right border, and top and bottom border.
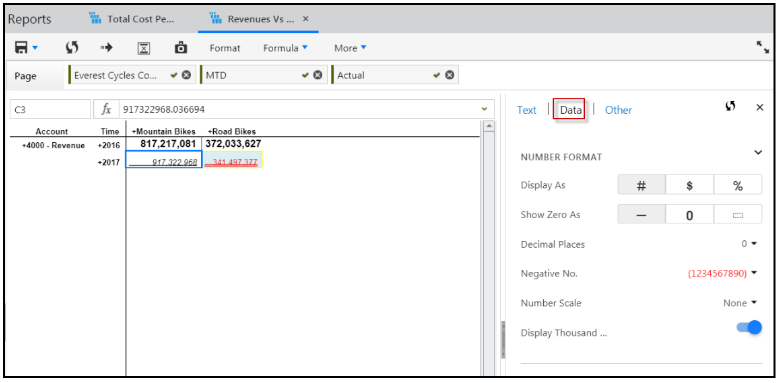
Click the Data tab.
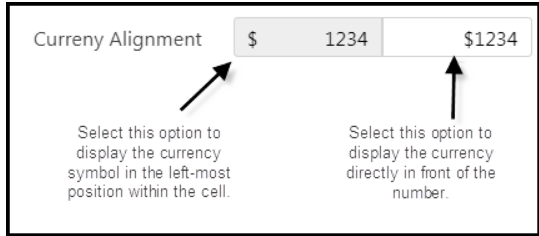
For Display As , select to display the cell contents in number, currency, or percentage format. When currency is applied to a cell or cells, the Currency Alignment options displays as shown below.
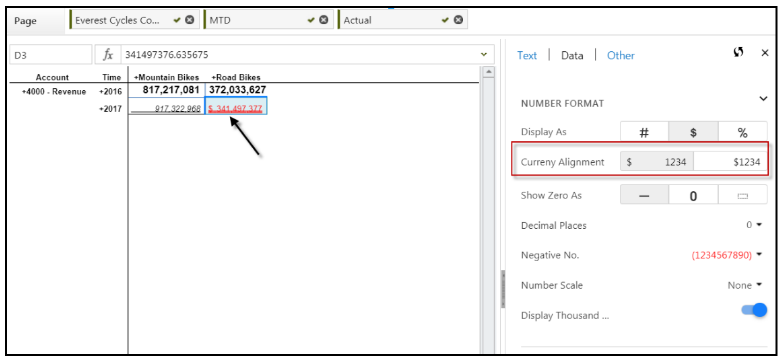
Select how you want the currency symbol displayed in the cell. There are two formats; Accounting and Currency . With the Accounting format, the currency symbol is displayed in the left-most position within the cell. With the Currency format, the currency symbol is displayed directly in front of the number in the cell.
When multiple formats are applied to the report, only the most recently applied format gets applied to each cell in the report. When multiple cells with different formatting are selected, format of the first cell is displayed in the pane. Formatting is not supported when Properties are added to the report.
The Currency symbol displayed is based on your location settings.
For Show Zero As, select how you want to display zero values (as dashes, empty, or as 0) for a selected cell, cell range, or the entire report. Selecting 0 applies to all data values in the report including MDX, Excel calculations, insert formulas, and formula exceptions.
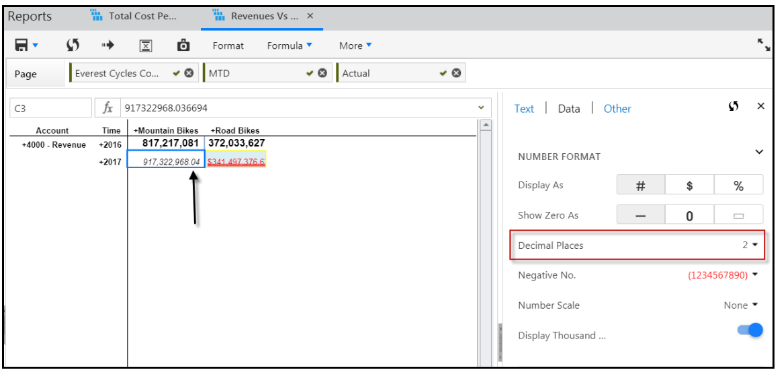
Select the number of decimal places for a selected cell, cell range, or report. In the example below, 2 decimal places is selected for a cell. You can select 0 to 6 decimal places.
Select a Thousand Separator option. Display of the thousand separator is driven based on user location settings.
Finally, click the Othertab and select to hide or display empty rows and columns.
Don’t forget to click Apply and Save !
How to Reset Formatting Selections
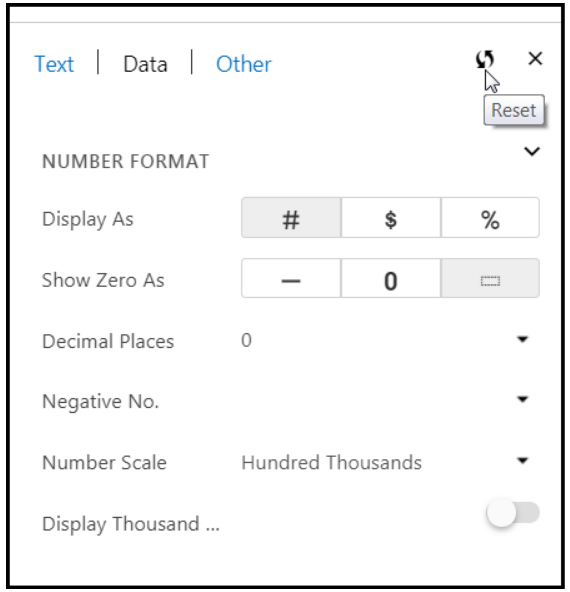
Let's say you made several formatting selections, but want to return to the default formatting, click the Reset icon. The Reset icon on the top of the Format pane resets the format values to the defaults.
Situations When Formatting is Disabled or Can't be Applied
In certain situations, formatting might become disabled or has to be reapplied. The remainder of this topic discusses these situations.
Drill Down Rows and Columns
Formatting is disabled for drill down rows and columns. The images below depicts the behavior.
Prior to Drill Down Formatting is Applied to Cells
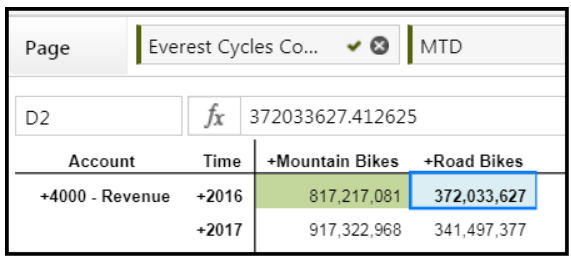
Click the Mountain Bikes Drill Down and Formatting is Not Applied to Members

Running Borders and Currency Format
Running borders and data formatting is inherited from the parent member and applied to the drill down rows and columns. The images below depicts this behavior.
Running Border and Currency Format Applied

Running Border and Currency Format Also Applies to Drill Down Members

Number Scale
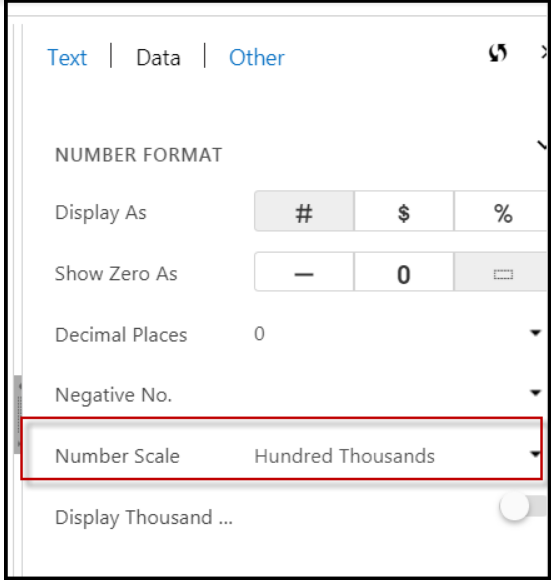
Number Scale is disabled when you SELECT ALL or do a CTRL+A. In the image below, a CTRL+A was performed.
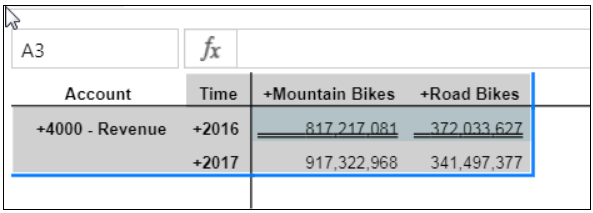
Then, a number scale was selected, but is not applied to the report when all report cells are selected.
Font Color When On a Mac
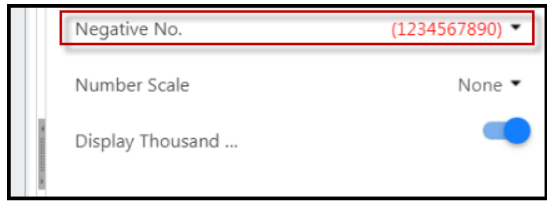
The drop down for negative numbers does not apply a Red font color in the drop down (shown below) on a Mac.
How to Resize and Save Groups of Columns in a Dynamic Report
Select multiple columns at once in Dynamic Report output using shortcut keys, resize the width for all selected columns and then perform a Save. When you perform a Save (with Save Column Widths selected in the toolbar), all column widths are retained even when the report is closed and then reopened. Prior to this release, only the first resized column could be saved in a Dynamic Report and all other columns reverted to a default width unless you resized each column individually.
In Practice:
Open a Dynamic Report.
Hold the SHIFT key to select the contiguous columns to resize. Or, hold the CTRL key to select disparate columns
Drag the column line (shown in the image below) to the appropriate size.
Click Save.

Currency Display in Dynamic Reports
Existing customers (prior to the Summer18 release) must contact Planful Support to enable this feature. This feature is enabled by default for new customers.
Display a currency value (such as EURO) aside from LC or CC (Local Currency or Common Currency) in a Dynamic report. Displaying the currency value in a Dynamic Report improves usability and report interpretation.
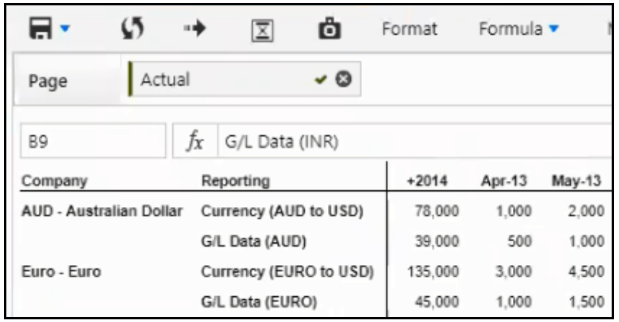
Prior to this release all currency in a Dynamic report displayed as CC (common currency), LC (local currency) or Interim Currency as shown in the image below.
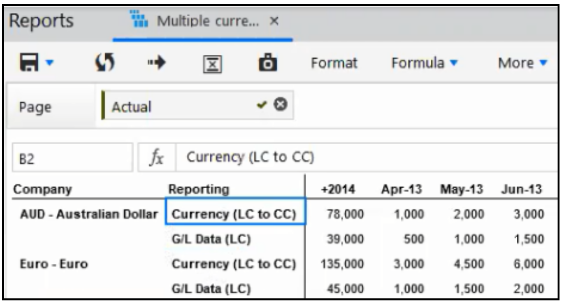
The same report (shown above) can now be displayed in other currency values as well. The LC and CC is replaced with the actual currency value, the companies are AUD and Euro, and the currency related to each company is shown in the Reporting column.
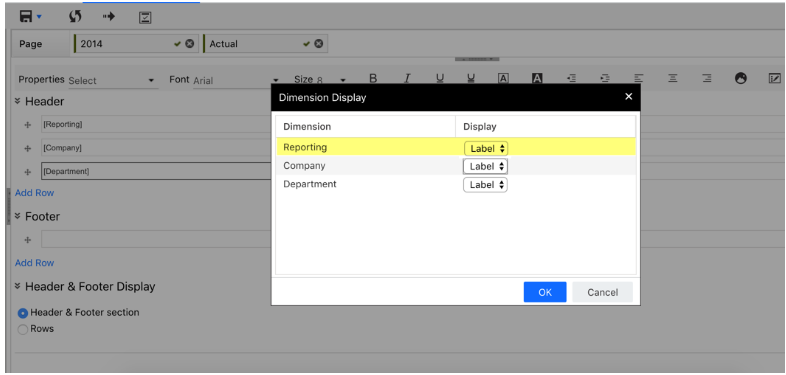
Additionally, you can display a Reporting dimension in the header or footer of the Dynamic Report by name, code, or label. In the example below, the Reporting dimension is on the report header.
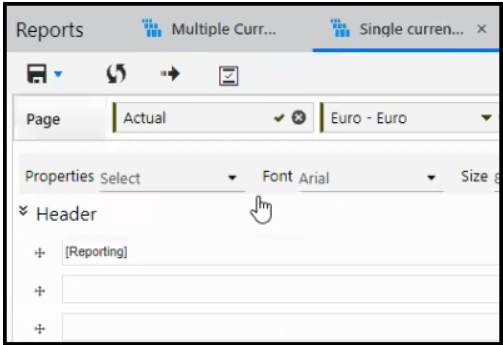
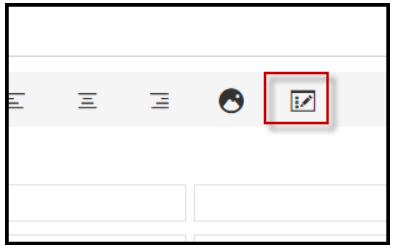
Click the Dimension Display icon.
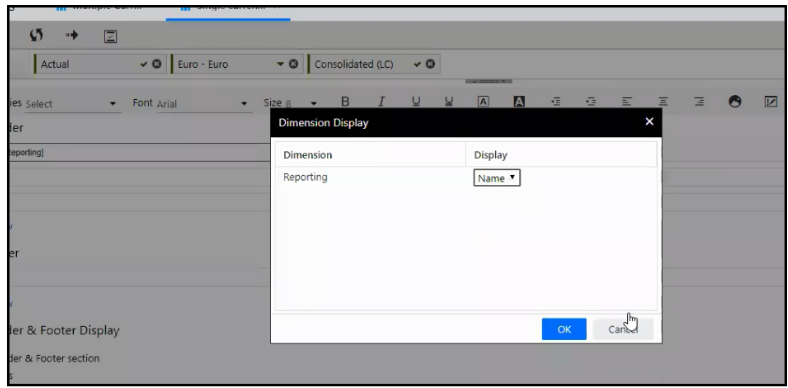
Display the Reporting dimension in the header by code, name or label as shown below. With this enhancement, it is now easier to identify the currency of the report data.
This feature applies to Financial and Scorecard Reporting Areas (cubes) only. The currency value will be displayed when the Dynamic Report is generated using alternate hierarchies, attributes, attribute hierarchies, and substitution variables. The currency value is displayed for Common, Local, Interim and Reporting currencies.
You must select the Company dimension to appropriately display the local and interim currencies in a Dynamic report. Common currency is obtained from Maintenance > Admin > Configuration Tasks . The Reporting currency data is obtained from the Hierarchy Management screen/setup for the Reporting dimension. Common and Reporting currencies are independent of the Company dimension.
Default Members, Pick List, user point of view (POV) and Bursting/Page selections in a Report Collection and Financial Package reports are all honored for the Company dimension in order to display the appropriate currency in a Dynamic report.
Currency display applies to exports and e-mail attachments as well as Dynamic Reports run through a Report Collection, Financial Package, and/or Mapped Reports.
When this feature is not enabled , the current behavior is retained and there are no changes to the Consolidated CC or LC (or any Reporting dimension member) labels displayed in the headers.
When this feature is enabled , report data is retrieved based on the Reporting dimension member selected in the report. However, the report header/footer and row/column headers always display the appropriate Currency property associated with the Reporting dimension member for a leaf member selected on the Company dimension.
Best Practices / Tips
The information below applies to Local and Interim currencies only and does not apply to other Reporting dimension members; including Common and Reporting currencies.
If multiple members are selected from the Company dimension on the page axis and the Reporting dimension is included into the report header/footer section, the report displays the Reporting dimension member (e.g. Consolidated LC) selected on the page axis and does not replace with the appropriate currency value.
If at least one rollup member exists for the Company dimension on the page/row/column axis, currency value is not displayed.
Currency is not displayed if the Reporting dimension members are renamed in the hierarchy or they are used in Static Report Set line names and edited.
Currency is not displayed if the Reporting dimension members are used in Static Report Set line names where Single Dimension Multiple Members, Multiple Dimension Single Member and Advanced Rules are defined.
Currency is not displayed if the Reporting dimension members are used in a Dynamic Report Set where Advanced Rules are defined.
Currency is not displayed when each of the Company and Reporting dimensions are used on the row and column axis. For example, if Company is used on the row axis and the Reporting dimension is used on column axis (or vice versa).
Code/Name/Label display configuration is not available in Report Sets.
Limitations exist for Local and Interim currencies when Attributes or Attribute hierarchies are used in a report.
How to Create a Dynamic Report with Currency Displayed
Contact Planful Support to enable this feature if you are an existing customer (prior to the Summer18 release).
Navigate to Maintenance > Admin > Configuration Tasks and select the Define Currency Parameters task. This is where your common currency is defined. Enter the common currency code and name information and save.
Navigate to Maintenance > Hierarchy > Hierarchy Management . For Type, select Finance Hierarchies , for Dimension and Hierarchy, select the Reporting dimension.
Click Show . This is where you will set up Reporting members.
Select the Company Dimension and Hierarchy. Use the Properties tab to select local and interim currency for each member. For example, for a French (based in France) company, select Euro as the local currency. Optionally select an Interim currency. For example, if you select GPB for Interim currency, you can report in GPB for the French company.
In the File Cabinet, click the Add icon to add a new Dynamic Report.
The Reporting Area selection screen appears. Select either the Financial or Scorecard reporting area as the other reporting areas are not available with this functionality.
On the page, column or row, drag and drop the Company dimension. For example, drag and drop the Company dimension and select the French company. The currency displayed in the report for this company member will be EURO. Several examples are provided below.
Examples
Example 1 : In the image below, the Reporting dimension is used on the page axis or header/footer section of the Dynamic Report.

Example 2 : The Reporting dimension is used on the row/column axis of the Dynamic Report. Notice that for Reporting dimension members with currency conversions from LC to CC, LC and CC are replaced with the appropriate currency value. In the image below, approved Initiatives (LC to CC) is displayed as approved Initiatives (CAD to USD) in the report headers.

Example 3 : This example shows how the currency displays when drilling down on a Reporting dimension.
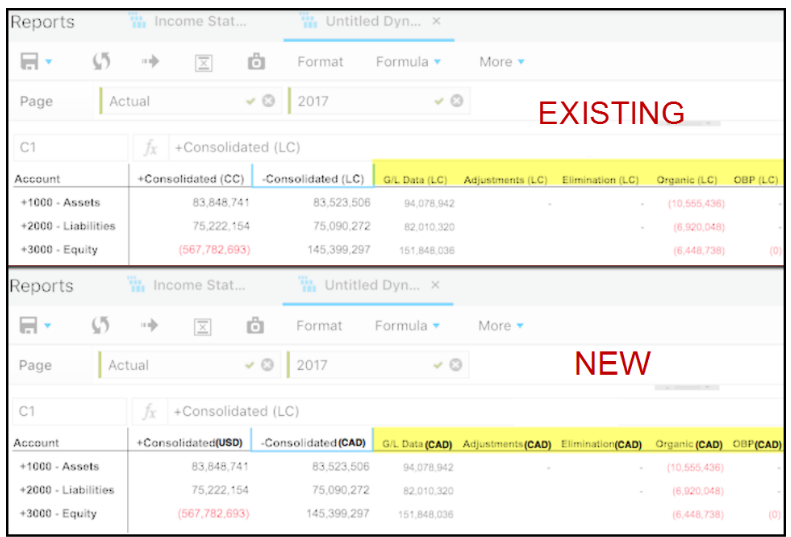
In all the above examples, currency Code/Name/Label is displayed based on the configuration applied to the Reporting dimension.
Contact Planful Support to enable Code/Name/Label display configuration in your Dynamic Reports.
You can change the Code/Name/Label display for the header/footer section using the Dimension Display screen.
Enhanced Drilling on Dynamic Report Output
If you have not opted in for the Enhanced Drilling Functionality, see the Drilling Capabilities in Dynamic Report Output section. This section contains information ONLY for those who have enabled this functionality.
Overview
This is an opt-in feature. Existing customers (prior to the Summer18 release) must contact Planful Support to enable this feature. This feature is enabled by default for new customers.
Drill through functionality in Dynamic Reports is available for:
Financial Reporting Area
Transactions
Translations
Template lines and sublines
Capital details for your budgets and forecasts
Workforce Planning data from GL data
Data Load Rules data
Operational Planning (including Preloaded and Forecast type scenarios)
Consolidation data
This drill through functionality provides users with the ability to view and analyze all financial, operational, capital, workforce, and transactional data from a single place.
From a drill through report, you can view details for a single or multiple templates. All Financial dimensions, the corresponding currency, and amounts for each period are displayed in the drill through report for all modules and templates. Columns displayed in the drill through report are dependent on the module and the template accessed by the user. A Measure column is displayed on Operational Planning, Capital Planning, Workforce Planning, Translations, Consolidation, and GL Data Load tabs. Source dimensions are displayed for Translations and dates are displayed for Transactions. Budget Entity, Template Lines, Sublines, Notes are displayed in drill through for Planning templates. Empty columns are suppressed.
All values displayed in a drill through report inherit data format (decimals, thousand separators, scale etc.) from their parent cell.
Calculated members, calculations, advanced rules, Excel formulas, formula exceptions, rank, pivot are not supported in drill through reports.
You can enable or disable Drill Through functionality for specific Dynamic Reports. To do so: open a Dynamic Report, select the More drop-down menu, and click Disable Drill Through . You can enable Drill Through at any time by opening the More menu and selecting Enable Drill Through.
Drill Through to Translations and Transactions
Here is an example of drill through from a Dynamic Report to Translations and Transactions data.

Drill Through to Planning and Capital Template Data
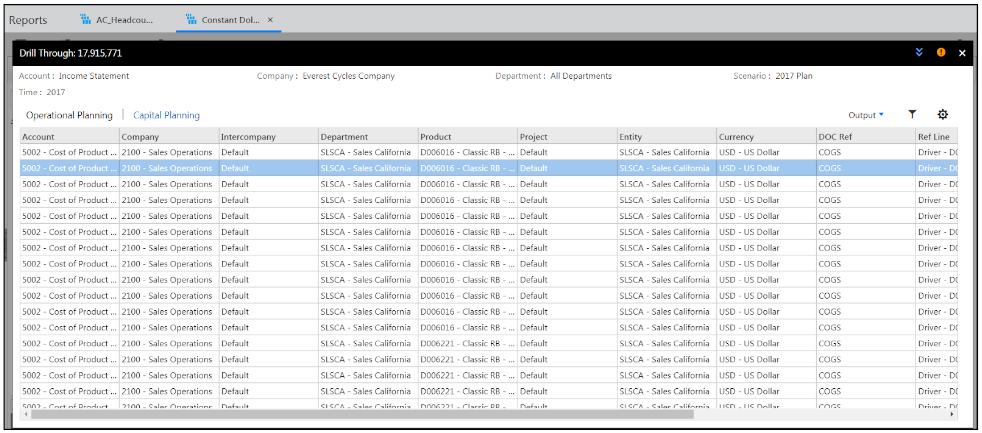
Here is an example of drill through to Planning and Capital template data. Header data is displayed. Click Operational Planning or Capital Planning to display associated data. For Capital Planning, Asset Name and Category data is displayed.
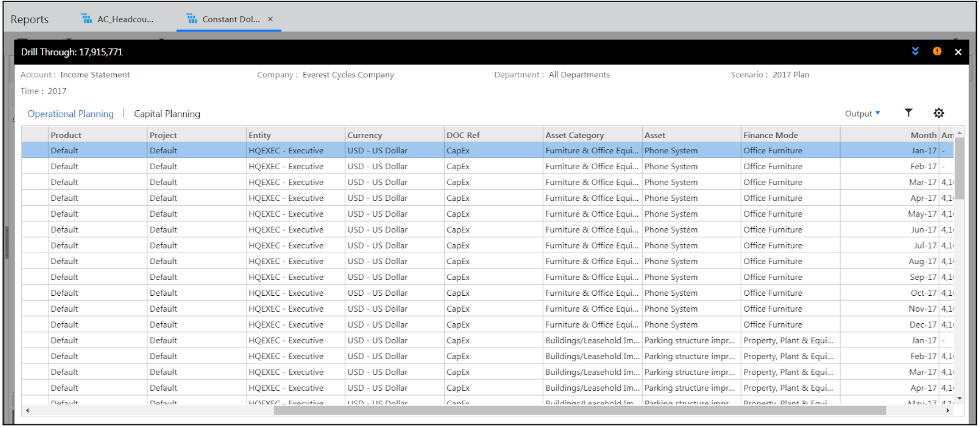
In Practice: Drill Through to Template Data
To drill through a Dynamic Report to display template data, complete the following steps:
Access a Dynamic Report.
Double-click on a cell within the Dynamic Report. Another screen appears. The properties of the cell are displayed in the header portion. Data is displayed for the intersection.
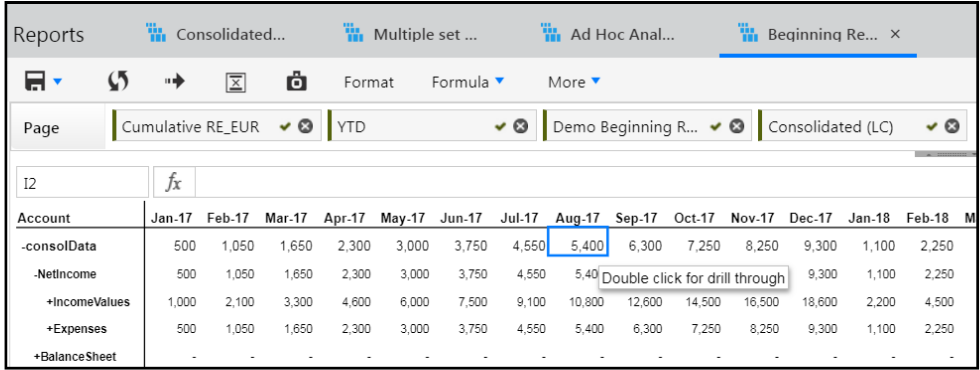
The related data for the cell is displayed. Click the Settings icon to select columns to show or hide. Additionally, you can show/hide columns in Operational and Capital Planning where the data will be aggregated based on segment/dimension combinations.

Optionally, export the data to Excel by selecting Output > Export to Excel . Filter the data and select the double up or down arrows to display header details.
If you want to view the source template, you can click on the hyperlink available in the Doc Ref column of any record in the report to open the corresponding source document template. The Source template opens in a new browser window. The user security for the budget entity and the navigation access permissions to the template are honored while opening the template.
Drill Through Reporting on Preloaded and Forecast Scenarios Populated with Seeded Data
To populate Preloaded and Forecast scenarios, it is likely that you will seed data from another source or sources. Once the scenarios are seeded (populated) with data, you can use the Scenario dimension and the Preloaded and Forecast scenario dimension members in your Dynamic report. In the image below, the Forecast scenario is used at the row level along with Account.

For Preloaded scenarios, Entity , Doc Ref,Lines , and Sublines do not exist so they will not be seeded or displayed in a Dynamic report.
For Forecast scenarios, Doc Ref is set to Data Seeding. Lines and Sublines are displayed if they are seeded from the source scenario (depending on Scenario Setup), otherwise they are empty. If populated, in the Operational Planning tab (shown below), you can optionally turn off Ref Lines and Sublines. The report will be re-rendered to remove associated rows and columns. To turn off Sublines and Ref Lines, uncheck the boxes under Setup (shown in image below) and click Apply Changes.
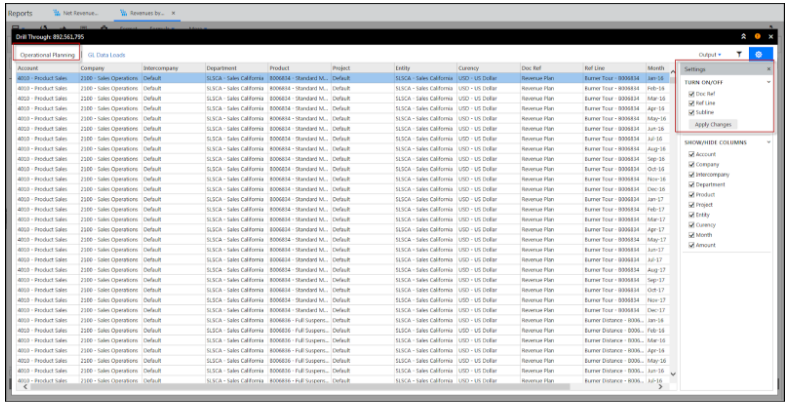
When you drill on a Preloaded or Forecast scenario, the seeded data is displayed under the Operational Planning or GL Data Loads tab depending on where the data is input from.
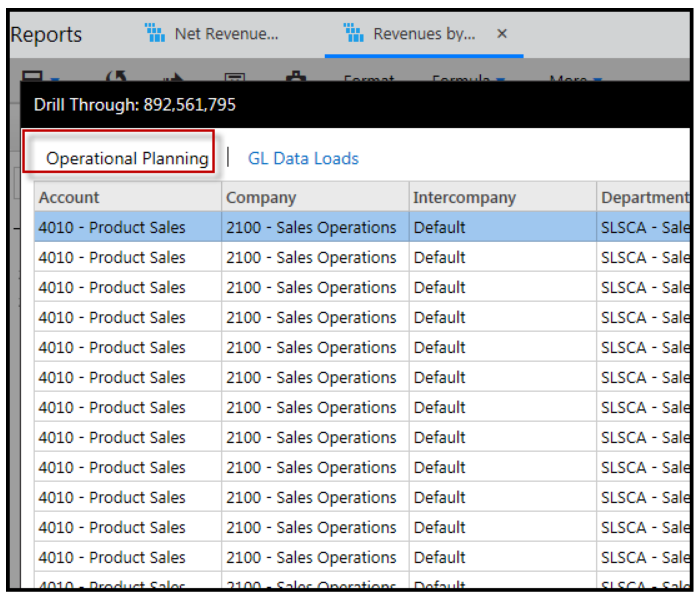
For Preloaded scenarios, if the Seed ETL Direct CC Data option (shown below) is selected when adding the scenario, both LC (local currency) and CC (common currency) data is displayed in the drill through. If not selected, only LC data with currency conversions (if applied during the data load) is displayed.
Access the Scenario Add page by navigating to Maintenance > Scenario > Scenario Setup > Add.


Drill Through Reporting on Closed Period (History) Data for Forecast Scenarios
History or Closed Period data is available for Forecast scenarios only and can be drilled upon in Dynamic Report output. The data can be populated from Actual, Budget, Forecast or Preload scenarios.
When you drill on a Forecast scenario the history/closed period data is displayed under the Operational Planning tab. Doc Ref is set to Closed Periods Data. Entity , Lines , and Sublines are not applicable for Closed Periods.
Drill Through Reporting on WFP Data Populated from Dynamic Reports
Workforce Planning data is available under the tab called Workforce Planning in the Drill Through report (as shown below).
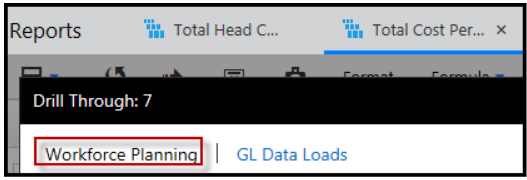
Workforce Planning data can be loaded for Budget and Forecast scenarios. GL segment combination, Home Entity, Position Entity, Employee, Employee Type, Position, Compensation Item, Currency, Month, and Amount are displayed in the Workforce Planning Drill Through report.
If you want to view the workforce planning source template, you can click on the hyperlink available in the Home Entity column of any record in the report to open the corresponding workforce planning source document template. The source template opens in a new browser window. The user security for the budget entity and the navigation access permissions to the template are honored while opening the template.
The ability to turn on/off Doc Ref is disabled for the Workforce Planning Drill Through report.
Drill Through Reporting on GL Data Loaded via Data Load Rules
GL Data can be loaded for all Scenario types (Actual, Budget, Forecast, and Preloaded) via Data Load Rules. GL Data loaded using Data Load Rules is displayed under a tab called GL Data Loads in the Drill Through report as shown below.

GL segment combination, Doc Ref, Currency, Month and Amount columns are displayed in the GL Data Loads tab on the Drill Through report. The Data Load Rule Label (2017 Actuals in the example below) is displayed under the column Doc Ref.

You can turn on/off the Doc Ref . If turned off, data is aggregated for a given segment and currency combination across all Data Load Rules. Click the Settings icon to turn Doc Ref on or off. Select or deselect the checkbox and click Apply Changes . See the example report below.

Drill Through Reporting on Operational Planning Data
A Notes column is available on the Operational Planning tab in the Dynamic Report Drill Through report. This column displays a Notes icon for a line in Drill Through when the line has a note available in the source Planning template. You can double click the icon to view the content.
If you want to view the source template, you can click on the hyperlink available in the Doc Ref column of any record in the report to open the corresponding source document template. The Source template opens in a new browser window. The user security for the budget entity and the navigation access permissions to the template are honored while opening the template.
For example, the image below displays a note for the highlighted line in the Planning template. When you use the data from the Planning template the note is retained in the Drill Through report.
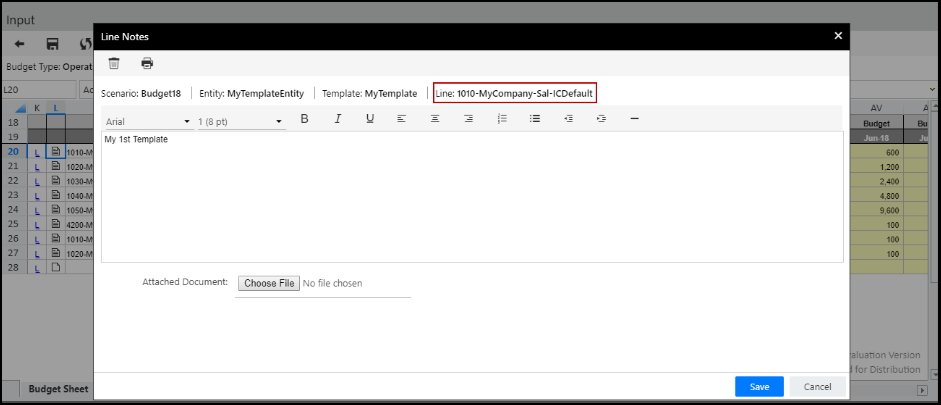
The Drill Through report displays the note that is available in the source Planning template.
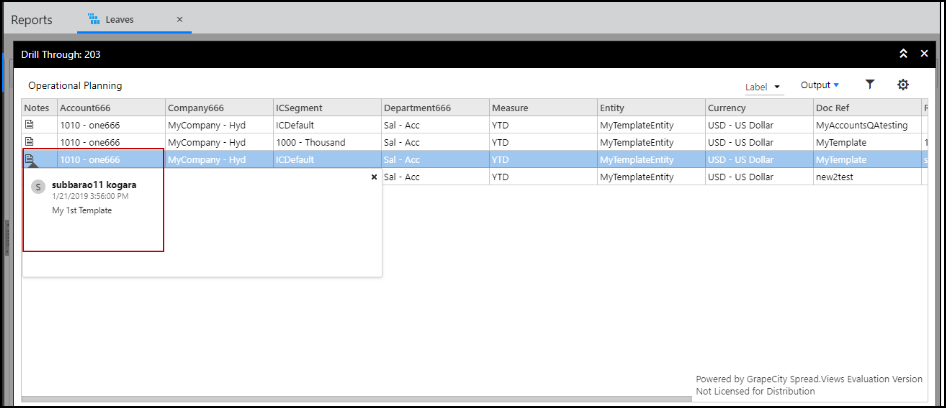
Important Information:
The Notes column is not displayed in the grid if the Ref Line checkbox is not selected.
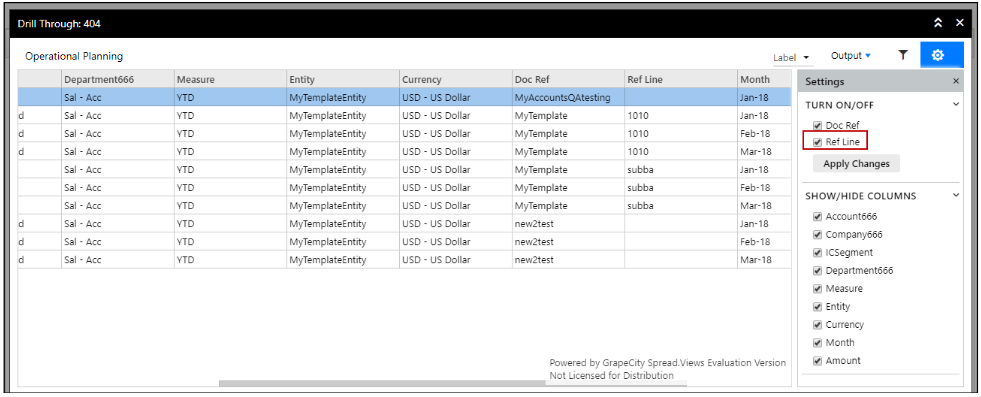
When you export the Drill Through Dynamic Report, 1024 characters are displayed in notes.
Drill Through displays up to 250 notes.
Drill Through Reporting on Consolidation Data
Drill through to source information on Consolidation data. Data imported from a general ledger or adjustments made using journals or the transformations of data by the Consolidation process can be drilled into using Dynamic Report Drill Through.
When you drill through in a Dynamic Report, you will see a tab called Consolidation as shown below.

As shown in the image above, the default columns displayed for Consolidation include the Chart of Accounts segment combination (in this example; Account, Company, Intercompany, Department, Product, Project), Measure, Reporting, Type, Doc Ref, Line, Currency, Month and Amount.
Cells in the Type column populate from the following; Standard Journals, Dynamic Journals, Non Controlling Interest Calculations, Reclassifications, Eliminations, Consolidation Process, and MSOB (Multiple Set of Books) Calculations.
Cells in the Doc Ref column populate with labels that correspond with the Type column. For example in the image below, Doc Ref represents the name of a Standard Journal , which is why the Type is Standard Journal.

The Standard Journals in this case are set up against the 1010 - Corporate HQ company as shown below in the Member Selector screen of the Consolidation Control Panel.
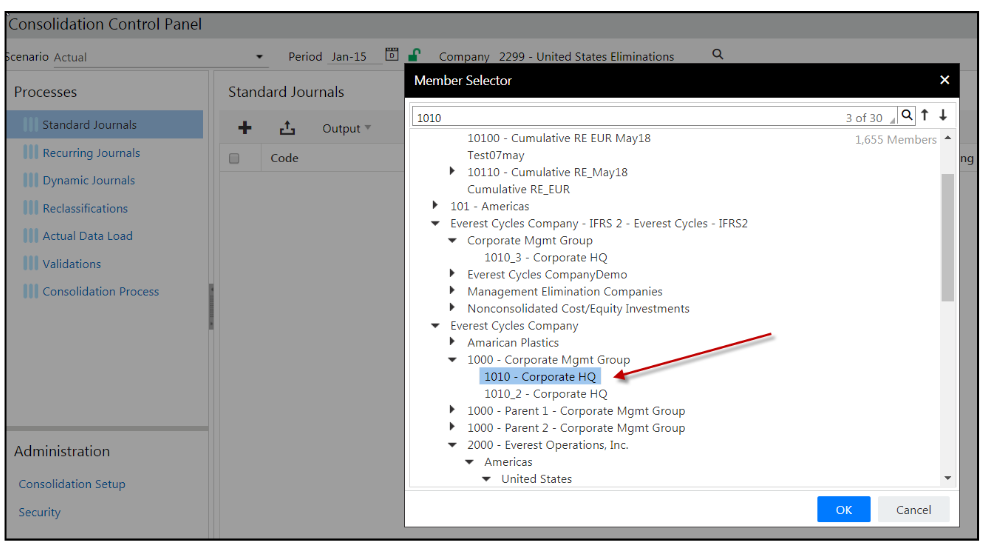
Similarly, if the Type is Elimination , then Doc Ref references the Elimination entry for the account and company.
Cells in the Line column populate for Standard Journals, Dynamic Journals, and Non Controlling Interest Types. The cells in this column will be empty for all other Types. If two Lines with the same Line Name/Description are posted from a single Journal for a given segment combination, their values are aggregated in the drill through report.
Turn ON/OFF is enabled for Type and Doc Ref . If turned OFF , data is aggregated for a unique segment and currency combination across all journals and the Consolidation Process.
Code/Name/Label Display in Dynamic Report Drill Through
Display drilled through Dynamic Report output by member code, name, or label (code+name). When a Drill Through report is exported to Excel, the code, name, label configuration is retained across all the tabs. You cannot save the code, name, label configuration as it is for viewing and export purposes only. Once you navigate away from the Drill Through screen, the default setting is reapplied.
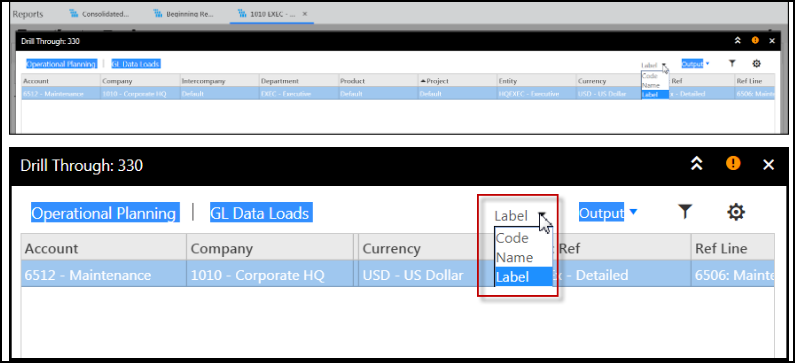
In the example below, code is selected on the Operational Planning tab.
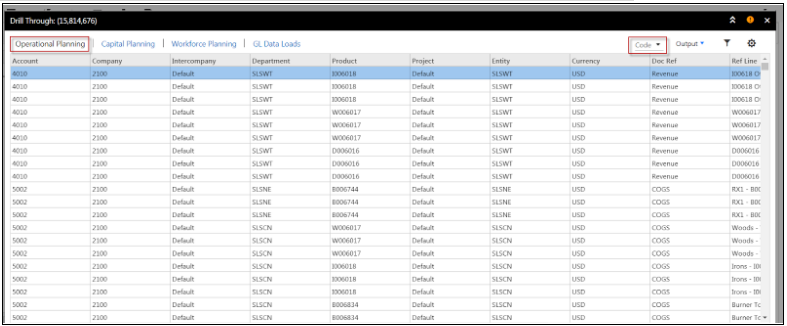
When Capital Planning, Workforce Planning or GL Data Loads tabs are selected, the code only will display as shown below.
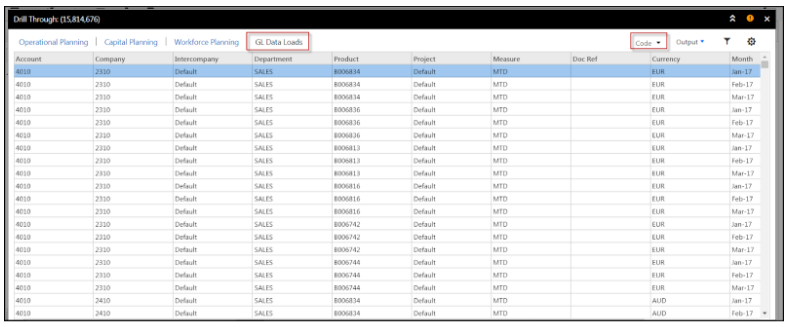
You cannot have one tab display code while the other displays label, for example. All tabs will display based on the latest selection made on any of the tabs.
The table below provides information on the Drill Through tab name and the related columns that the code, name, label selection is applied to.
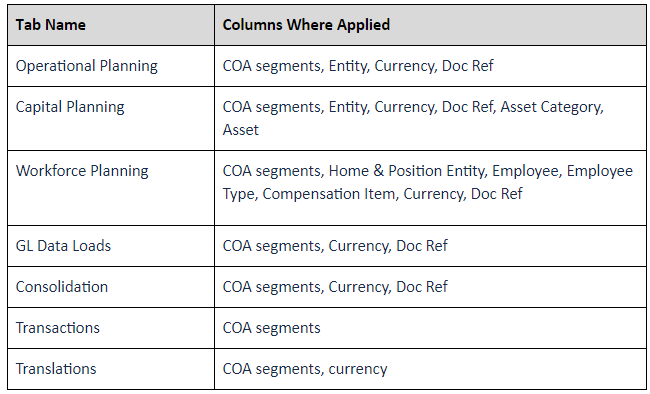
Shared Mode Data in Enhanced Drill Through
For information on how Shared Mode works, please click here.
When Shared Mode is enabled in your application, GL data is displayed under the Operational Planning tab (as shown below) when you’ve drilled through from a Dynamic Report, irrespective of whether the data is posted from the Budget Control Panel or Data Load Rules.
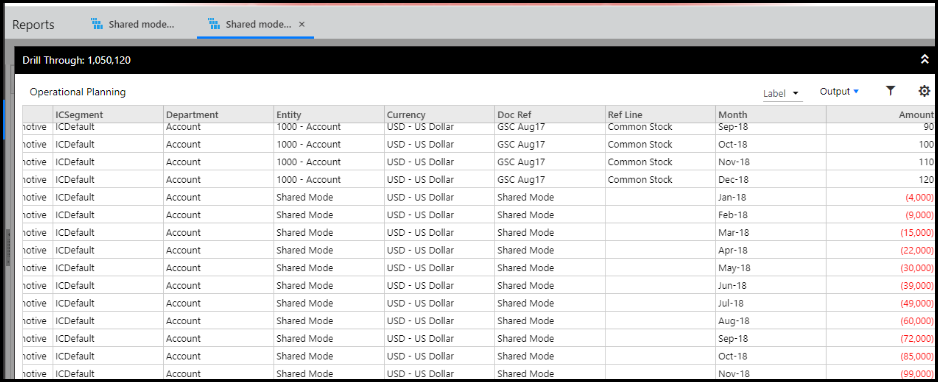
However, when data is loaded using multiple sources within Shared Mode, the data is overridden for a given segment combination resulting is the display of the latest details. This means that the history data is not maintained and Planning templates will be updated with the latest data only after running the Simulation Engine or opening and saving each template.
In applications where Shared Mode is enabled, Entity and Doc Ref/Template columns display as Shared Mode in the Operational Planning tab for the applicable Template Types and Scenarios as shown below.
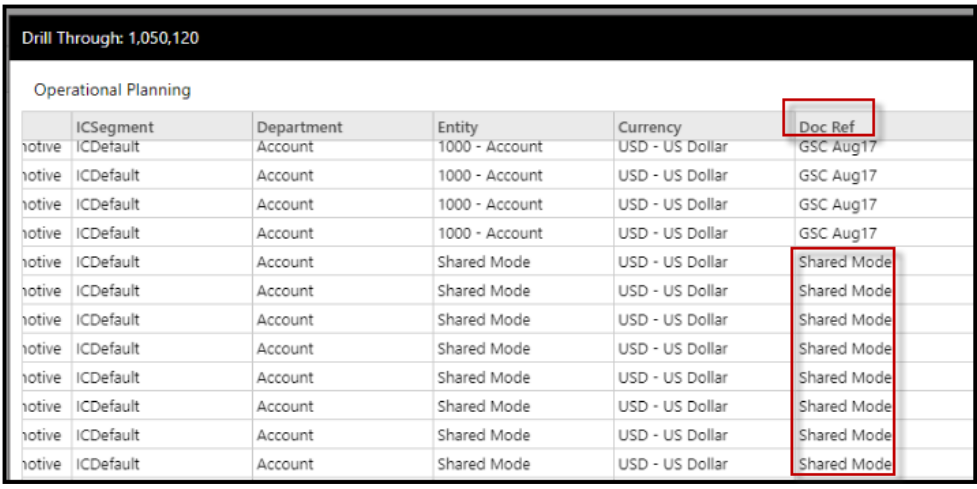
Lines and sublines are displayed if data is posted from the Budget Control Panel. However, the data displayed for each period is pulled from the most recently updated source. If data is uploaded only via Data Load Rules, it is displayed under the Operational Planning tab, but, lines and sublines will be empty and hidden from display.
Drill Through Sort Order
The sort order based on the type of data you are drilling through to is provided below.
Capital Planning:
Entity, Doc Ref ,Asset Category, Asset, Segments, Month
Operational Planning:
Entity, Doc Ref, Ref Line, Subline, , Segments, Month
GLData:
Doc Ref , Segment, Month
Workforce:
Home Entity, Employee, Position, Compensation Item, Segment, Month
Consolidation:
Type, Doc Ref, Line, Segment, Month
Transaction:
Segment, DateTime, Amount
Translation:
Segment, Month, Amount
Important Drill Through Details
Drill Through works with dimensions, report sets, attributes, attribute hierarchies, alternate hierarchies.
For QTD, YTD measures, drill through data is displayed from the beginning of the period to the current period.
Data honors the formatting from the source cell and the user locale.
All transaction amounts are displayed in Common Currency irrespective of the reporting dimension applied on the report/source cell. Transaction data exists only for Actual Scenarios.
Operational and Capital Planning data is displayed in Local Currency irrespective of the reporting dimension applied on the report/source cell. Operational Planning data exists only for Budget/Forecast scenarios.
In the Operational Planning tab, when you turn off Sublines or Lines, the report is re-rendered, which removes the associated rows and columns associated. If both lines and sublines are turned off, data is aggregated at the Doc Ref (Template) level. If Doc Ref is turned off, data is aggregated for the unique segment and currency combination.
In the Capital Planning tab, when you turn off Asset, the report is re-rendered, which removes the rows and columns associated and the data is aggregated for Asset Category. If Asset and Category are turned off, data is aggregated at the Doc Ref (Template) level. If Doc Ref is turned off, data is aggregated for the unique segment and currency combination.
In Operational and Capital Planning tabs, you can click on the hyperlink available in the Doc Ref column of any record in the report to open the corresponding source document template. The Source template opens in a new browser window. The user security for the budget entity and the navigation access permissions to the template are honored while opening the template.
When you export a drill through report, all sources are exported to Excel. Each source on the Drill Through report becomes a tab in the Excel workbook.
Metadata is shown in exported Drill Through reports. Metadata includes the data shown in the Drill Through report, the dimensions, and the date and time of report generation.
The Drill Through report allows a maximum of 30K rows per source.
Using Formulas and Formula Exceptions in Dynamic Reports
Formula Exceptions
Click Formula and select Formula Exceptions from within the Dynamic Report interface. Use formula exceptions to override the calculations performed on report results.
Add formula exceptions by clicking on the Add Row… link.
Once a new blank row is added, enter a cell or a range of cells and the formula that the exception will apply to. The range of cells must be entered as follows: E1:E26 . Formulas must start with an = (equal) symbol.
Formulas
Use the Quick Functions menu to select functions like Sum, Average, Count, Max, and Min. The resulting amounts are displayed when you select the range of cells in Excel mode.
Decimal places are displayed in Dynamic Reports based upon whether Report Sets are used or not. When Report Sets are not used in a Dynamic Report, decimal places displayed in quick functions are identical to those in the Dynamic Report. When Report Sets are used, decimal places in quick functions allow for the maximum number of decimal places allowed for a selected range.
A column or row with the Excel Formula function can be used to write advanced or complex Excel formulas in the report.
Each cell can have a different set of formulas.
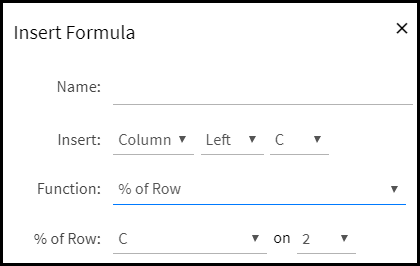
Available Functions
% of Row – Select a row and column intersection as the basis for percentage of all other rows on the spreadsheet. For example, select Column B, Row 3 which contains 100 dollars. And you want to insert a new column with % of Row function. A new column will be added based on the selections made on the Insert Formula page. The new column will result in 100% for Row 3 with 100 dollars. But, if Row 2 only contains 50 dollars. A percentage of 50% will be displayed.
Average – Average the amount of two rows or columns.
Comments – Add a row or column where you can add comments.
Count – Add a row or column that totals the count of columns or rows.
Max Value – Find the maximum value of a column or row.
Min Value - Find the minimum value of a column or row.
Q&A – Add a row or column where you can add questions and enter answers.
Column Total – Add a row or column that provides the summed amount for the selected row or column.
Sum – Find the sum or two rows or columns.
Variance – Find the difference between two rows or columns.
Variance % - Find the percentage of the difference between two rows or columns.
Custom Formula – Enter a row or column where you can create a custom formula to apply.
Name – Enter a name for the formula you are inserting.
Insert – Select the area of the report where the formula will be inserted.
Function – For example, if you want the sum the total of a column, select this function.
Applying Substitution Variables on the Members Pane
How it Works
Substitution variables are available for selection on the Members pane and can be applied to the page, row, or column.
Example: A dimension is added to the page axis and the @CURBDGT@ substitution variable is selected and added to the Mapped Members pane, which means that the substitution variable is applied as a page axis member
This feature is available in Dynamic Reports only and is not available when a Dynamic Report is used in the Financial Package Publisher.
When substitution variables are selected in the member selector for a row or column axis, the values are displayed as row or column headers in the report output. When you run the Dynamic Report, you are prompted for variable values.
Substitution variables can be added to the Pick List. All report functionality (drill through, formatting, and grid actions) is available for substitution variables values when applicable.
Building Dynamic Reports Using Report Sets on the Row and Column
Overview
The typical structure of a Dynamic Report consists of a report grid. For example, an income statement report might be shown on the column axis and income statement accounts along the rows axis. At the intersection of each member along each axis, a cell displays the measure data for the selection of company and department.
In a report, both rows and column axis members may be a direct or may be a pre-defined group of members called Report Sets. Report Sets are individually designed on a specific dimension. Once created they can be referenced in multiple reports. Typical examples of Report Sets are; Income Statement, Balance Sheet, and Cash Flow statements on an Account dimension or yearly, quarterly, and monthly on a Time dimension. Report Sets on the row of a Dynamic Report are referred to as Row Sets. Report Sets on the column axis of a Dynamic Report are called Column Sets.
Steps to Build and Run a Dynamic Report
Build and Run a Dynamic Report
The information below provides a high-level overview to create a Dynamic Report.
From the File Cabinet, click the Add list box and select Dynamic Report.
Select a reporting area, which represents the multidimensional cube upon which the report will be built.
Drag and drop dimensions for page, row, and column axes to complete the structure or design of your report. Alternatively, use Report Sets on row and column axes.
Map (associate) dimension members and lock desired dimensions using the Mapped Members pane.
Select Member Options.
For Report Sets, use the Member Selector pane to select and lock properties.
Click Header & Footer to select options (style, color, format) to display header and footer details on your Dynamic Report.
Drag and drop variables to the Header & Footer fields.
At this point, you can preview or run the report.
Manipulate report output by suppressing empty columns or rows, performing pivots, selecting report ranking details, and enabling drill through capabilities.
Modify formula exception details.
Enable functions, which you can use to create calculations with assistance, rather than entering them manually in the formula bar.
Save the report.
If a Dynamic Report in a Report Collection or Financial Package Publisher fails due to concurrent processes running or OLAP connectivity issues, Planful will automatically perform a reprocess. The maximum number of retries allowed is 3. With the Retry option, the chances of getting errors (listed above) is reduced significantly. However, because these reports are re-executed up to 3 times, the overall execution time is increased when errors are encountered.
Dynamic Report Output
Variables
Once report output is generated, there are indicators to represent where in the report the variables are used .
R - represents that a substitution variable is used in the report set lines applied to the Dynamic Report.
H - variables have been added to the report header.
F - variables have been added to the report footer.
Sort
Sort selected report output. Available in Excel view only (not HTML view).
Pivot
Pivot a column selection to row and a row selection to column.
Rank
Rank dimension members. Select Rank to open the Rank page. For each dimension, select a top or bottom ranking, a measure and count. Ranking methods include; Top, Bottom, Top %, and Bottom %.
Exporting Output
Export Dynamic Reports to PDF, XLSX, or Google Sheets; print the report; or email the report.
Header and footer information will repeat on each page of the PDF or print output. When you print a Dynamic Report, the Print Setup dialog page is displayed. On the Print Setup dialog page, select the Delete all extra Rows & Columns checkbox to remove extra data rows and columns from your Excel export. If the checkbox is not selected, the Row IDs in the Excel output match with the Row IDs within the Excel view of the report. The Delete all extra Rows & Columns setting is carried forward to Report Collection Excel outputs. Extra rows and columns are deleted or retained in the Report Collection based on the source Dynamic Report configuration.
The row and column header are repeated in each page of a Dynamic Report by default. On the Print Setup page, you can deselect Repeat row header on each page and Repeat column header on each page.
Note:Dynamic Reports exported as Google Sheets always repeat the headers in the print output irrespective of the Repeat Header configuration done in the Dynamic Report Print Setup.
The option to delete extra rows and columns is not applicable for Financial Package Publisher as hidden/suppressed/extra rows/columns are not displayed in Financial Package Publisher output.
Your Excel output will be different if the Delete all extra Rows & Columns option is selected for existing Dynamic Reports. Macros used for Excel output need to be re-adjusted manually.
Google for Work must be configured by your System Administrator in order to enable export for Google Sheets.
You can change the default functionality so that your reports are exported in unprotected view.
To avoid overlapping headers with report lines when printing, the default top margin in Print Setup is set to 3.5 inches.
Editing Exported Dynamic Report Output
Use unprotected view to edit exported Dynamic Reports. Complete the following steps to export your reports in unprotected view:
Open Microsoft Excel.
Select File > Options.
Under Options, select Trust Center in the left pane.
Click Trust Center Settings.
Click the Protected View in the left pane of Trust Center window.
Uncheck Enable Protected View for files originating from the Internet and Enable Protected View for files located in potentially unsafe locations options.
Click OK.
Suppressing Indents
This option is available for Report Sets on the Mapped Members pane. Selecting this option will remove indents from the output for the selected member(s), children, all children, the selected member(s) plus the children, the selected member(s) plus all children, leaves, the selected member(s) plus leaves, or the selected member(s) plus the parents.
Save As
When a new Dynamic Report is created using Save As, the Pick List member selections are copied and applied automatically.
Copy
When you make a copy of a Dynamic Report, the system automatically copies and applies Pick List member selections.
Snapshot
Take a snapshot of your Dynamic Report so you can export it to Excel and save it to your desktop or in a folder in the File Cabinet.
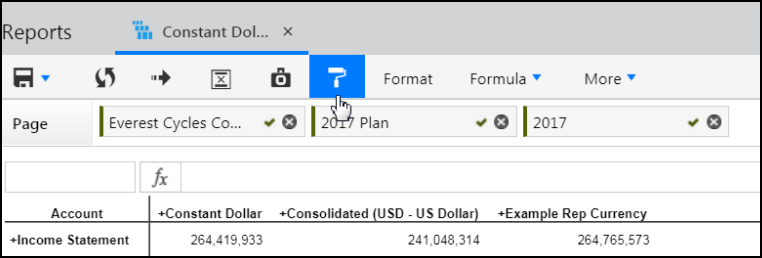
Copy Format
Use Copy Format to copy the formatting of text or cells in your report output.
Open a Dynamic Report.
Select the test or range of cells you want to copy the format of.
In the toolbar, click Copy Format .
Select what you want to paste the formatting onto.
Format
Ctrl+M
Access the Rule dialog page, which displays the rule(s) used to generate the report.
Usage Report
Run the Usage Report to display all artifacts that are part of a Dynamic Report.
Label – Represents the artifact such as report.
Type – The artifact type such as KPI.
Path – The location of the artifact.
Export – Export the report to Excel.
Artifacts included in a Usage Report are Financial Package Publisher, and Templates.
You cannot delete Dynamic Reports that are referenced by other reporting artifacts. Remove the reference in the other reports before deleting the Dynamic Report.
How to Modify the Look and Feel of Dynamic Report Output
The information below provides details on how to modify the design of Dynamic Report output as the design of reports consumed (or data pulled) into a Dynamic Report is based on the original report setup.
Example: Let’s say you have a report set called Net Income in your Dynamic Report. Net Income displays in your Dynamic Report with a purple background, which you don't like. To change the color of the output, in this case, open and edit the Report Set. To do so, complete the steps below:
Navigate back to the File Cabinet and locate Income Statement Base.
Select the checkbox next to Income Statement Base and click Setup.
On the Report Set Setup page, select the line and click Format.
Select a different Background Color.
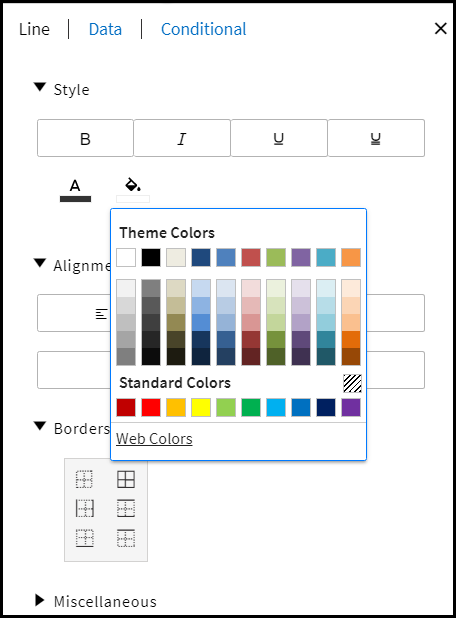
Click Save. Return to the Dynamic Report and click Run.
Net Income will now have a new background color.
Drilling Capabilities in Dynamic Report Output
Drill down – hierarchical drill - expand a line on the report to see data for lower level members in the main/alternate/attribute hierarchy
Drill through – drill on a number into the transactional data or translational details that were loaded with Data Load Rules. Drill through to Operational Planning (for Preloaded and Forecast scenarios), Workforce Planning from GL Data and Data Load Rules data.
Examples of How Drill Down is Supported:
Time dimension data - For example, if you expand 2017, you can view data for the 4 quarters associated with 2017. If you expand each quarter you can view data for each month.
Variable data - If you expand a variable, such as @CURYR@, you can view data for the 4 quarters associated with the current year variable. You can expand the quarters to view data for each month.
Simple Rule in a Report Set - For example, you define a line as follows:sum({4010 - Gross Sales , 4020 - Royalties , 4030 - Indirect Sales , 4100 - Intercompany Sales - Mfg})
You can drill down to view data for 4010, 4020, 4030, and 4100.
Or, let's say you define a line as follows:
sum({@CURMTH@ , @CURMTH-1@ , @CURMTH-2@ , @CURMTH-3@ , @CURMTH-4@})
You can drill down to view data for the current month and the previous 4 months.
A rule represents data elements in the cube similar to rules created in Excel (similar to cells, rows, and columns). Report Sets are built using rules.
Report Sets are flexible reporting tools that can be used on the row or column axis of a Dynamic Report. They are created on a specific dimension and typically contain members of other dimensions. Report Sets contain the link from the report lines to the account segment hierarchies, and these links are created using Rule formulas.
For example, you might use a Rule to map a Gross Margin line of an Income Statement to a Gross Margin member on an Account Segment Hierarchy. Typical examples of report sets are; income statements, balance sheets, and cash flow statements.
Examples of How Drill Through is Supported:
You have Net Income on row and Aug-17 on column. Click the number and drill to the daily transactional or translations data. Note that this works only if the data was loaded with Data Load Rules.
You have Net Income on row and @CURMTH@ on column. Click the number and you can drill to the daily transactional or translations data if loaded via Data Load Rules.
You have Net Income on the row and sum({@CURMTH@ , @CURMTH-1@ , @CURMTH-2@ , @CURMTH-3@ , @CURMTH-4@}). When you drill through, you can view the transactional or translations data for the current month and the previous 4 months.
You have ([Account].&[1068],[Department]. &[101],[Project].&[565]) on row defined using the Multiple dimension option in Report Sets and MTD on column. You can drill to the daily transactional or translations data.
Drill-through displays values from the beginning of the year to the current period when YTD or QTD are applied.
Values displayed in the drill-through pop-up window are applicable for all periods, from either the beginning of the current fiscal year or the period selected during report design. For example, if current month is set to September, drill-through displays the values from January until September if YTD is the Measure applied.
The columns for transactional or translation drill through data can be sorted in the pop-up window.
Best Practices
Best Practices and Tips
The following best practices and tips are recommended for best use of functionality, enhanced processing time, and decreased report set up and design time.
Row and Column Sets
Scenario should be on the page. For example, if the column set has current year, prior year and budget, then Actual should be on the page and budget on the column.
If one dimension (not the one the row set or column set is defined on) is on many of the rows or columns, it should be moved to the page level and not mapped.
If there are several accounts that are to be combined on one line, it is better to list each of the accounts on a separate line, hide those lines, and then combine with an Excel formula in a row set.
Save As/Copy
Use Save As/Copy to quickly create reports with similar data.
Report Set Use
Use Report Sets as templates to create formatted and strategic reports.
Report Design
Design reports with dimensions for operational reports.
Lock Data
Before you run the report, check if Lock Data settings are appropriate for the period you want to view the report. Navigate to Maintenance > Reports > Lock Data and click the Lock Data tab.
Excel View
Use Excel view if the report you want to design is interactive (formula exceptions, insert formula columns, or sorting). Navigate to the File Cabinet and select a Dynamic Report. Open the report and click Excel . Return to the HTML view by clicking HTML.
Report Security
Apply Report Security to control user access to a report. From the File Cabinet, click Report Access for a selected report.
Report Output and Sharing
Use report output options for quality PDF output. Share the report with others via email.
Header and Footer
When using large amounts of content in the header or footer cells, adjust the margins in print settings so that the content fits the page.
When exporting a Dynamic Report to PDF, remove underlines and double underlines under the page number as this formatting is not supported.
The alignment of an image in a header/footer cell is applied only when you move out of the cell.
Page number must be used on the 2nd or 3rd column of the first header row. If page number is applied on any other cells, you might not get the desired result in PDF or Excel outputs.
Use one image per cell. Image should not be used with text.
Logo Limitations
Max logo size: 64 (height) x 150 (width) pixels
Max physical size: 50 kb
Recommended file format: jpg
Drill Down
Using drill down functionality when you have selected + all children, selected + leaves, selected + parents, or selected + children is not recommended.
Tips
Ensure that only required member selections are made on each axis.
Organize segment hierarchies intuitively to get best results on drill-down. Drill-down works well with hierarchies on multiple levels, but is not functional when you have a flat hierarchy (for example, 300 members under a single node).
Ensure that required transactions or translations of data are loaded into the application so that you can retrieve this data in reports.
Dynamic Reports and Planning
Mapping Reports to Planning Templates
One or more Dynamic Reports can be mapped to a single or multiple Planning Templates. This mapping is done by an Admin user and takes place on the Template Setup page. The mapped reports are run from the Planning Control Panel and displayed on the Planning Template Input and/or View page.
How to Modify a Dynamic Report from the Template Interface Accessed from the Planning Control Panel
A full access user or reporting administrator can access a Dynamic Report linked to a Template from the Planning Control Panel.
A full access user can modify the design of the report (as in the Dynamic Report interface) and save changes made to the Dynamic Report from the Planning Control Panel. Users with read-only or regular user access without edit permission can make changes, but cannot save (or save as) these changes to the report. If an object on the page is locked, a read-only user will not be able to modify member selections for that dimension.
The following modifications can be applied to a Dynamic Report accessed from the Planning Control Panel:
Drag and drop objects from the left pane into the layout area.
Drag and drop objects from the layout area to reorder or remove them.
Make changes to member selections on the page/row/column axes.
Make changes to the header/footer.
Make changes to items such as suppression, format, insert formulas, formula exceptions, rank, sort, charts (if opened), pivot, grid actions, substitution variables values, and pick list.
A full access user or reporting administrator can save the changes back to the original report or perform a Save As.
When you map Dynamic Reports to Templates and execute the report, the original report selections are replaced on the Scenario and Budget Entity combination segments (if applied to the page) with the selections from the budget templates and entity mappings. These selections are applied from the budget templates/entity mappings only if the dimensions/attributes/attribute hierarchies exist at the page level in the Dynamic Report. However, the selections for Scenario and Budget Entity combinations are not updated automatically in the original Dynamic Report. For all other dimensions/attributes/ attribute hierarchies and objects on the row or column axis, the original report selections are retained when the Dynamic Report is run from the Planning Control Panel.
Template Notes in Dynamic Reports
Display template notes for members in a Dynamic Report. The advantage of this feature is the ability to see notes recorded in a template within the Dynamic Report interface and output. For example, a user can make a note in a template that a department will gain a certain amount in funding or gain a headcount in the coming quarter. This information is important when reporting on the department budget. So, displaying notes like this provides pertinent information in reports without having to open the template in the Planning Control Panel.
Notes entered in the template are displayed in a Dynamic Report only after the template is opened and saved at least once from the Budget Control Panel. Or, if the Simulation Engine is run for the template.
Template notes be displayed at the rollup level in a Dynamic Report. This functionality provides a more comprehensive look at notes for all members in a Dynamic Report. When you drill down on a rollup member, you will see the notes associated with the leaf members under the rollup member.
Notes displayed in a Dynamic Report are consolidated across all templates (irrespective of the template access) honoring dimension security. Notes are consolidated into Dynamic Reports from all templates of type Global Template Single Copy, Global Template Entity Copy, Allocation, Line Item, Capital, and Initiatives. Notes are not supported when Attributes, Attribute Hierarchies, Alternate Hierarchies, or Dynamic Report Sets are used in a Dynamic Report.
How to Display Template Notes in a Dynamic Report
Open the Dynamic Report.
Click the More listbox.
Select Show Notes. You can also select Hide Notes to hide them from display.
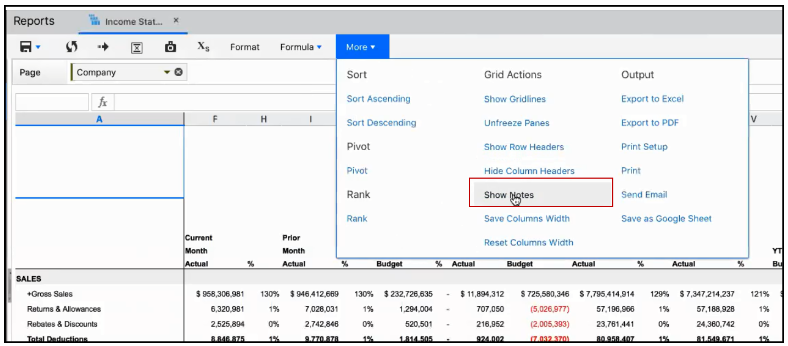
Once you click Show Notes, a Notes column is displayed on the report and notes are displayed for each line in the report. Notes are always vertically bottom aligned like the other cells in the report.
A date/time stamp with user name is added to the beginning of each note. The date/time stamp format is applied based on user location and language settings.
Guardrails:
The maximum number of characters displayed in the notes field is 1024, which includes that username and date/time stamp.
You can have up to 250 notes per report. If you exceed 250, the following message appears:

Notes are aggregated and displayed when coming from several sources. For example, notes sourced from multiple templates for the account and scenario combination. Consolidation happens for multiple scenarios, companies, departments, and so on for the page or column axis for leaf members in the hierarchy.
Notes are retained when running a Dynamic Report in a Report Collection or Financial Package Publisher. Notes are also retained when the Dynamic Report is sent in an email or exported and when you save a snapshot of a Dynamic Report.
Notes are not time bound. For example, if a scenario’s duration is Jan 17 to Jan 19, but the time selected in the report is Dec 16, notes are till displayed for these lines even though data does not exist on those scenarios for Dec 16.
If you suppress empty rows/columns, corresponding notes are also suppressed. Similarly, if the report line does not have any data, notes are also not displayed for those lines.
When Templates Notes Will NOT Display
Notes are not supported for display in the following Report Set configurations:
Advanced MDX formula
Dynamic report sets functionality
Repeat Labels in Dynamic Reports
Labels in report output are for informational purposes. In the output below, Repeat Labels is turned on.
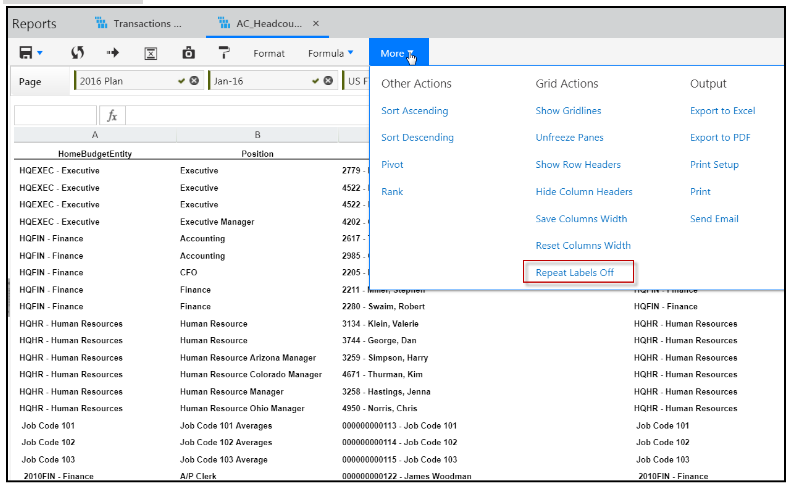
Now, the same report output is shown below with Repeat Labels turned off.
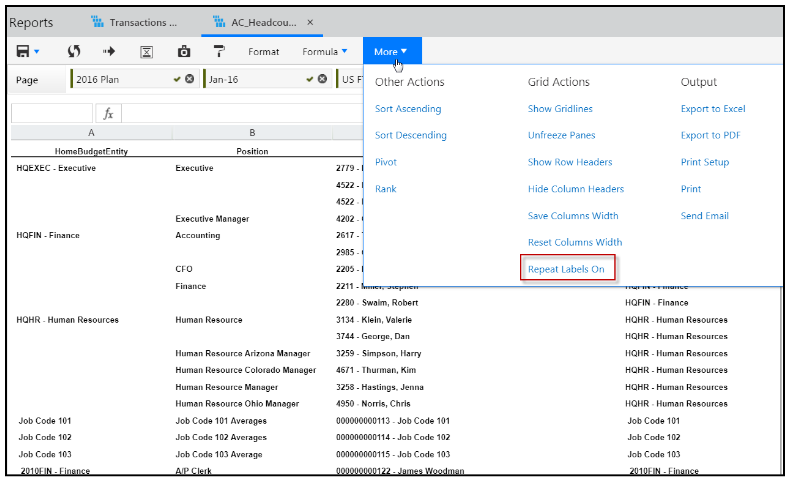
To turn Repeat Labels Off:
In the Dynamic Report output screen, click the More list-box.
Select Repeat Labels Off.
To turn Repeat Labels On:
In the Dynamic Report output screen, click the More list-box.
Select Repeat Labels On.
Dynamic Reports and Financial Package Publisher
Integrating Dynamic Reports with Financial Package Publisher
Add Dynamic Reports to the Financial Package Publisher from within the Financial Package Publisher interface. Within Financial Package Publisher, select Dynamic Report as the Content Type and select the Dynamic Report you would like to include in the Financial Package Publisher report.
Use Cases
Creating a Dynamic Report
In this use case, the consolidated income statement shown below will be created. A report set is created for the row and another for the column axis. The information below walks you through the steps to recreate this Dynamic Report. It does not include information on how to create the report sets used on the row and column axis. For information on how to create a report set, see Creating a Variance Report with Forecast and Prior Year to Report Operating Expenses for a Selected Company, Scenario and Time.
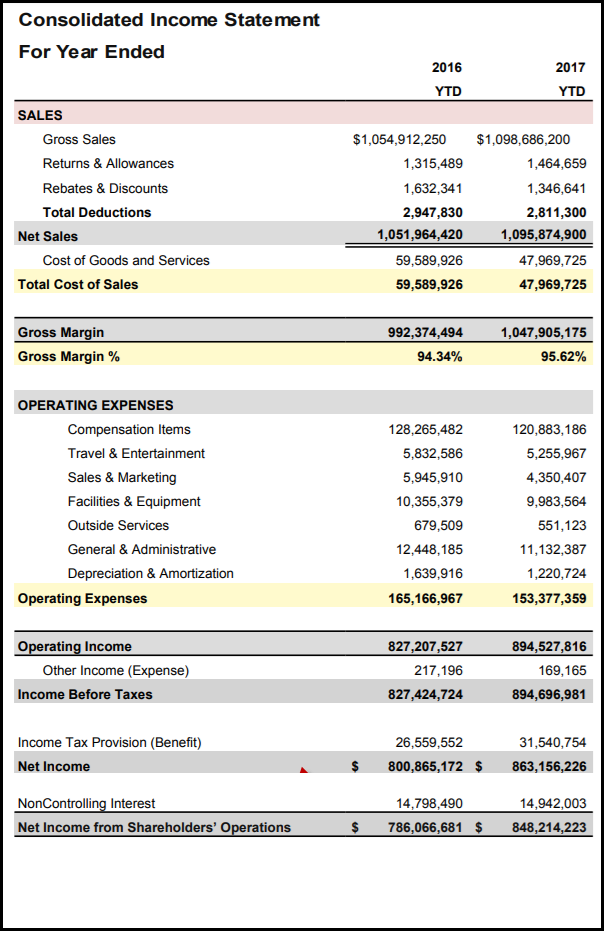
Access the File Cabinet.
Click the Add button.
Select Dynamic Report.
Select the Financial Reporting Area.
Drag the Company dimension to the Page axis and click on it to display the members.
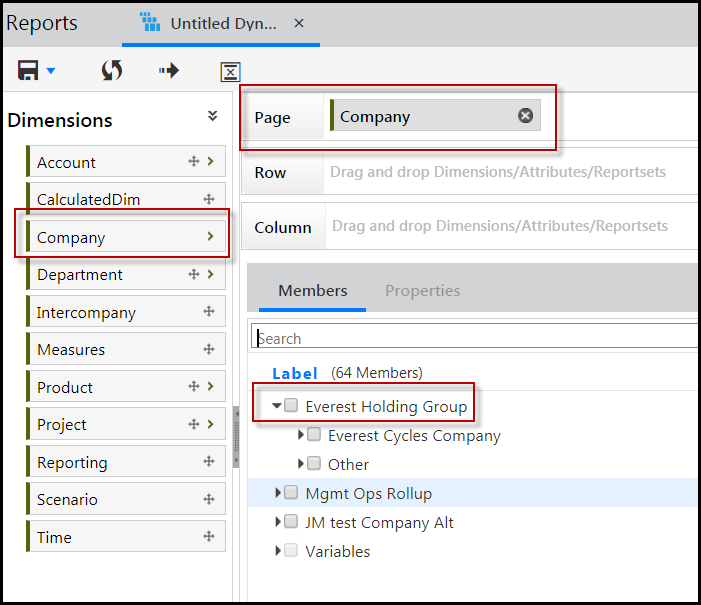
Select the Everest Holding Group.
Click Report Sets.
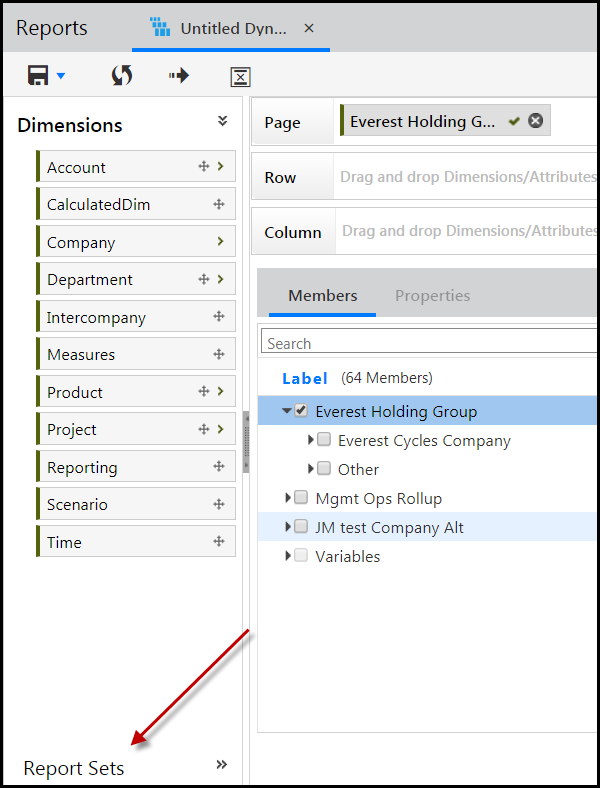
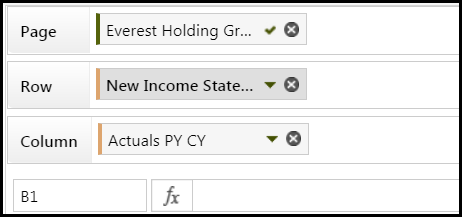
Drag the Account Report Set to the Row. Select New Income Statement.
Drag the Scenario Report Set to the Column and select Actuals PY CY.
Click the forward arrow to run the report. You're done!
Creating a Variance Report with Forecast and Prior Year to Report Operating Expenses for a Selected Company, Scenario and Time
This use case example steps you through a process to create report sets and add them to the row and column of a Dynamic Report to produce the output shown below.
Report Structure:

Create a report set on an account dimension.
From the File Cabinet , click Add and select Report Set.
Select Static for Type.
Enter Operating Expenses for Code and Name.
For Reporting Area , select Financial.
For Dimension , select Account.
For the target report set Folder selection, select Report Sets.
Click Save.
Selecting a reporting area determines the dimensionality for multidimensional reporting.
Build the Row Set.
Enter 7 and click Add to insert 7 rows.
Set each line Type to Reference Account.
Set the Variance for each line to -1.
The Variance property value is used in the calculation of a favorable budget variance. A favorable budget variance is a better actual result than the amount that was budgeted.
Set up rules for reference account lines.
Select a reference account line and click Add under the Rule column.
From the Rule tab, select the account dimension members from the account hierarchy for each line.
As the account dimension members are selected, the rule is built. An example is shown below.
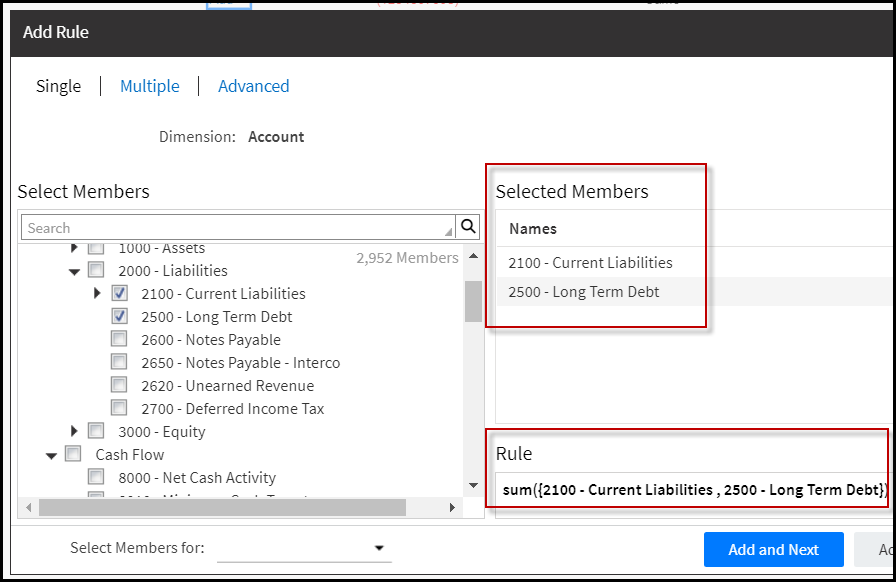
Click Add and Next to move from one row to the next.
When a reference member definition directly corresponds to a member selection on the dimension used for building the report set, the member definitions are treated as dynamic members because they yield better performance over member references to multiple dimensions and advanced functions and formulas. During report set setup it is highly recommended that you evaluate the definitions to minimize the multiple dimension references or using the .CurrentMember functions in the MDX definition.
Create a report set on a measures dimension.
From the File Cabinet , select the Add list box and click Report Set.
In the Code text box, enter Variance Reporting (Vs Fcst & PY).
For the target report set Folder selection, select Report Sets.
Select the Financial Reporting Area.
Select Measures for the Dimension.
Select a Static report set type.
Click Save.
Build the Column Set.
Insert 8 lines.
Select Excel for two lines and set up formulas as follows.
Enter Var to Forecast as the name for line 1. Enter the following formula in the Frml (formula) field: = (CY Actual - CY Forecast) * Variance
Note:To show a favorable budget variance, the variance property value for each line from the report set is placed on a row. To include this value, set up a line of type Variance column set and use it for variance reporting. Favorable variance examples include: actual revenues are more than the budget or plan; actual expenses are less than the budget or plan; actual manufacturing costs are less than the budget for the period.
Enter Var to PY as the name for line 2. Enter the following in the Frml field: = (CY Actual – PY Actual) * Variance
Set up line formats. Select the Percent format for Var% lines.
Select the number of decimal positions for the lines. Select 1 decimal position for Var% lines.
Hide the Variance type line by selecting the Hidden property.
Click the background fill bucket and select White Smoke to set the background color for header lines.
Click the Borders list box and select Top and Bottom Border for each report set line.
For report column formatting, each report line is derived based on the formatting from row set lines. To override this default behavior for specific columns, use special type formatting for the report set lines. Special type formatting options applicable for report sets are: Number, Percent, and Currency.
To apply column borders (left and right) for reports, select the Top and Bottom Border option for report set lines used on the column axis of the report. The Top and Bottom Borders are transposed to left and right borders when used in the report set on the column axis of a financial report.
Set 3 rows to Reference Account for Line Type. Set up Rule expressions for each row.
Select a Reference Account type line and click Add under the Rule column.
Click the Advanced Rule tab.
Add the rules below for Reference Account lines.
Rule Line | Rule Formula | Desc./Notes | |
|---|---|---|---|
CY Actual |
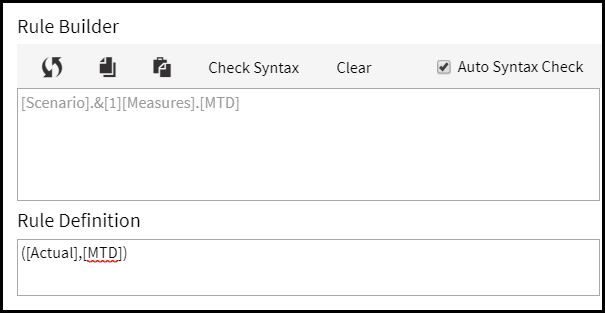
| For this line to represent Current Year or Current Period actuals, refer to two dimensions such as the Scenario dimension to reference Actual data and the Measures dimension to represent the measure data such MTD). When directly referencing members like this, add the references either from the Advanced Rule or Rule tab by selecting the Multiple Dimensions checkbox. Current Year or Current Period references is dynamically evaluated based on user selections at run time. | |
CY Forecast | Select MTD from the measures dimension and drag and drop it to the Rule Builder pane. | Current reference is dynamically evaluated based on user selections at run time. Similarly, a Current Year or Current Period reference is based on user selections. | |
PY Actual |
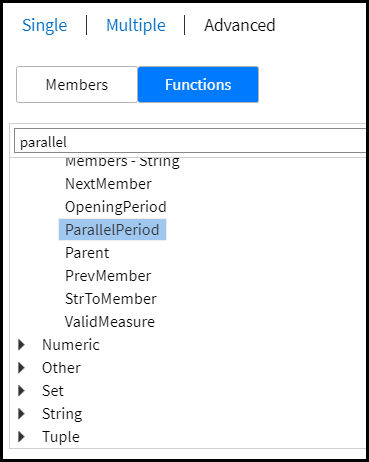
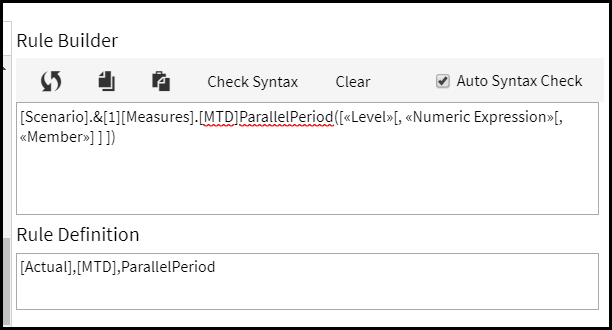
| The ParallelPeriod function involves the following three parameters:
|
Rule definition syntax :
A report set line can reference of members from one or more dimensions. It is essentially a multidimensional member.
When a line has a single member reference then it is a simple member reference on the dimension. For example: [Measures].[MTD]
When referencing more than one dimension, there is only one member from each dimension. To compose a member definition with more than one dimension, you must wrap the members in parentheses. For example: ([Scenario].&[1],[Measures].[MTD])
When a report set is built on a specific dimension, each report set line must have a reference to at least a single member of that dimension.
Create a Dynamic Report.
From the File Cabinet click the Add list box and select Dynamic Report.
Select the Financial Reporting Area and click OK.
Drag and drop the report set created for Account on the Row axis.
Drag and drop the report set created for Measures on the Column axis.
Drag and drop Company, Time, and Scenario dimensions on to the Page axis.
Setup header and footer details.
Click Header & Footer.
Drag and drop Company, Scenario and Time into the header section.
Drag and drop Current Date on the left column under the report Footer section.
Click Run to view the results.
Substitution Variables
How to Set Up Substitution Variables
You can use substitution variables in Dynamic Reports. Follow the steps below to create substitution variables, or, use the delivered variables.
Navigate to Maintenance > Reports > Cube Settings, and click theSubstitution Variables tab.
Review the list of substitution variables that have been defined /delivered.
Click Add to set up a new substitution variable on the Add Substitution Variable page.
Complete the fields on the Add Substitution Variable page. Note that substitution variables are defined for a reporting area and dimension.
Select the newly added substitution variable on the list page and click Derived Variables to view the corresponding derived variables.
Add new derived variables by clicking Add on the Derived Variables list page.
The Add Derived Variable page is opened. Complete the fields on this page.
How to Use Substitution Variables in Dynamic Reports
Substitution variables are used in the creation of Dynamic Reports. A substitution variable replaces a complex multi-dimensional expression (Rule) with a specified value. Substitution variables must be added to Report Sets as lines to be reflected in reports. Planful provides over 40 system-defined substitution variables.
The purpose of using a substitution variable is to:
Improve report performance
Improve Report Set maintainability
Dynamically display report column/row headers
Here is a list of places where you can use substitution variables:
In Rules and on row or column labels and headers.
To dynamically display report set lines.
As an efficient way to replace formula exceptions.
Example: To display the current period in the column header of a report, replace the column set’s line name with a substitution variable, such as @CURMTH@ . When the report is run, @CURMTH@ will be replaced with the actual month name Mar-18 . In the image below, the current year minus 1 and the current budget sub vars are used.
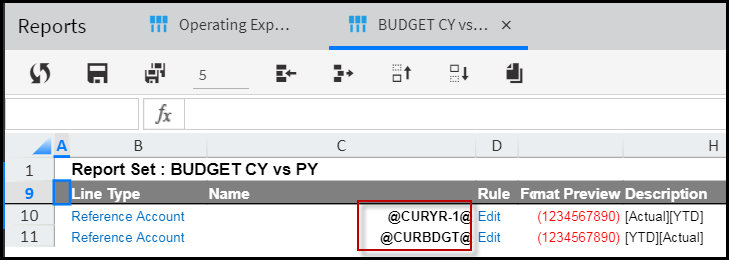
Combined with static text.
Examples: If the year is 2019
YTD @CURMTH@ will display YTD Jan-19
@CURYR@Actual will display 2019 Actual
To improve report performance by avoiding the use of calculated or measured dimensions when building column sets.
Example:
The following Report Set is commonly used:
| YTD | MTD |
| Actual | Budget | Variance | Actual | Budget | Variance |
Setting up this Report Set requires the usage of complex Rules that typically require a column set on a Calculated or Measured dimension and utilizes the Reporting scenario for the Budget column. The following table displays commonly used formulas to deliver report columns.
| Line Name | Formula Without Substitution Variables |
| YTD~Actual | ([Measures].[YTD],[Scenario].&[1],[Calculated].&[1]) |
| YTD~Budget | ([Measures].[YTD],StrToMember ("Scenario.&["+Time.Currentmember.properties("Budget_Id")+"]")),[Calculated].&[1]) |
| YTD~Variance | Custom Formula |
| MTD~Actual | ([Measures].[MTD],[Scenario].&[1] ,[Calculated].&[1]) |
| MTD~Budget | ([Measures].[MTD],StrToMember ("Scenario.&["+Time.Currentmember.properties("Budget_Id")+"]")),[Calculated].&[1]) |
| MTD~Variance | Custom Formula |
While the rules above deliver the expected result, they are complex. This complexity adversely impacts report performance. The same report can be set up more efficiently using Substitution Variables. The table below displays how Substitution Variables compare to the formulas in the table above.
| Line Name | Formula with Substitution Variables |
| YTD~Actual | ([Scenario].&[1] ,[Measures].[YTD]) |
| YTD~Budget | (@CURBGT@,[Measures].[YTD]) |
| YTD~Variance | Custom Formula |
| MTD~Actual | ([Scenario].&[1],[Measures].[MTD]) |
| MTD~Budget | (@CURBGT@,[Measures].[MTD]) |
| MTD~Variance | Custom Formula |
Performance for the Report Set depicted in the table above can be improved by moving the repeated member on the Page axis. The Report Set above uses [Measures].[MTD] and [Measures].[YTD] frequently. Move one of these members to the page level. For example, use the member [Measures].[YTD] o n the Page axis rather than repeating [ Measures].[YTD] on the first and second lines as shown in the table below.
| Line Name | Formula with Substitution Variables |
| YTD~Actual | [Scenario].&[1] |
| YTD~Budget | @CURBGT@ |
| YTD~Variance | Custom Formula |
| MTD~Actual | ([Scenario].&[1],[Measures].[MTD]) |
| MTD~Budget | (@CURBGT@,[Measures].[MTD]) |
| MTD~Variance | Custom Formula |
To improve report performance instead of reporting scenario functionality.
When using reporting scenario functionality to retrieve the budget and forecast for a selected year, you might use the following rule.
StrToMember ("Scenario.&["+Time.Currentmember.properties("Budget_Id")+"]"))
While the rule above delivers the expected result, it slows report performance. A performance improvement is to use Substitution Variables as described below.
| Line Name | Previous Approach to Formula | Formula with Substitution Variables |
| Current Budget | StrToMember ("Scenario.&["+Time.Currentmember.properties("Budget_Id")+"]")) | @CURBGT@ |
| Current Forecast | StrToMember ("Scenario.&["+Time.Currentmember.properties("forecast_Id")+"]")) | @CURFCST@ |
| Current Month Budget | (Time.Currentmember,StrToMember ("Scenario.&["+Time.Currentmember.properties("Budget_Id")+"]")),[CalculatedDim].&[1]) | (@CURMTH,@CURBGT) |
| Prior Year YTD | (Parallelperiod(Year,1,Time.currentmember),[Measures].[YTD]) | (@PREVYEAR@,[Measures].[YTD]) |
To improve efficiency in building report sets.
Substitution Variables aide in the setup and maintenance of time-based Report Sets, such as Trailing 12 months, along with Budget and Forecast columns. The following example displays a Trailing 12-month Report Set:
| Line Name | Previous Approach to Rule | Rule with Substitution Variables |
| Current Month | (Time.Currentmember,[CalculatedDim].&[1]) | @CURMTH@ |
| Current Month - 1 | (Time.Currentmember.Lag(1),[CalculatedDim].&[1]) | @CURMTH-1@ |
| Current Month - 2 | (Time.Currentmember.Lag(2),[CalculatedDim].&[1]) | @CURMTH-2@ |
| Current Month - 3 | (Time.Currentmember.Lag(3),[CalculatedDim].&[1]) | @CURMTH-3@ |
| Current Month - 4 | (Time.Currentmember.Lag(4),[CalculatedDim].&[1]) | @CURMTH-4@ |
| Current Month - 5 | (Time.Currentmember.Lag(5),[CalculatedDim].&[1]) | @CURMTH-5@ |
| Current Month - 6 | (Time.Currentmember.Lag(6),[CalculatedDim].&[1]) | @CURMTH-6@ |
| Current Month - 7 | (Time.Currentmember.Lag(7),[CalculatedDim].&[1]) | @CURMTH-7@ |
| Current Month - 8 | (Time.Currentmember.Lag(8),[CalculatedDim].&[1]) | @CURMTH-8@ |
| Current Month - 9 | (Time.Currentmember.Lag(9),[CalculatedDim].&[1]) | @CURMTH-9@ |
| Current Month - 10 | (Time.Currentmember.Lag(10),[CalculatedDim].&[1]) | @CURMTH-10@ |
| Current Month - 11 | (Time.Currentmember.Lag(11),[CalculatedDim].&[1]) | @CURMTH-11@ |
| Current Month - 12 | (Time.Currentmember.Lag(12),[CalculatedDim].&[1]) | @CURMTH-12@ |
| Current Budget | (Ancestor(Time.Currentmember,1,Year), StrToMember ("Scenario.&["+Time.Currentmember.properties("Budget_Id")+"]")),[CalculatedDim].&[1]) | (@CURYR@,@CURBGT) |
| Current Forecast | (Ancestor(Time.Currentmember,1,Year), StrToMember ("Scenario.&["+Time.Currentmember.properties("forecast_Id")+"]")),[CalculatedDim].&[1]) | (@CURYR@,@CURFCST) |
To overcome Rule Limitations.
You cannot use the same dimension on two axes simultaneously. For example, a report that requires a Report Set on the Time dimension, will not allow selection of Time dimension members at the Page level. To set up a trailing 12-month report, define the column set on either the Calculated or Measure dimension. Time should be on the Page axis. This setup does not use substitution variables so performance will not be optimal. With Substitution Variables, the report column set can be set up on the Time dimension directly and the required selections can be made using Substitution Variables, which will result in improved performance.
Security
Security and User Types
The following items describe the security access and roles required for successful execution of Financial Package Reports that contain Dynamic Reports.
If a user is a Report Administrator, they can run any Financial Package Report. All of the sections of the Financial Package Report will be rendered. Where the user's dimension security applies, that user will be able to view the data within the report.
If the user is a Report User:
The user can be given read or full control access to the Financial Package report or folder in Report Security, which allows that user to review the structure of the Financial Package report and preview it. To be able to view all artifacts contained within the Financial Package report, the user must have read or full control access to the artifacts (reports, documents stored within the File Cabinet). It is not required that users are given folder access to folders that contain stored artifacts in order for those artifacts to display accurately in the Financial Package output.
If a user is added as an owner of the report, that user can preview the output. All sections will be displayed and where the user's dimension security applies, the user will be able to view the data within the report.
The Owner of the report will be able to perform the following actions that a participant can’t:
Change the Code, Name, Description, Due Date, Report Folder, and Template associated with the report.
Change the Owner
Add Participants
Participants can preview and generate Finanical Package reports. If the user is not an Owner and is added to some sections of the report only as a Participant, that user will be able to Preview the Financial Package output, but will only see the sections for which they are Participants and data where their dimension security applies.
Participants are restricted by:
Any properties associated with sections which they have not been “Assigned To”
Financial Package Report properties
The inability to add a new section
The inability to add Report Access unless the user has been given “Full Control” of the Financial Package Report in Maintenance, Admin, User Management, User, More list-box, Report Access
Limitations
Dynamic Report Limitations
| Description | Limitation | Suggestions |
|---|---|---|
Number of lines in a static report row set used in Dynamic Reports | 600 | Use single member mappings in Reference Account lines |
Number of lines in a static report column set used in Dynamic Reports | 24 | Use substitution variables and Excel-based expressions for improved performance |
Number of children under a single parent at any level for Drill Down | 500 |
|
Number of lines in Drill Through | 30000 |
|
Size of logo used in report header | 64 (height) x 150 (width) pixels |
|
Physical size of logo used in report header | 50KB | Up to 2MB is allowed, but 50KB is recommended for best report output. |
Formulas | SUMIF, SUMPRODUCT & COUNTIF are not supported in Dynamic Reports |
|
Print Setup | PDF and Microsoft Excel output for Header and Footer | If you apply fit to 1 x 1 or 1 x 2 option in the Dynamic Reports Print Setup and the report has more than 9 columns, the header and footer section are likely to be improperly aligned in the PDF output. This also applies to Excel output when the Header & Footer configuration is set to ‘Header & Footer Section’. |


